Home Blog

ESD vs PSD: Difference Between Emergency Shutdown System and Process Shutdown System

0
ESD vs PSD: Difference Between Emergency Shutdown System and Process Shutdown System

In process plants, ESD vs PSD is not just a terminology debate. It is a practical safety and shutdown philosophy issue that affects how engineers design logic, select instruments, define cause and effect, commission loops, and maintain uptime. In many plants, the difference between ESD and PSD is understood informally, but not always documented clearly. That leads to confusion during operations, troubleshooting, and shutdown testing.

A Process Shutdown System is typically used to respond to abnormal process conditions before they become more severe. An Emergency Shutdown System is used when the condition has escalated into a hazardous situation that requires fast isolation, trip, or plant safe state action. Both belong to the broader shutdown architecture in instrumentation, but they do not serve the same purpose.

For EPC engineers, instrumentation engineers, control engineers, commissioning teams, and maintenance teams, understanding ESD vs PSD helps avoid weak shutdown logic, poor cause and effect design, and dangerous assumptions about what the DCS can or cannot do.

Avoid Compliance Failures With This Proven Safety Audit Guide: Advanced Safety Instrumented System (SIS) Inspection Checklist for IEC 61511 Compliance

PSD handles process protection, while ESD handles emergency protection.

PSD is about controlled protection. ESD is about immediate survival of the plant.

PSD protects the process from escalation. ESD protects people and assets from emergency hazard.

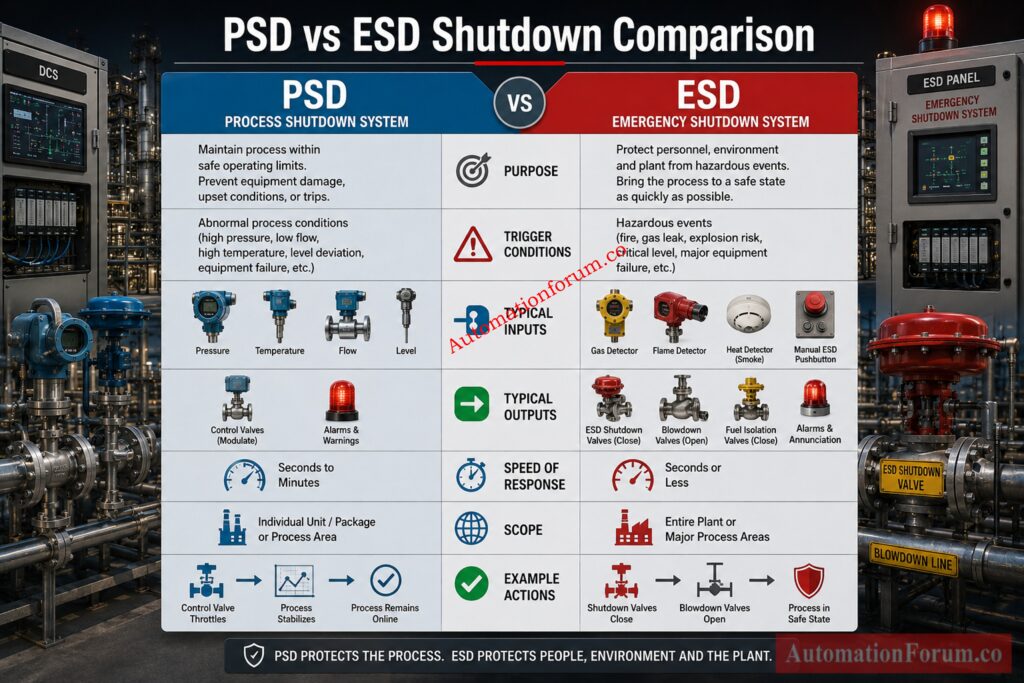
ESD vs PSD Difference Table for Process Safety and Shutdown Systems
AspectPSDESD
PurposeProtect the process from abnormal conditions and prevent escalationProtect people, equipment, and the facility during hazardous events
Trigger conditionsHigh pressure, low pressure, high temperature, low flow, pump trip, abnormal level, process deviationFire, gas release, explosion risk, toxic leak, major overpressure, critical containment failure, life safety threat
Risk levelProcess risk and equipment protection riskHigh consequence safety risk
Typical inputsTransmitters, switches, analyzers, flow signals, vibration signals, pump status, package permissivesFire and gas detectors, critical pressure trips, manual emergency pushbuttons, flame detectors, toxic gas detectors
Typical outputsClose control valves, stop pumps, isolate sections, alarm to operator, reduce load, initiate controlled shutdownTrip major equipment, isolate fuel or hydrocarbon sources, activate blowdown, depressurize, shutdown sections, initiate emergency safe state
Speed of responseFast, but often allows controlled shutdown sequenceVery fast, with priority on immediate hazard reduction
ScopeUsually unit level or process train levelOften plant wide, area wide, or critical asset wide
Relation to safety layersProtective layer between control and emergency shutdownFinal or near final protective layer for hazardous events
Commissioning focusSequence verification, interlock testing, field loop checks, permissive logic, reset behaviorTrip response, fail safe action, voting logic, override control, emergency pushbutton response, blowdown action
Maintenance focusProof testing, calibration, bypass control, alarm rationalization, logic validationProof testing, partial stroke where applicable, valve fail action, detector health, safety bypass management
What Is PSD in Process Industry?

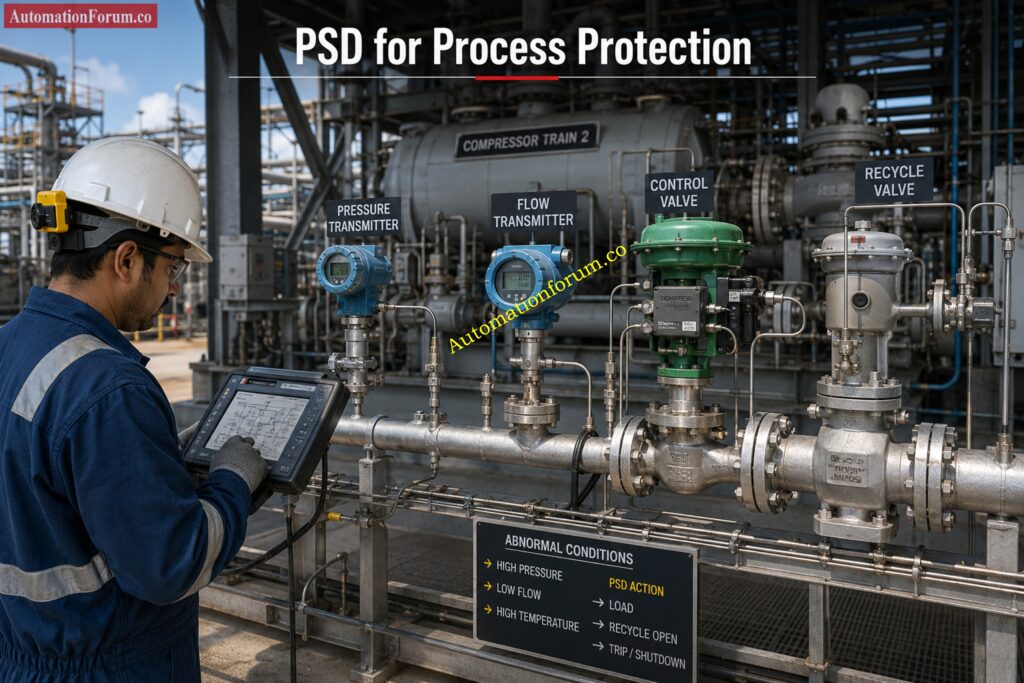
PSD stands for Process Shutdown System. In real plant usage, it is the shutdown layer that protects the process when operating conditions move outside safe or acceptable limits. It is not meant to be confused with basic control. It is a protection function that reacts when the process needs intervention before the situation becomes hazardous.

A PSD usually responds to process abnormalities such as:

  • High pressure in a separator, compressor suction line, or vessel
  • Low suction pressure on a pump
  • High temperature in a heater outlet or reactor loop
  • Low flow through a critical cooling or lubrication circuit
  • High level or low level in a drum, separator, or tank
  • Abnormal vibration on rotating equipment
  • Loss of critical utility such as cooling water, instrument air, or seal gas

The action taken by PSD is usually a controlled protective action. That may mean stopping a machine, closing an inlet valve, opening a recycle line, isolating a section, or triggering a shutdown sequence. In many plants, PSD may also start an alarm and request operator intervention before a more severe trip occurs.

In a compressor train, PSD may stop the compressor if suction pressure is too low, discharge pressure is too high, or vibration reaches a dangerous level. In a heater, PSD may trip fuel supply if the outlet temperature rises above the safe limit. In a cooling system, PSD may shut down a process unit if cooling water flow is lost and the process cannot be allowed to continue safely.

In the PSD in process industry context, the system is usually built to preserve equipment, maintain process stability, and prevent escalation. It is often a unit specific protective layer rather than a plant wide emergency action system.

Stop Confusing Shutdown Systems Learn Correct Applications Fast: ESD vs SIS Difference When to Use Each and Practical Engineering Guide

What Is ESD in Process Industry?

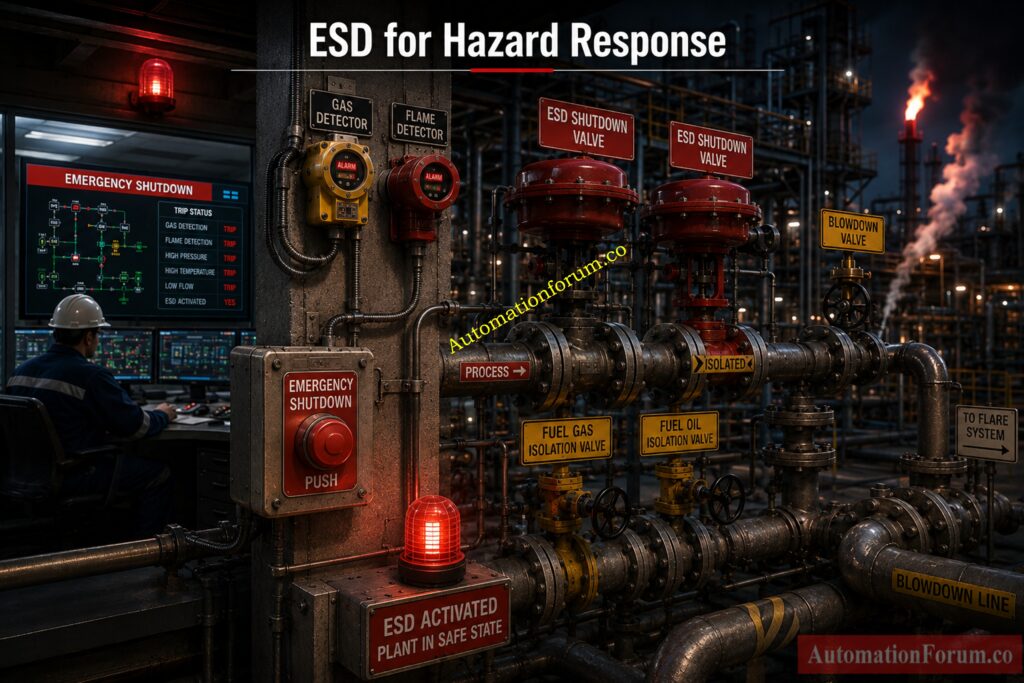
ESD stands for Emergency Shutdown System. It is the emergency response layer used when conditions have become unsafe or potentially life threatening. An ESD is designed to rapidly move the plant or unit to a safe state by isolating energy sources, stopping hazardous equipment, and reducing inventory or pressure.

An ESD is typically triggered by events such as:

  • Fire detection in a critical area
  • Gas detection above the alarm or trip threshold
  • Toxic gas release
  • Manual emergency pushbutton activation
  • Critical vessel overpressure
  • Major hydrocarbon leak
  • Flame failure in a critical combustion system
  • Severe process condition that threatens personnel or asset safety

An ESD may perform actions such as:

  • Shut fuel gas to fired equipment
  • Close emergency shutdown valves
  • Trip pumps, compressors, turbines, or engines
  • Activate blowdown or depressurization
  • Isolate feed and export lines
  • Send plant or area to a safe state

In the ESD in process industry context, this is the emergency response system that is closely associated with personnel safety, containment protection, fire and gas response, and major hazard control. It is often designed with higher integrity expectations than ordinary control logic.

Everything Engineers Must Understand About Functional Safety Concepts: What is SIS, SIF and SIL? An In-Depth Guide to Functional Safety in Process Industries

The easiest way to understand ESD vs PSD is to think in terms of escalation.

PSD acts when the process is abnormal but still under control enough to allow a managed response. It is often the layer that prevents a small deviation from becoming a major incident.

ESD acts when the event is severe enough that immediate shutdown and isolation are required. It does not wait for normal control recovery. It prioritizes safe state.

A PSD might stop a pump because suction pressure is too low.

An ESD might isolate fuel and depressurize a unit because a gas detector has confirmed a hazardous release.

That is the functional difference that matters in the field.

Many projects use the words differently. Some call unit trips “ESD” even when they are really process shutdowns. Some call plant shutdown logic “PSD” even when the action is clearly emergency in nature. That is why the actual function should always be read from the cause and effect matrix, shutdown philosophy, and safety requirement specification rather than from the tag name alone.

Calculate Risk Reduction Faster With Proven Verification Methods: SIF PFDavg / SIL Verification – Complete Guide + Online Calculator (IEC 61508 / 61511)

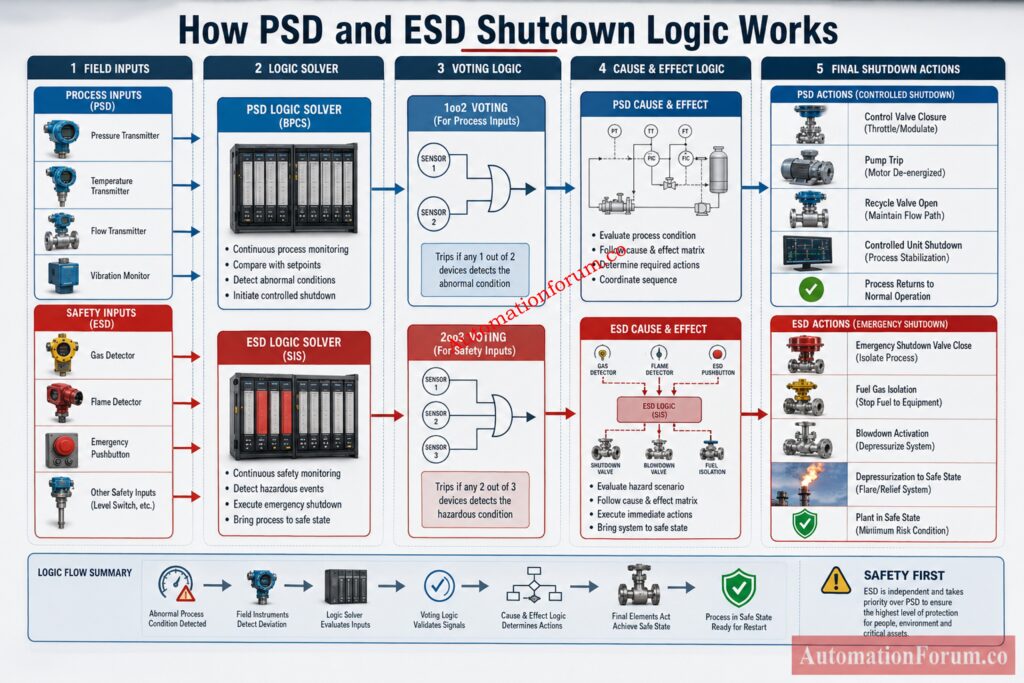
How Cause and Effect Logic Works in ESD and PSD Systems

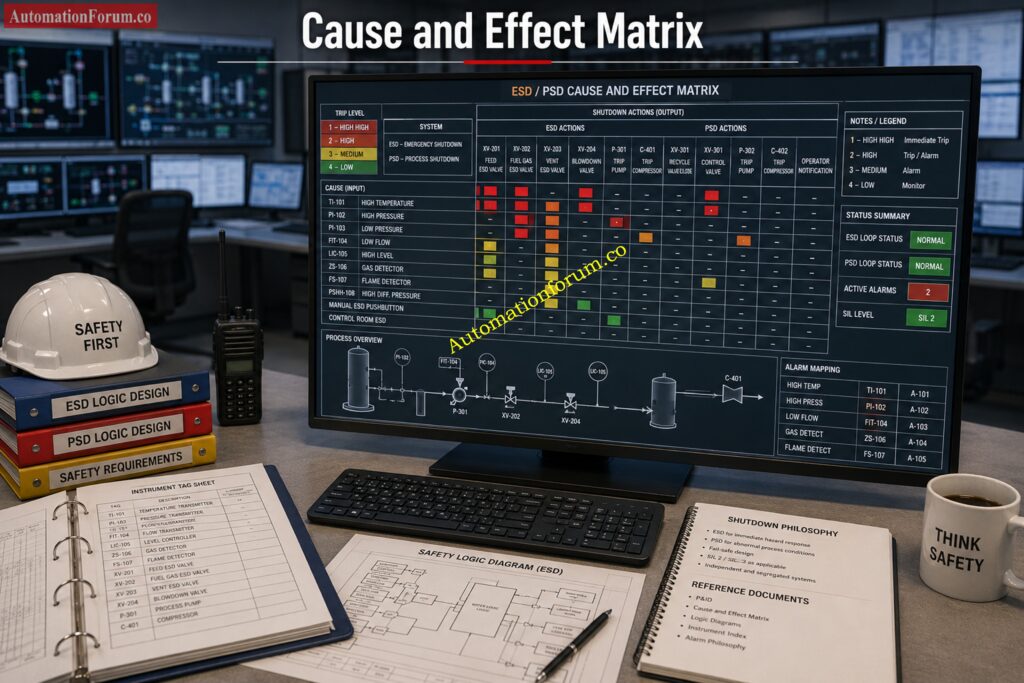
The cause and effect matrix is where shutdown philosophy becomes practical. It shows what input causes what action. This is the document that tells the team whether an event belongs to PSD, ESD, alarm only, or operator action.

Cause: High pressure in separator

Effect: Close inlet valve, stop feed pump, open recycle path, raise alarm, initiate unit shutdown if pressure continues to rise

Cause: Fire detector in compressor shelter

Effect: Trip fuel gas, stop compressor, close shutdown valves, activate blowdown, send emergency alarm

A strong cause and effect philosophy usually defines:

  • Trip levels
  • Time delays
  • Voting logic such as one out of two or two out of three
  • Reset requirements
  • Bypass and override permissions
  • Manual reset after trip
  • Alarm versus trip separation
  • First out indication
  • Fail safe action of final elements

PSD logic often allows a more controlled sequence. It may use time delay, confirmation, or staged actions.

ESD logic usually has faster direct action and less tolerance for delay, because the objective is to reduce the hazard immediately.

Prevent Costly Compliance Issues During Maintenance Deferrals: Testing and Repair Deferral – IEC Guidelines, Procedure, and Best Practices

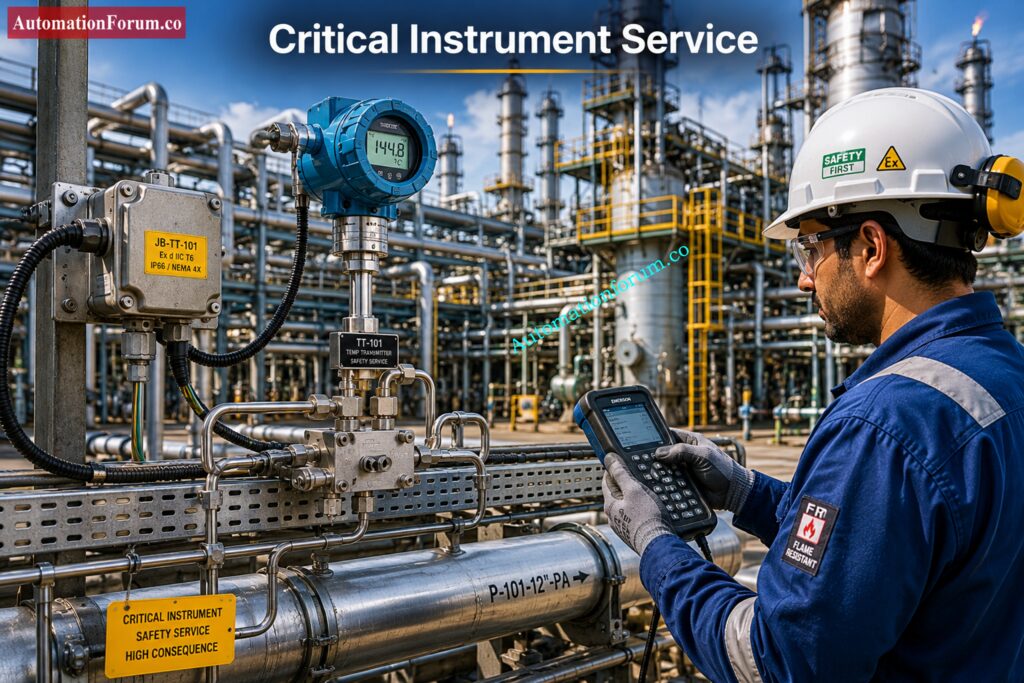
Field Instruments Used in PSD and ESD Shutdown Systems

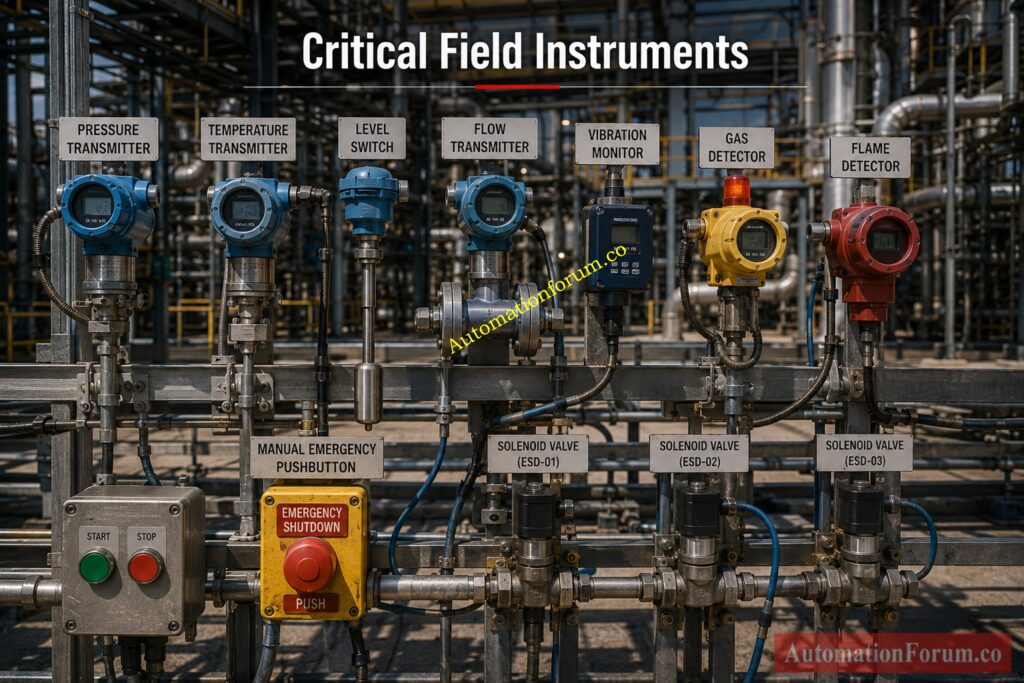
Both PSD and ESD use field instruments, but the severity of action is different. PSD normally protects the process, while ESD protects people, equipment, and the plant.

Shutdown SystemTypical Field Instruments / InputsPurpose
PSDPressure transmittersDetect abnormal pressure conditions
Level transmittersMonitor high or low level process conditions
Temperature transmittersDetect process overheating or cooling issues
Flow transmittersIdentify low flow, no flow, or high flow conditions
Vibration monitorsProtect rotating equipment from mechanical damage
Pump running feedbackConfirm pump status and operating condition
Package permissive contactsCheck equipment readiness before operation
Analyzer limit contactsDetect unsafe process composition or quality limits
ESDFire detectorsDetect fire and trigger emergency shutdown
Gas detectorsDetect hazardous gas release
Manual emergency pushbuttonsAllow operator initiated emergency trip
Flame detectorsDetect flame in hazardous areas
Critical pressure switchesTrip on dangerous pressure conditions
Toxic gas detectorsDetect harmful or poisonous gas release
Critical equipment trip contactsConfirm severe equipment fault or emergency trip condition
Typical Final Elements
Shutdown SystemTypical Final ElementsPurpose
PSDControl valvesReduce or control process upsets
Shutdown valvesIsolate part of the process when required
Motor startersStop motors connected to process equipment
Variable speed drivesReduce equipment speed during abnormal conditions
Recycle valvesProtect compressors or pumps from unstable operation
Vent or drain valvesRelease pressure or liquid safely
ESDEmergency shutdown valvesQuickly isolate hazardous process sections
Blowdown valvesDepressurize equipment or piping safely
Depressurization valvesLower system pressure during emergency
Fuel isolation valvesStop fuel supply to fired equipment
Master trip relaysInitiate shutdown of multiple equipment items
Solenoid operated valvesDrive fail-safe shutdown action
Critical contactors or breakersRemove power from essential equipment

Meet Functional Safety Obligations Before Compliance Audits Begin:  SIS functional safety requirements
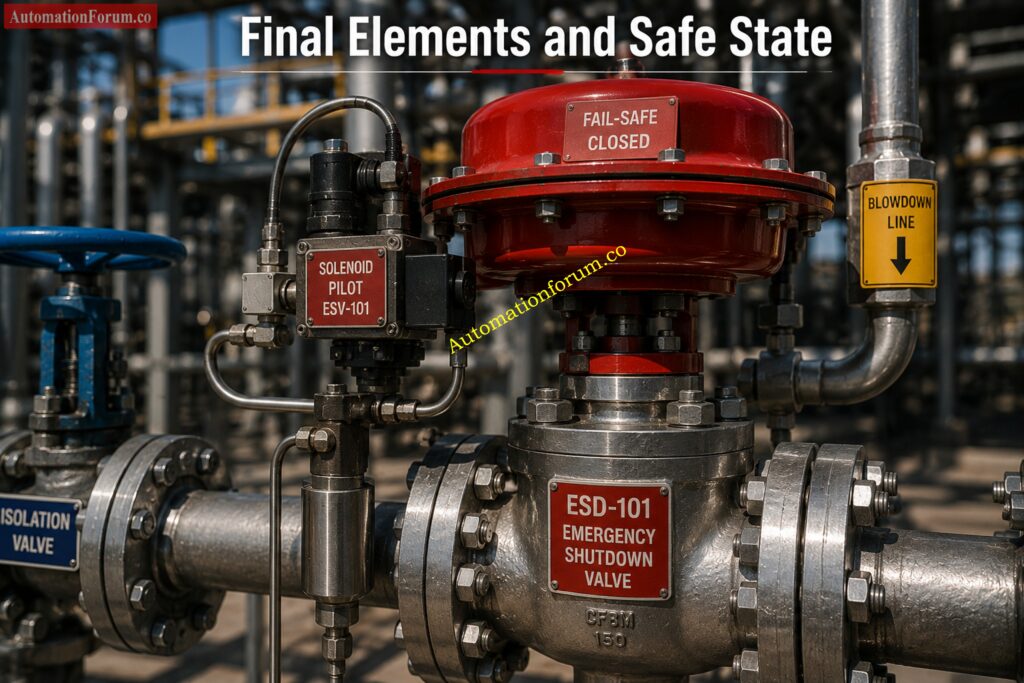
PointExplanation
Final element conditionA shutdown function is only as reliable as the final device that performs the action.
Common failure risksValve sticking, solenoid failure, loss of air supply, or wrong fail-safe position can prevent shutdown.
Engineering importanceProof testing and valve testing are essential in shutdown system design and maintenance.

Explore The Final Safety Barrier Protecting Critical Assets: What is ESDV (Emergency shutdown Valve)? How ESD valve works?

AspectPSDESD
Main roleProtect the processProtect people, plant, and equipment
Input severityProcess abnormal conditionsEmergency and hazardous conditions
Final actionProcess shutdown or control responseImmediate isolation and safe shutdown
Reliability demandHighVery high

Download Essential Safety Vocabulary Used Across Major Industries: Functional Safety Terminology – Excel Download for Industrial Automation

Relationship Between ESD, PSD, SIS, DCS, ICSS, BPCS, and FGS

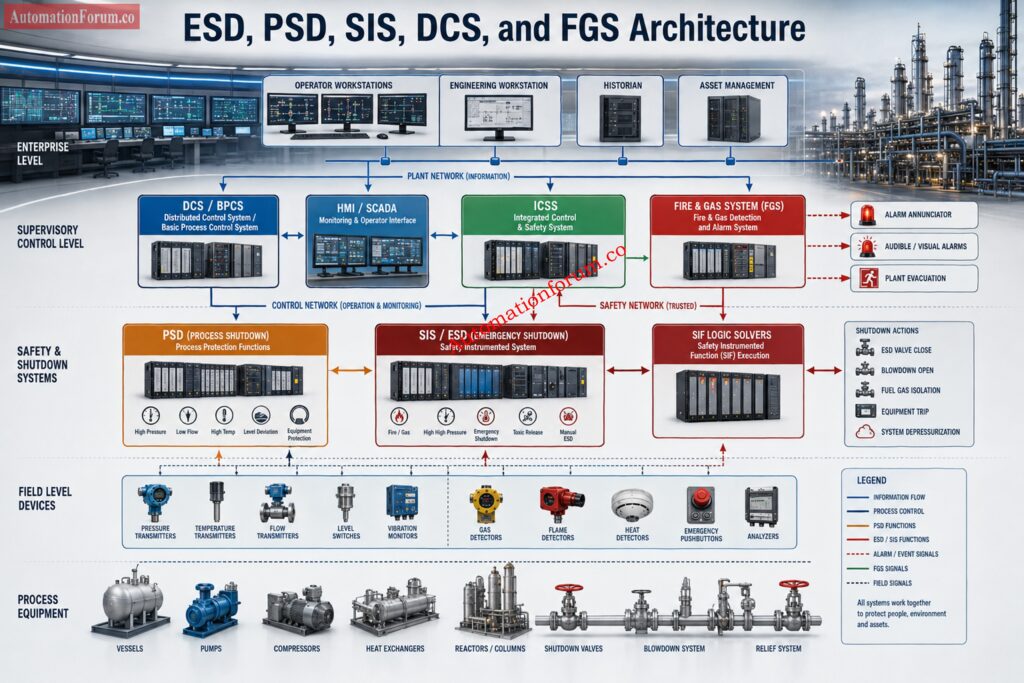
This is one of the most important practical topics in ESD vs PSD discussions.

The Safety Instrumented System is the broader safety architecture. PSD and ESD functions may both sit inside the SIS depending on the project philosophy, risk assessment, and company standards. Some sites place PSD in the SIS. Others place certain PSD functions in a dedicated shutdown system while ESD remains in the SIS.

High Integrity Protection Explained For Modern Industrial Applications: What is HIPPS?

The Integrated Control and Safety System is often the platform that houses control and safety functions together, but with proper separation in hardware, software, or network architecture. In an ICSS based plant, both PSD and ESD logic may be implemented on the same vendor platform with strict segregation.

The DCS and Basic Process Control System manage normal operation. They are not the same as shutdown logic. A DCS can alarm, control, and sequence normal process actions, but it should not be treated as the final protection layer for hazardous shutdown functions unless the project philosophy explicitly defines a qualified protective architecture.

The Fire and Gas System often triggers ESD actions. This is where FGS and ESD become tightly linked. FGS detects the hazard. ESD executes the emergency response. In many plants, the relationship between FGS and ESD is essential for safe hydrocarbon processing.

Why this separation matters

The control system may try to keep the process running. The shutdown system may need to stop it. That is not a conflict. That is layered protection working as intended.

Discover Critical Shutdown Inputs Protecting High Risk Facilities: Signals for Emergency Valve Shutdown in Critical Processes

A gas compressor train often uses PSD for abnormal process conditions such as low suction pressure, high discharge pressure, high vibration, or seal gas failure. If the condition worsens or a fire and gas event occurs in the compressor area, ESD isolates fuel, trips the machine, and may activate blowdown.

Here, PSD protects the train from process damage. ESD protects the area from a major hazard.

Understand Why Every High Risk Facility Depends On It: What is an Emergency shutdown system and what is its importance?

A fired heater may use PSD to respond to process upset conditions such as low fuel pressure, low feed flow, or abnormal outlet temperature. If flame failure is detected or a gas release occurs, ESD shuts fuel quickly and initiates the safe shutdown sequence.

Here, the difference is clear. PSD is linked to process integrity. ESD is linked to combustion and personnel safety.

In LNG and gas facilities, PSD may protect process equipment from overpressure, low flow, or train upset. ESD may isolate inlet, stop compressors, activate blowdown, and depressurize a section when fire or gas detection confirms a dangerous event.

In a power plant, PSD might stop a feed pump or protect a boiler feedwater circuit when flow or level becomes unsafe. ESD may trip fuel systems or isolate a critical hazardous area when a severe safety event is confirmed.

Challenge Your Functional Safety Knowledge Before Site Audits: Test Your Expertise in Safety Instrumented Systems (SIS): Knowledge Quiz

This is one of the most valuable practical distinctions.

The process is abnormal, but the situation can still be managed by controlled shutdown or protective intervention.

Examples:

  • Rising separator pressure that can be controlled by reducing feed
  • Low pump suction pressure that requires pump trip
  • High temperature in a process loop that needs a controlled stop
  • Loss of cooling that requires process shutdown before damage

The situation poses a direct hazard to personnel, the facility, or containment integrity.

Examples:

  • Confirmed fire
  • Confirmed gas release
  • Toxic gas exposure
  • Manual emergency stop
  • Critical leakage or rupture
  • Hazardous overpressure that requires immediate isolation and depressurization

The rule is simple. If the event is about protecting the process, PSD may be enough. If the event is about preventing or responding to a hazardous emergency, ESD is required.

Learn This Crucial Voting Configuration Before System Commissioning: Understanding 2 out of 2 SOV: Working & Configuration

A common engineering mistake is treating DCS logic as if it were shutdown logic. That is risky.

DCS logic handles normal control, operator interface, sequencing, and routine alarms. It is excellent for process regulation.

PSD and ESD logic are designed for protective action. They are not trying to optimize production. They are trying to preserve safe operation or force a safe state.

A DCS can say, “Something is wrong.”

A PSD can say, “Stop this unit in a controlled manner.”

An ESD can say, “Shut down now and isolate the hazard.”

That difference matters in design reviews, hazard studies, and maintenance planning.

Prepare For Technical Interviews With Expert Level Questions: Safety Instrumented System(SIS) Interview Questions and Answers

Engineers should define the shutdown philosophy before drawing logic diagrams. The cause and effect matrix, shutdown hierarchy, bypass rules, reset sequence, and trip priorities should all be clear. Do not build the logic first and the philosophy later.

High level SIL and redundancy considerations matter here. Not every shutdown function needs the same integrity level. The risk of the scenario drives the design. Some functions may need redundant transmitters, voting logic, or redundant solvers. Others may not.

Commissioning teams should verify:

  • Correct input wiring
  • Correct trip setpoints
  • Correct final element action
  • First out indication
  • Alarm and trip sequence
  • Reset behavior
  • Bypass and override control
  • Cause and effect alignment with field reality

Maintenance teams should focus on:

  • Proof testing
  • Valve stroking and fail action checks
  • Detector calibration
  • Trip setpoint verification
  • Bypass discipline
  • Work permit coordination
  • Documentation updates after changes

A shutdown system that is never tested becomes a paperwork asset, not a real safety barrier. Proof testing is how engineers confirm that the logic, sensor, solver, and final element still perform the intended action.

Critical Isolation Technology Every Process Engineer Should Understand: What is an Emergency Block valve and How does it work

Not every shutdown is emergency shutdown. A process protection trip is often a PSD function, not an ESD function.

When control and protection boundaries are vague, operators lose trust and maintenance teams lose clarity.

A shutdown signal without reliable valve response is not a real shutdown function.

Bypasses are sometimes necessary during maintenance, but uncontrolled bypass culture destroys safety integrity.

One project may define PSD as pretrip protection. Another may define it as a unit shutdown layer. Do not assume. Read the project documents.

If a trip can be reset too easily, operators may restart into an unsafe condition. If it is too difficult, operations may be forced into unsafe workarounds. The reset philosophy should be deliberate.

See How Automated Isolation Protects Modern Process Plants: What is an Automated Block Valve and how does it work

When reviewing a cause and effect matrix, look for these clues.

  • Controlled shutdown sequence
  • Equipment protection motive
  • Localized or unit based action
  • May allow operator intervention before full shutdown
  • May include staged trip and alarm
  • Fire and gas trigger
  • Emergency pushbutton trigger
  • Hazard containment or isolation motive
  • Rapid plant safe state action
  • Fuel isolation or blowdown
  • Strong fail safe expectation
How Engineers Review Shutdown Logic

Ask three questions:

  1. What is the initiating cause?
  2. What hazard is being prevented?
  3. What is the required safe state?

If the answer is process protection, you are likely looking at PSD. If the answer is emergency hazard control, you are likely looking at ESD.

Reduce Overpressure Risks Using This Advanced Protection Method: How does the HIPPS system work in the Oil and gas Industry?

PSD example

Cause: High discharge pressure on compressor

Effect: Alarm, reduce load, open recycle, trip compressor if pressure remains high

ESD example

Cause: Gas detector high high in compressor building

Effect: Trip compressor, isolate fuel, activate blowdown, send emergency alarm, lock out restart until reset

This simple comparison shows the logic difference very clearly.

Avoid Shutdown Failures Through Proper Valve Implementation Techniques: Implementing a Solenoid Operated Valve for Emergency Shutdown

PSD protects the process and equipment from abnormal operating conditions through controlled shutdown actions. In dangerous conditions ESD triggers emergency shutdown actions to protect personnel, the environment and the facility.

A DCS is typically utilized for normal process monitoring and control while an ESD system is meant to perform safety essential shutdown operations in crises. ESD is autonomous to provide protection when process control alone is not sufficient.

PSD is Process Shutdown System . It is used to safely shut down process equipment or unit in the case of abnormal operating conditions. The goal is to prevent damage to equipment and to prevent escalation to more serious incidents.

The Decision Making Logic Behind Every Reliable Shutdown: Voting Logic in Safety Instrumented System

ESD stands for Emergency Shutdown System. It is a dedicated safety system designed to place a plant, process unit, or facility into a safe state during emergency conditions.

An ESD is used to safeguard people, equipment and environment in emergency scenarios like fire, gas leak, overpressure or catastrophic process failures. It does this by automatically separating dangers and shutting down the systems involved.

There are two common ESD kinds, Unit ESD and Plant ESD. Unit ESD is intended to trip a particular portion of the process . Plant ESD is intended to activate trip functions across a much wider area or the entire plant .

The main purpose of an ESD is to reduce the consequences of hazardous events by bringing the plant to a predefined safe condition. It serves as a critical layer of protection in process safety systems.

ESD material is material designed to safely disperse static electricity and prevent electrostatic discharge. These materials are frequently utilized in the protection of sensitive electronic equipment and parts

PSD means Process Shutdown System. It is designed to protect process equipment and to ensure safe operation by automatic shutdown of impacted areas of the process in case of abnormal conditions.

An ESD system in oil and gas plants isolates hydrocarbon sources, shuts down essential equipment and performs protective procedures during emergencies. It is an important part of the entire process safety plan.

A PSD is a shutdown function that is designed to protect equipment and processes from harmful operating circumstances. This helps avoid process upset conditions from becoming serious safety catastrophes.

No. PSD is intended for process protection and controlled shutdown of equipment or units. ESD is intended for emergency situations where safety risks require immediate protective action.

Yes. If a process upset continues to worsen or creates a hazardous condition, the shutdown sequence may escalate from PSD actions to an ESD response.

In many facilities, ESD functions are implemented within the Safety Instrumented System architecture. However, the exact arrangement depends on the project’s safety philosophy and system design.

Yes. Fire and Gas Systems commonly provide inputs that trigger ESD actions when fire, combustible gas, or toxic gas hazards are detected.

The distinction is mostly in the purpose. PSD protects the process and equipment from abnormal conditions while ESD safeguards the people, assets and environment during emergency scenarios.

Transform Alarm Performance And Reduce Operator Response Delays: Guide to Industrial Process Alarms in Control Systems: Types,  Classifications, and Management Methods

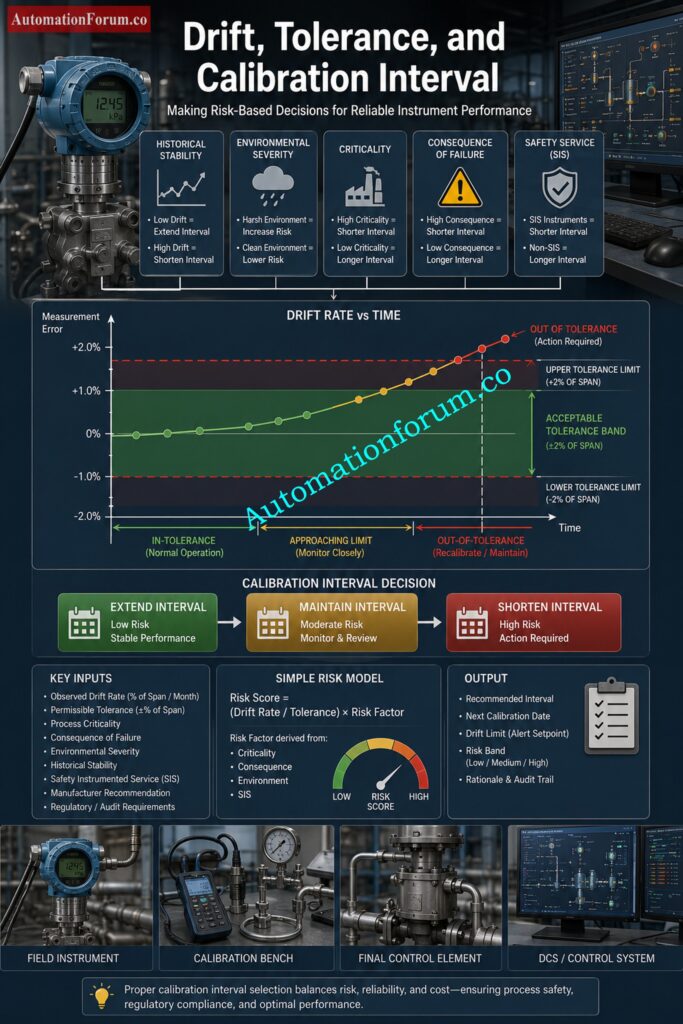
The difference between ESD vs PSD is simple in principle and critical in practice. PSD is the process protection layer that reacts to abnormal operating conditions before the situation becomes severe. ESD is the emergency shutdown layer that responds to hazardous events where people, assets, and containment are at risk. In real plants, both systems must be designed through a clear cause and effect philosophy, aligned with the SIS, ICSS, DCS, BPCS, and FGS architecture, and verified through commissioning and proof testing. When engineers keep that boundary clear, the shutdown system in instrumentation becomes more reliable, more maintainable, and far safer.

FRL Unit Selection Procedure for On Off Instrumentation Control Valves

0
FRL Unit Selection Procedure for On Off Instrumentation Control Valves
Table of Contents
What Is an FRL Unit in Pneumatic On Off Control Valve Service?

An FRL unit is an air preparation assembly made up of a filter, regulator, and lubricator. In pneumatic on off control valve service, it conditions compressed air before the air reaches the solenoid valve and actuator. In simple terms, the FRL unit helps deliver the right air quality and the right pressure so the valve can open and close reliably.

Why FRL Selection Matters for On Off Control Valve Applications

For EPC engineers, commissioning engineers, and maintenance engineers, the FRL unit selection procedure for on off control valve applications is not a small detail. It directly affects valve response time, actuator life, solenoid valve reliability, startup performance, and long term maintenance effort. A poor FRL selection can create slow stroking, pressure drop, water carryover, sticking solenoids, and repeated troubleshooting calls. A correct selection gives stable operation, better fail action performance, and fewer surprises during commissioning and plant operation.

A typical pneumatic on off valve package includes the instrument air supply, a local isolation valve, the FRL unit, a solenoid valve, the pneumatic actuator, and position feedback devices such as limit switches or proximity switches. In some packages, a filter regulator unit is used without a lubricator. In other packages, a complete filter regulator lubricator assembly is installed, but only when lubrication is actually needed.

The instrument air enters the FRL unit first. The filter removes dust, rust, scale, and moisture. The regulator reduces and stabilizes pressure to the required level. If required by the equipment design, the lubricator adds controlled oil mist to the air stream. The conditioned air then reaches the solenoid valve and actuator.

From an FRL selection point of view, on off valve service is different from modulating control valve service. A modulating valve needs continuous and highly stable positioning air. An on off valve normally remains fully open or fully closed and only moves during a command. Even so, it still needs fast and dependable air delivery. The FRL must therefore support both clean air quality and the required flow capacity. In field service, many problems that look like actuator faults are actually air preparation problems.

Stop Guessing Delay Logic: PLC Timer Basics Explained: Understanding ON Delay and OFF Delay Timers in PLC Programming

Step by Step FRL Selection Procedure

Start with the valve data sheet and actuator data sheet. Confirm whether the actuator is spring return or double acting. Confirm the fail action, whether it is fail close, fail open, or fail in place. Also confirm the required operating pressure and stroke time.

This step matters because the actuator drives the entire air demand. A spring return actuator needs enough pressure to compress the spring and complete the stroke. A double acting actuator needs air for both directions and usually consumes more air. For emergency shutdown or critical isolation valves, the FRL must support the required stroke time even under the least favorable operating conditions.

Check the plant instrument air header pressure, dew point, moisture level, oil carryover, and contamination condition. The best FRL cannot compensate for a badly maintained air network. Clean dry instrument air is the ideal supply for pneumatic valve service.

This step matters because dirty air is one of the most common reasons for pneumatic failures. Water can corrode internals and freeze in cold areas. Dirt can block solenoid passages. Oil carryover can damage seals and collect inside components. If the plant air system is old, wet, or contaminated, the FRL selection must be more conservative.

Check Actuator Size and Air Consumption - FRL Unit Selection Procedure for On Off Instrumentation Control Valves

The air demand is a function of the actuator volume and stroke frequency. Check the size of the cylinder or diaphragm, the travel of the actuator, the number of cycles predicted and the response time necessary. Larger actuators and quick stroking valves are demanding more air, in less time.

This phase is important because the FRL must pass enough air without being a pressure bottleneck. Even if the supply gauge reads the correct pressure, a valve may still not react properly. The problem may be insufficient flow under dynamic conditions. For this reason, flow capacity is just as important as pressure rating.

Win Safer Level Transmitter Selection with This Checklist: Level Transmitter Selection Checklist for EPC Engineers – Step-by-Step Guide

Confirm the minimum pressure required at the actuator, the usual working pressure, and the maximum permitted pressure. Then select a regulator range that will position the required set point at the center of the adjustment band.

This is important because a regulator that is operating near the edge of its range is harder to modify and less stable with changes in demand. Pressure stability is useful for complete stroke movement and consistent response time in on-off valve function. When the valve is actuating, pressure droop can cause it to move slowly or not achieve full travel.

Do not assume that every pneumatic valve package needs a lubricator. Many modern solenoid valves, actuators, and accessories are designed for clean dry air and should not receive oil mist unless the manufacturer specifically approves it.

This step matters because unnecessary lubrication can create more problems than it solves. Over lubrication can contaminate solenoid valves, attract dust, foul seals, and complicate maintenance. In many modern plants, the better choice is a filter regulator arrangement without a lubricator. The final decision should always follow the actuator and valve manufacturer recommendation.

The filter should be selected based on the contamination risk and the sensitivity of the downstream equipment. A standard particulate filter may be enough where the instrument air system is already clean and dry. A coalescing filter may be better where fine oil aerosols, moisture droplets, or very small particles are present.

This step matters because the filter protects the solenoid valve, regulator, and actuator from wear and blockage. If the air is dirty, a finer filter is justified even if it creates slightly more pressure drop. The real objective is reliable operation, not minimum initial cost.

The drain type should match the condensate risk and the maintenance access. Manual drains work when the unit is easy to reach and the plant has regular inspection discipline. Semi automatic or automatic drains are better where access is poor or moisture generation is frequent.

This step matters because poor drainage leads to water accumulation in the bowl, then water carryover downstream. In humid or outdoor service, this can quickly affect solenoid valves, pressure stability, and actuator performance. Drain selection should be treated as a reliability decision, not a minor accessory choice.

Do not select the FRL only by looking at port size. Two units with the same connection size can have very different flow performance. Check the rated flow, pressure drop characteristics, and internal restriction.

This step matters because the valve must move quickly and fully. A high demand actuator or a valve with a short stroke time needs a unit with enough flow margin. Long tubing runs, multiple valve stations, and simultaneous valve operation increase the air demand further. If the FRL is small, the system may experience sluggish reaction, low actuator force or incomplete stroke.

Make Pressure Transmitter Manifold Selection Easy and Accurate: Key Considerations for Pressure Transmitter Manifold Selection

Identify the location of the unit: inside, outside, coastal area, dusty cement plant, humid tropical environment, or corrosive process area. Environment determines bowl material, body finish, seal longevity and maintenance frequency.

This step is important because the same FRL can work well in one domain and fail early in another. Outdoor and corrosive environments often require better material selection and stronger protection. Maintenance life is part of selection, not something to think about after failure.

Understand Turndown Ratios Before Pressure Errors Hit: Rangeability vs. Turndown Ratio and their Implications for Pressure Transmitter Selection

The FRL should be installed where the gauge can be seen, the drain can be reached, and the filter element can be replaced safely. If the unit is difficult to access, it will not be maintained properly.

This step matters because inaccessible equipment tends to be ignored until it fails. Good access improves inspection, drainage, troubleshooting, and preventive maintenance. In plant work, accessibility is a reliability feature.

Know the Essential Control Valve Standards That Matter: Codes and Standards for Control Valve Selection in Industrial Applications

Before finalizing the selection, define the spare parts plan. Check the availability of filter elements, drain kits, bowl seals, pressure gauges, and replacement units.

This step matters because critical valve service cannot wait for long lead times. A standardized FRL arrangement also simplifies stock keeping and maintenance training.

Fix Shutdown Valve Failures Before They Spread Fast: How to Troubleshoot On-Off / Shutdown Valve

Filter Selection Details for Instrument Air FRL Selection

The filter is the first barrier between the plant air supply and the valve package. It must remove contaminants before they can enter the regulator or solenoid valve. For clean instrument air service, a standard filter can be sufficient. For poorer air quality, a coalescing filter may be a better choice because it captures finer contamination and moisture aerosols more effectively.

Dirty air can create several field issues. A solenoid valve may stick or fail to shift. The regulator may clog or drift. The actuator may move slowly or inconsistently. The filter is therefore a core part of instrument air FRL selection, not just a protective accessory.

Drain performance is just as important as filtration performance. If the bowl fills with water, the filter cannot protect the downstream equipment. For this reason, the drain type should reflect the expected condensate load, the operating environment, and the maintenance routine.

Unlock Better Flow Meter Choices for Process Plants: Flow Measurement Selection in Application Scenarios for Process Industries EPC Design Engineering

The regulator should deliver stable downstream pressure during both idle and active valve operation. For on off control valve service, the main concern is not fine control accuracy, but pressure stability under sudden air demand.

A good regulator should have:

  • Stable set point adjustment
  • Acceptable droop under demand
  • Adequate flow capacity
  • Good repeatability after reset

The set pressure should not be selected too close to the low or high end of the regulator range. A mid range operating point generally gives better stability and easier commissioning. In applications with fail close or fail open action, stable regulator performance is essential because the actuator must reach the safe position quickly and fully.

Pressure drop in the air circuit should also be considered. Long piping, small tubing, dirty filters, and undersized regulators all reduce the air available at the actuator. The practical result is slower response, weaker stroking, and lower reliability.

Pick the Right Anti-Surge Valve Without Regret: Anti-Surge Control Valve Selection and Sizing – Complete Engineering Guide

A lubricator should only be used when the equipment clearly needs it. Some older pneumatic devices may benefit from lubrication, but many modern actuators and solenoid valves are designed for clean dry air and should not be oiled.

Over lubrication is a real field problem. It can contaminate solenoid valves, create sticky deposits, collect dust, and interfere with downstream components. If the lubricator is not required, it should be omitted from the design. If lubrication is required, the compatibility of every downstream item must be confirmed first.

For most modern on off valve packages, the safer and more common arrangement is a filter regulator unit without lubricator. This is especially true when the plant instrument air is already dry and well maintained.

Compare Control Valves Faster: Find the Best Fit: Globe vs Ball vs Butterfly Control Valves Complete Comparison Guide for Flow Control Selection

FRL sizing should be based on actuator air volume, cycle frequency, supply pressure, and required stroking speed. The air demand of the actuator should be compared with the flow performance of the FRL, not just the connection size.

A practical selection margin should always be included. This margin helps compensate for filter loading, line losses, minor system deterioration, and future operating changes. Long air lines increase resistance and delay the response. Multiple valve stations on the same branch line can also create temporary demand peaks. In those situations, a higher flow FRL is often the better engineering choice.

The key point is simple. A pneumatic valve package should not be designed to work at the limit of the FRL capacity. It should operate comfortably within the available flow range.

Avoid Costly Mistakes in Control Valve Materials: Control Valve Body Material Selection Guide for EPC Design Instrumentation Engineers

A spring return on off valve in a water treatment plant is used for isolation duty. The actuator requires 5.5 bar operating pressure, the plant instrument air header is at 7 bar, the valve is installed outdoors, and the actuator manufacturer says lubrication is not required.

A practical choice would be a filter regulator unit without lubricator, with good moisture removal capability, an automatic drain, and corrosion resistant construction suitable for outdoor use. The regulator should be set near the required working pressure, and the unit should have enough flow margin to allow quick stroke movement. This choice protects the solenoid valve, supports the actuator reaction time and decreases the effort of maintenance.

Test Your Instrumentation Skills with Tough Flow MCQs: Advanced Flow Measurement Selection MCQs for EPC Instrumentation Design Engineers

Installation and Commissioning Requirements for FRL Units
  • Install the FRL in the proper flow direction and in the orientation indicated by the manufacturer. 
  • Keep the gauge in sight and the drain open. 
  • Provide an isolation valve upstream so the unit can be maintained safely.
  • Before startup, clean the air line thoroughly. Remove rust, dust, dampness and welding slag. 
  • Pressure test and leak check entire air circuit after installation. 
  • During commissioning check regulator set pressure, actuator response time and correct fail position of valve.
  • Do not limit the commissioning check to electrical signal confirmation. Valve has to be stroked fully and physically seen. 
  • Record the final pressure setting, filter type, drain type and any special notes in the commissioning records. This helps in planning for future troubleshooting and maintenance.

Calculate Actuator Sizing Like a Pro Engineer: Valve Actuator Sizing Calculator – Complete Engineering Guide

Maintenance and Troubleshooting Relevance of FRL Selection
  • Slow reaction, pressure reduction or weak actuator movement are often symptoms of a blocked filter. 
  • Faulty regulator may cause pressure drift, instability, or failure to maintain the set point. 
  • A poor drain arrangement often causes water accumulation, rust contamination, and poor air quality downstream.
  • Typical symptoms of bad FRL selection include valve chatter, slow opening, slow closing, failure to open, failure to close, and solenoid valve malfunction. 
  • If the valve package is difficult to maintain or difficult to inspect, the risk of future failure becomes much higher.
  • A practical preventive maintenance routine should include filter element inspection, bowl drainage, regulator gauge verification, leak checking, and replacement of worn seals or drains. Good pneumatic valve maintenance starts with good air preparation.

Select Hybrid Level Sensors with Total Confidence: Hybrid Level Measurement Selection Procedure for EPC Instrumentation Engineers

  • For EPC projects, standardize the FRL selection philosophy across similar valve packages. 
  • This improves consistency and reduces spare parts variation. Keep the FRL close enough to the actuator to minimize pressure loss, but never at the cost of poor access.
  • Use clean dry instrument air wherever possible. Avoid selecting a lubricator unless there is a clear technical need. 
  • Verify flow capacity instead of relying only on port size. 
  • Check environmental conditions carefully. Make sure the final arrangement is serviceable after installation.
  • The best practice is to treat FRL selection as part of overall control valve commissioning and reliability planning, not as a minor piping accessory.

Choose the Perfect Thermowell Before Problems Start: Thermowell Selection Procedure – Complete Guide for EPC design Engineers

Advanced Engineering Workbook: FRL Unit Selection & Commissioning Checklist

This single-sheet workbook is built for engineering review, selection, commissioning, and maintenance tracking of FRL units in pneumatic on/off control valve service. It includes a structured checklist, status tracking, risk review, and a clean professional layout suitable for EPC and plant use.

Challenge Yourself with Hard Flowmeter Selection Questions: Advanced Flowmeter Selection Quiz for EPC Engineers in Process Industries

The FRL unit selection procedure for on off control valve service is a practical engineering exercise that affects the performance of the entire pneumatic valve package. The correct selection depends on actuator type, air quality, operating pressure, lubrication need, drain arrangement, flow capacity, environmental conditions, and maintenance access.

When the FRL unit is selected properly, the valve responds faster, the solenoid valve stays protected, the actuator performs more reliably, and maintenance becomes easier. For long term operation, the final choice should always follow actuator and valve manufacturer recommendations, project standards, and actual site conditions.

Streamline Flowmeter Picking with Smarter Engineering Tactics: Streamlining Your Flowmeter Selection Process: Tips and Insights

FRL units are air preparation devices consisting of a filter, regulator, and lubricator.
They prepare compressed air before it goes to pneumatic equipments .

FRL = Filter Regulator Lubricator.

An FRL device eliminates impurities, controls pressure and supplies lubricant as needed.

It is useful for ensuring proper operation of pneumatic valves and actuators .

Choose FRL based on actuator needs, air quality, operating pressure and flow demand.

Consider also environmental conditions and maintenance requirements.

Use the Right Cable Gland in Hazard Zones: Cable Gland Selection for Hazardous Area Installations – Complete 2025 Guide

Select a FRL that suits the actuator air consumption and the quality of the plant instrument air.

Always adhere to valve manufacturer guidelines and project standards.

An FRL unit is a compressed air cooling unit used in pneumatic systems .

It conditions air before it enters control devices and actuators.

FRL unit is the last stage of air preparation before the pneumatic equipment.

It provides clean, regulated and application appropriate pressurized air.

It also provides clean and stable air to the actuator and solenoid valve.

This increases the reliability, response time and service life of the valve.

The actuator operating pressure and air consumption are usually the primary considerations.
Air quality and required flow capacity are also critical selection factors.

Adequate flow capacity allows the actuator to stroke at the required speed.
An undersized FRL can cause slow operation and pressure loss.

A coalescing filter should be used when fine oil mist or moisture aerosols are present.
It provides higher air quality than a standard particulate filter.

The drain is intended to drain collected water and impurities from the filter bowl.

Proper drainage prevents moisture reaching the pneumatic equipment downstream.

Yes, dirty air and pressure changes can damage the solenoid valve internals.

The biggest improvement for solenoid dependability is proper FRL selection.

Check actuator type, operating pressure, flow requirement, air quality, environment.

Advanced HART Loop Calculator for Reliable 4 to 20 mA and HART Communication

0
Advanced HART Loop Calculator for Reliable 4 to 20 mA and HART Communication
Table of Contents
AutomationForum.co – Advanced HART Protocol Loop Calculator
AUTOMATIONFORUM.CO

Advanced HART Protocol Loop Calculator

Your Trusted Source for Automation Power Tools & Solutions
Recommended Load250–1100 Ω
Typical Supply24 VDC
Signal TypeFSK
ProtocolHART
Total Resistance
Voltage Drop
Voltage At Device
Voltage Margin
Drop %
Max Cable Length
Health Score
Comm Status

The HART Loop Calculator is a practical engineering tool for verifying whether a 4 to 20 mA loop has enough electrical headroom for both analog signal transmission and reliable digital HART communication. In real field applications, a loop may appear to work at the control system level, yet still fail during HART polling, device configuration, or commissioning because the available voltage at the transmitter is too low.

That is why this calculator matters. It helps instrumentation engineers, automation engineers, maintenance teams, commissioning engineers, EPC engineers, and students quickly evaluate the electrical health of a loop before problems appear in the field. By entering values such as supply voltage, loop current, cable length, cable resistance, receiver resistance, device minimum voltage, barrier voltage drop, and number of devices, the calculator estimates the full loop condition in a simple and engineering friendly way.

The result is more than a number. It gives a clear view of whether the loop has enough voltage for stable operation, acceptable resistance, and safe HART communication. That makes it useful during design, troubleshooting, loop check, and final commissioning.

Unlock Faster Device Configuration with Modern Tools: HART Transmitter Diagnostics: What Your Field Device is Telling You

Why HART Loop Calculation Is Important for Process Industries

In a standard 4 to 20 mA loop, the transmitter needs enough voltage to operate while the loop current passes through cable resistance, input resistance, barriers, and any other series loads. HART communication uses a small frequency shift keyed digital signal superimposed on the analog current loop. If the loop voltage becomes too low or the resistance becomes too high, the transmitter may still send 4 to 20 mA, but HART communication can become weak, intermittent, or completely unavailable.

This is why the HART protocol calculator is valuable during instrumentation design and commissioning. It helps answer a simple but critical question. Does the loop have enough voltage and margin for reliable communication?

In practice, poor loop planning can lead to problems such as failed configuration, unstable multidrop behavior, noisy polling, or repeated communication loss when the process current increases. The calculator helps detect those risks early.

Understanding Loop Resistance, Voltage Drop, and Device Minimum Voltage

Every current loop has resistance. Some of it comes from the cable. Some comes from the receiver or analog input. Some may come from safety barriers, intrinsic safety isolators, or communication interfaces. The total resistance in the loop determines how much voltage is lost before the transmitter receives what it needs.

The loop resistance calculator feature is significant as resistance has a direct effect on voltage drop. Higher resistance means more voltage drop for a given current. At 20 mA, even a small increase in resistance can reduce the available voltage at the field device.

The device minimum voltage is equally important. Every transmitter requires a minimum operating voltage to work correctly. If the voltage at the device drops below that threshold, the loop may fail to operate reliably. In many field instruments, the unit may still seem alive at low load conditions, but HART communication can become unstable when the loop is pushed closer to its minimum.

The calculator compares the voltage available at the device with the minimum voltage required. That difference is called the voltage margin.

In simple terms, voltage margin is the spare voltage left after all loop losses are accounted for. A healthy margin means the loop has extra room for normal variation, temperature changes, cable aging, barrier losses, and practical field conditions.

Avoid Costly Communication Mistakes Before Your Next Shutdown: Difference Between Fieldbus and HART Communication Protocols: Complete Comparison Guide for Process Automation Engineers

How Cable Length and Cable Type Affect HART Loop Performance

Cable length is one of the most common causes of voltage loss in field loops. Longer cable means more resistance, and more resistance means more voltage drop. That is why the cable voltage drop calculator feature is so useful.

Cable type matters too. Resistance value of cables is vary for different sizes. A heavier conductor like 16 AWG has less resistance than a lighter conductor like 18 AWG. The lower the resistance the less voltage you will lose across the same distance. This can make a major difference in long runs or loops with several devices and barriers.

For HART communication, cable quality also affects signal integrity. Excessive resistance, poor shielding, loose terminations, and noisy routing can make digital communication less reliable even when the analog current still looks normal. A loop may pass a basic current test and still fail during HART polling if the electrical headroom is too small.

That is why the calculator lets the user enter cable length and cable type or cable resistance. It supports better instrument loop design by showing how much the cable contributes to the total loop burden.

See What Your Smart Transmitter Is Really Reporting: Explained: The Four Main Process Variables (PV, SV, TV, QV) in HART Transmitters 

Why Receiver Resistance and Barrier Voltage Drop are Critical

Receiver resistance is often overlooked, but it is one of the most important values in a HART loop. In many installations, the receiver may be a PLC analog input, DCS input card, isolator, or HART modem. If the receiver resistance is too high, it consumes loop voltage and reduces the voltage available for the field device.

The same applies to barriers. A safety barrier or isolator can introduce a fixed voltage drop. In intrinsic safety applications, this drop is not optional. It must be included in the calculation from the beginning. If it is ignored, the design may look fine on paper but fail in the field.

That is why this calculator includes barrier voltage drop as a separate input. It helps the engineer verify the loop under actual installation conditions, not just ideal conditions.

This makes the tool especially useful for hazardous area projects, brownfield upgrades, and loops that must pass through marshalling cabinets, intrinsic safety barriers, and long instrument cable runs.

Master Critical HART Settings That Improve Reliability: Best Practices for Configuring HART Parameters in DCS Software

The Total Resistance is the sum of the resistance of the loop . This includes cable resistance , receiver resistance , and any other series loads . It is the total electrical load the transmitter must endure to operate properly and communicate using HART.

Voltage Drop is the amount of voltage lost across the loop due to current passing through the overall resistance of the loop. Higher loop current and higher resistance give a higher voltage drop. This is a key parameter for loop design.

Voltage at Device is the actual voltage available at the field transmitter, considering cable losses, resistance of receiver and voltage dips across barriers. In order to enable reliable operation, this value must be kept above the minimum working voltage of the transmitter.

The voltage margin is the difference between the voltage available for the device and the minimum voltage required by the transmitter. A big voltage margin offers more reliability and helps to accommodate future changes, temperature effects and component aging.

Drop Percentage is a measure of the amount of available supply voltage that is lost due to loop resistance and other losses. A high percentage may signify poor voltage headroom and greater risk of communication or operational problems.

Eliminate Common DP Level Measurement Troubleshooting Errors: Step-by-Step Troubleshooting Checklist for Closed Tank DP Type Level Transmitter

Maximum Cable Length determines the maximum cable run supported while still providing enough voltage at the device. This allows engineers to validate loop feasibility in design, expansion and commissioning activities.

Health Score A fast overview of loop state based on voltage margin, loop resistance and communication needs. A higher score means that the loop is well designed with sufficient working headroom.

Communication Status shows the intended HART communication status as PASS, MARGINAL or FAIL. This result allows engineers to quickly verify whether the loop is capable of supporting steady and reliable HART communication.

Prevent Startup Delays with Proven Commissioning Methods: Step-by-Step Guide for Installing and Commissioning HART and WirelessHART Devices for Engineers and Technicians

Supply Voltage is the DC power source available to the instrument loop. It provides the energy required for the transmitter, loop devices, and HART communication while overcoming all loop losses.

Loop Current represents the operating current flowing through the 4 to 20 mA circuit. The calculator commonly evaluates worst case conditions at 20 mA because voltage drop is highest at maximum current.

Sharpen Your Level Measurement Commissioning Expertise: Advanced Guided Wave Radar Level Transmitter Commissioning Quiz for Process Industries

Cable Length is the total distance between the field device and the control system. Longer cable runs mean more resistance and voltage loss which has a direct impact on loop performance.

Cable Type or Cable Resistance specifies the conductor properties utilized in the loop. varied wire sizes have varied resistance values that effect the voltage loss and communication dependability.

Receiver Resistance is the load on PLC inputs, DCS input cards, isolators, recorders or other receiving devices. This increases the total resistance of the loop and the voltage available at the transmitter.

Device Minimum Voltage is the lowest operational voltage that the transmitter manufacturer has specified. The loop voltage available must be higher than this number for proper functioning and HART communication.

Barrier Voltage Drop The voltage used by intrinsic safety barriers or isolators that are installed in the loop. This value is included to make sure that the voltage budgeting in design and commissioning is correct.

Number of Devices in Loop. This indicates how many devices are connected in the circuit. Additional devices can alter loading, communication performance and overall loop design issues.

Test Your Diagnostic Skills with Real-World Challenges: Closed-Loop Control Valve Troubleshooting: HART, Fieldbus and Diagnostics Skills Quiz

Using the calculator is straightforward.

  1. First, enter the supply voltage of the loop. This is usually 24 VDC in many process plants, but actual values may vary depending on the power supply and system architecture.
  2. Next, enter the loop current. For most checks, users test at 20 mA because that is the worst case for voltage drop. This gives the most conservative result.
  3. Then enter the cable length and select or enter the cable type or resistance. This helps the calculator estimate the voltage lost in the field wiring.
  4. After that, add the receiver resistance. This may come from the input card, isolator, modem, or other load in the loop.
  5. Enter the device minimum voltage from the transmitter datasheet or device specification. This value is essential for a realistic result.
  6. If the loop includes an intrinsic safety barrier, add the barrier voltage drop.
  7. Lastly, if your installation comprises many devices connected in a loop or a multi-drop configuration, specify the number of devices in the loop.

Enter the values, perform the computation and review the outputs. Focus first on voltage at device, voltage margin, and communication status. Then check total resistance and maximum cable length for design improvement.

Learn the Technology Behind Millions of Installed Devices: What is HART Protocol?

How to Interpret PASS, MARGINAL and FAIL in HART Communication

The communication result gives a fast decision view.

PASS means the loop has enough voltage margin and resistance conditions are acceptable for reliable HART communication. This is the condition you want during commissioning and normal operation.

MARGINAL implies the loop is still functioning but the voltage margin is low. In this condition, HART communication may work sometimes and fail at other times, especially when process current changes, temperature increases, or field wiring ages. A marginal result should not be ignored.

Calculate Transmitter Output Accurately Every Single Time: Transmitter Calibration Calculator: How to Calculate Span, LRV, URV, and 4 to 20 mA.

FAIL means the device probably does not have enough voltage to operate reliably, or the loop burden is too high for stable communication. In this case, HART polling, configuration, or device diagnostics may fail completely.

A good rule in field work is simple. If the result is marginal, treat it as a future failure, not a temporary success.

Explore the Evolution of Industrial Communication Networks: Comparison between Conventional (4-20ma) connection, Foundation-Fieldbus, and HART?

HART Communication Troubleshooting for Low Voltage Margin
  • When the calculator shows low voltage margin, the first step is to reduce unnecessary burden in the loop. Check whether the receiver resistance is too high, whether the barrier drop is excessive, or whether the cable run is longer than planned.
  • If the cable resistance is the problem, consider a lower resistance cable size, a shorter routing path, or a better loop layout. In long field runs, even a small change in conductor size can improve the result.
  • If the barrier drop is too high, verify whether the selected barrier is correct for the application. Some loops are designed with more margin than others, but the barrier must still be included in the full budget.
  • If communication is unstable even though the loop looks acceptable on paper, check for poor terminations, ground issues, loose marshalling connections, damaged cable, electromagnetic interference, or incorrect HART device configuration. HART is robust, but it is not immune to bad wiring practices.
  • When troubleshooting a weak loop, it is also wise to test the device directly with a handheld communicator or HART modem at the instrument terminals. That helps separate field wiring problems from device problems.

Understand Why HART Remains an Industry Standard: What is HART Communication Protocol and HART Multiplexer?

  • Good instrument loop design starts with budget planning. Do not design only for nominal operation. Design for worst case current, actual cable length, barrier losses, and minimum device voltage.
  • Always check the loop at 20 mA when possible because that represents the highest voltage drop condition in a 4 to 20 mA loop. This gives a more realistic view of the design margin.
  • Use the correct cable resistance value rather than guessing. Cable size, conductor material, and route length all affect the result.
  • Include all series loads in the calculation, especially safety barriers, isolators, input cards, and communication interfaces. A loop that looks fine with only cable and transmitter included can fail once real equipment is added.
  • During commissioning, verify voltage at the device, not just supply voltage at the cabinet. The cabinet may show healthy supply, but the instrument may still be starved after all losses are included.
  • For multidrop or multi device applications, confirm that the number of devices in the loop does not create unexpected loading or communication behavior. Even when current is low, the installation must still support stable HART signaling.
  • Most importantly, keep a healthy margin. A loop that barely passes on paper often becomes a field problem later.

Solve Communication Issues Using This Simple Principle: Why is a 250-Ohm Resistor Important for HART Communication?

Commissioning teams often work under time pressure. A rapid, accurate calculator helps them validate the loop is ready before powering up the instrument or doing a HART configuration.

This saves unnecessary site troubleshooting, avoids repeated cable inspections and decreases the possibility of wrong assumptions while performing loop check activity. It also supports safer commissioning because the engineer can identify weak loops before they cause intermittent failures.

For EPC teams, the calculator is helpful during design review and vendor coordination. For maintenance teams, it helps isolate whether the problem is in the loop design or in the device itself. It provides students with a clear practical understanding of how 4 to 20 mA and HART communication are used together in real installations.

Challenge Yourself with Advanced HART Engineering Questions: Advanced HART Protocol Quiz: 25 MCQs with Detailed Explanations

The HART Loop Calculator is a very useful tool for anyone dealing with field instrumentation, 4 to 20 mA loops and HART communication. A simple calculation helps to evaluate the supply voltage, loop current, cable resistance, receiver burden, barrier drop, and device minimum voltage. By showing total resistance, voltage drop, voltage at device, voltage margin, maximum cable length, health score, and communication status, it gives a complete picture of loop performance.

In real plant work, that means better design, faster troubleshooting, safer commissioning, and more reliable communication in the field.

Build a Reliable Calibration Setup Without Guesswork: Wiring Diagram for Pressure Transmitter Calibration in Workbench using HART

A HART Loop Calculator is a tool used to determine whether a 4 to 20 mA loop has sufficient voltage and acceptable resistance for reliable HART communication and transmitter operation.

Voltage margin is the extra voltage remaining after all loop losses have been taken into consideration. A sufficient margin contributes to consistent transmitter operation and reliable HART communication.

Yes. If the available voltage is too low or the loop resistance is too high, a loop can convey the 4 to 20 mA signal correctly yet HART communication becomes unreliable.

The longer runs of cable mean more resistance in the loop, which means more voltage drop. This may cause a voltage drop at the field device and degrade the dependability of connection.

PASS means the loop is healthy and there is enough voltage margin. MARGINAL signifies the loop is running near its limits and FAIL means the loop may not sustain dependable operation or communications.

Yes. Barrier voltage drop reduces the voltage available to the field device and must be included to accurately assess loop performance and communication capability.

HART is not a replacement for 4 to 20 mA. It is a digital communication protocol that operates on top of the standard 4 to 20 mA analog current loop.

A 250 ohm resistor provides the minimum load resistance needed for HART communication. It allows the digital HART signal to be properly detected and interpreted by communicators and modems.

No. The process variable is transmitted by the 4 to 20 mA signal, and HART provides digital communications capabilities on top of the same pair of wires for configuration and diagnostics.

The HART protocol is implemented by connecting a HART communicator or modem to a suitable loop. engineers can configure equipment, view diagnostics and get further process information.

HART operates on a DC powered 4 to 20 mA loop but uses a small AC frequency shift keyed signal for digital communication. Both signals coexist on the same wiring.

The 250 ohm resistor is installed in series within the current loop, typically near the control system input. The HART communicator is then connected across the resistor or designated communication terminals.

Marshalling Panel vs Junction Box vs System Cabinet: Complete Guide for Instrumentation and Control Engineers

0
Marshalling Panel vs Junction Box vs System Cabinet: Complete Guide for Instrumentation and Control Engineers
Table of Contents

In instrumentation and control projects, many engineers use the terms Junction Box, Marshalling Panel, and System Cabinet as though they mean the same thing. They do not. Each enclosure has a distinct role in the signal chain, and each one affects cabling, commissioning, troubleshooting, cost, and maintainability in a different way.

A Junction Box is mainly a field termination point. A Marshalling Panel is a signal routing and organization point. A System Cabinet is the home of active automation hardware such as PLCs, DCS controllers, I O cards, communication modules, power supplies, and network devices.

When these roles are not understood clearly, the project suffers. Cable schedules become confusing. Loop checks take longer. The signal is hard to trace. Maintenance crews have a hard time locating an issue. EPC teams also face repeated drawing revisions and unnecessary rework.

In a typical process plant, the signal path often follows this order:

  • Field instrument
  • Junction Box
  • Marshalling Panel
  • System Cabinet
  • DCS or PLC Controller
  • Operator Station

That architecture remains fundamental in large automation projects because it creates traceability, order, and reliability across the entire instrumentation system.

Avoid Costly Commissioning Delays With These Proven Checks: Factory Acceptance Test (FAT) Procedure & Checklist for Marshalling Cabinets

What is a Junction Box in Instrumentation?

A Junction Box is a passive container for terminating and collecting field wiring from equipment in the plant area. It is designed to protect terminations and simplify the transition from individual field cables to multicore cables or trunk cables.

A Junction Box is a termination enclosure used for local field wiring consolidation. It does not process signals. It does not perform logic. It does not contain controller hardware.

Its main purpose is to make field wiring practical and safe. Instead of running every instrument cable all the way to the control room, engineers can collect nearby instrument wiring in one enclosure and then route that wiring more efficiently.

A typical Junction Box contains terminal blocks, cable glands, earthing terminals, shield termination points, and identification tags. In hazardous locations, the enclosure type and gland selection must suit the area classification.

There are several common types.

  • Instrumentation Junction Box For transmitters, switches, and valve instrumentation
  • Power Junction Box For power distribution applications
  • Hazardous Area Junction Box: Used in classified areas where safety and certification are necessary
  • Weatherproof Junction Box: Applications requiring dust and moisture protection
  • Explosion Proof Junction Box: For use where the environment may be ignitable and enclosure integrity is important

Junction boxes are commonly utilized in process facilities, utilities, remote field locations, tank farms, pipe racks and skid mounted systems.

A Junction Box provides easier installation, minimizes local cable clutter and helps organize field termination. It also helps shorten individual cable runs from instruments to the first termination point.

A Junction Box is only a termination point. It cannot organize signals by I O type, it cannot perform cross wiring, and it cannot replace marshalling. It also cannot host active control hardware.

Real Field Example

If several pressure transmitters are installed around a storage tank, their individual cables may first arrive at a local Junction Box. From there, a multicore cable can carry the collected signals to the marshalling area. This arrangement reduces cable complexity in the field and keeps the wiring more orderly.

What Is a Marshalling Panel in Instrumentation?

A Marshalling Panel is the organized signal routing point between field terminations and the control system. It is where incoming signals are redistributed so they match the layout and channel order of the DCS or PLC system.

A Marshalling Panel is a signal arrangement enclosure used to receive field wiring and route it toward the correct control system inputs and outputs.

Field wiring is arranged by physical location, equipment grouping, or cable pull convenience. Control system wiring is arranged by I O card type, signal type, loop design, and system architecture. These two arrangements usually do not match. Marshalling exists to bridge that gap.

The purpose of marshalling is to sort, segregate, identify, and route each signal correctly. It also allows a design team to separate analog, digital, RTD, thermocouple, pulse, and special purpose circuits in a disciplined way.

A good marshalling design creates a clear path from the field side to the control side. It reduces confusion during commissioning and supports long term maintenance. It also allows engineers to trace every loop from field device to controller channel.

Strengthen Functional Safety Compliance With Expert Checks: Advanced Safety Instrumented System (SIS) Inspection Checklist for IEC 61511 Compliance

Cross wiring is the practice of taking a field side termination and connecting it to a different outgoing termination that matches the controller or I O system requirement. This is essential when field cable order does not match control system card order.

Prevent Hidden Wiring Errors Before Project Startup: Shutdown Maintenance Procedure for Marshalling Cabinets in Process Plant

Signal Segregation in Marshalling Panels

A robust marshalling panel keeps the following signal groups properly separated:

  • Analog Inputs
  • Analog Outputs
  • Digital Inputs
  • Digital Outputs
  • RTD signals
  • Thermocouple signals
  • Pulse signals

This separation reduces noise problems, avoids wiring errors, and makes troubleshooting much easier.

Prevent Grounding Issues That Damage Instrument Signals: Single Point vs Multiple Point Grounding in Instrumentation Systems: Complete Guide for Engineers

A Marshalling Panel commonly contains terminal blocks, fuse terminals, disconnect terminals, intrinsic safety barriers, surge protection devices, signal isolators, cable management hardware, and durable identification tags.

Typical Marshalling Layout

The incoming side receives field cables or cables from Junction Boxes. The outgoing side sends organized signals toward the system cabinet or controller I O arrangement. Each signal should be traceable through the panel without ambiguity.

Signal Routing Examples

A pressure transmitter may terminate first in a Junction Box, then in the marshalling panel, and then continue to an analog input card in the system cabinet.

A valve solenoid may follow a similar path but land on a digital output card.

An RTD may be routed with careful attention to conductor grouping and signal integrity.

A good marshalling panel design must consider signal count, spare capacity, future expansion, intrinsic safety separation, shield grounding, cable density, terminal accessibility, and maintenance clearance.

Maintenance Considerations

When a loop fails, the marshalling panel is often the best place to isolate the fault. Maintenance teams can check field integrity, cable continuity, barrier condition, and outgoing system side wiring from this single point.

Commissioning Perspective

Commissioning teams use marshalling panels to verify cable numbers, terminal tightness, shield landing, polarity, continuity, and signal routing before live operation begins.

Marshalling improves traceability, supports orderly testing, simplifies expansion, and helps the commissioning team verify loops one by one.

A marshalling panel adds cost, occupies space, and increases the number of terminations. That means workmanship, documentation, and labeling must be excellent.

Real EPC Project Example

In a large process unit, many Junction Boxes may feed one marshalling panel. From there, signals are redistributed to the correct DCS I O channels. This allows the field cabling to stay practical while the control system receives signals in an organized form.

Everything Engineers Must Verify Before System Handover: Marshalling Cabinet: Complete Guide to Design, Wiring, Testing and Applications

What Is a System Cabinet in DCS and PLC Systems?

The System Cabinet is the enclosure containing active automation hardware. This is the brain of the automation system and deals with processing, communication, power distribution, diagnostics and integration.

A System Cabinet is a control enclosure that houses the hardware used to Signal Segregation in Marshalling Panels execute plant logic and manage communication between field signals and control software.

It is called the brain because it contains the controller hardware that makes decisions, executes control logic, and coordinates process actions.

The Engineering Secrets Behind Reliable System Grounding: Grounding and Bonding in Instrumentation and Control Systems

A System Cabinet may contain PLC CPUs, DCS controllers, I O modules, communication cards, Ethernet switches, redundancy modules, power supplies, relays, and network components.

Depending on the project, the system cabinet may be arranged as a controller cabinet, I O cabinet, network cabinet, server cabinet, or engineering workstation cabinet.

Redundancy Architecture in System Cabinets

Critical plants often use redundant controllers, redundant communication paths, and redundant power supplies. This improves availability and reduces the impact of a single hardware failure.

Discover Essential DCS Testing Steps Before Acceptance: Factory Acceptance Test Procedure for Distributed Control System DCS

The system cabinet provides intelligence, control, diagnostics, and communication. It is indispensable in modern automation systems.

It requires careful environmental protection, proper cooling, clean installation, and disciplined maintenance. It also needs stronger documentation than passive enclosures.

Real Plant Example

Critical Design Insights Every Automation Engineer Needs: Marshalling Cabinet drawing and its significance

How Signal Travels from Field Instrument to Operator Station

Traditional plants used large amounts of physical cross wiring and extensive marshalling. Conventional DCS design improved structure and traceability. Later, electronic marshalling reduced physical wiring by allowing flexible channel assignment. Smart I O and remote I O reduced the need for long field cable runs.

Modern digital architectures continue to simplify wiring and improve diagnostics. Even so, the essential logic remains the same. Field devices still need to be collected, organized, and delivered to the automation system in a controlled and traceable way.

Example 

A pressure transmitter measures process pressure in the field. Its cable enters a nearby Junction Box. From there, a multicore cable carries the signal to the Marshalling Panel. The marshalling panel recognizes the signal and directs it to the appropriate outgoing terminal. The outgoing side is connected to the proper channel in the System Cabinet. The controller receives the value, applies control logic and communicates the result to the operator station.

This journey is important because every stage has a different purpose. If one stage is misunderstood, the whole loop becomes harder to install, test, and maintain.

Stop Missing These Essential Field Wiring Requirements: 25-Point  Instrumentation Junction Box (JB) Wiring and Termination Checklist for EPC Engineers

Marshalling Panel vs Junction Box vs System Cabinet
ParameterJunction BoxMarshalling PanelSystem Cabinet
PurposeProvides termination and protection for field wiringProvides routing, organization, and signal distributionProvides control, automation, and active processing
LocationUsually installed in the field near instrumentsUsually installed in the control room or marshalling roomUsually installed in the control room or system room
Signal RoleCollects field signals from instrumentsArranges and redistributes signalsProcesses signals and executes control logic
IntelligenceNo intelligenceNo control intelligenceHas active intelligence and control capability
ComponentsPassive termination hardware, cable glands, earthing terminals, shield termination pointsTerminal hardware, protection devices, routing elements, labeling systemControllers, cards, power supplies, communication hardware, network devices
Cross WiringDoes not perform cross wiringPerforms cross wiring between field side and system sideNormally receives organized terminations rather than field cross wiring
Power HandlingUsually handles only local termination and small signal level connectionsHandles signal level protection and segregationDistributes and uses regulated control power for active equipment
Maintenance FocusSupports field level maintenanceSupports signal tracing and loop troubleshootingSupports automation hardware maintenance
Commissioning EffortBasic checks such as continuity and termination verificationDetailed checks such as routing, tagging, and shield verificationHighly detailed checks such as logic, power, communication, and redundancy verification
CostLowest costModerate costHighest cost
ComplexitySimple and compactMedium complexityHigh complexity
ExpansionExpansion is local and limited by enclosure sizeExpansion depends on spare terminals and panel spaceExpansion depends on rack space, card capacity, and system design
DocumentationCable schedule, terminal schedule, gland detailsCross wiring schedule, loop drawings, terminal planRack drawings, card schedule, network drawings, system architecture
TestingChecked for continuity, polarity, and termination qualityChecked for routing accuracy, segregation, and shield integrityChecked for logic, power quality, communication, and system response
TroubleshootingHelps isolate field cable issuesHelps isolate wiring and routing issuesHelps isolate controller, card, and hardware issues
Signal TypesMay carry many field signal typesSeparates analog signals, digital signals, RTD, thermocouple, and pulse signalsReceives system ready signal inputs and outputs for control action
Hazardous Area SuitabilityCommonly used near field hazardous areasUsually located in a safe areaNormally installed in a controlled and protected room
Labeling NeedNeeds local identification onlyNeeds detailed loop labels and terminal labelsNeeds card labels, channel labels, and rack labels
Noise ControlLimited noise controlImproves noise management through segregation and groundingDepends on system design and enclosure discipline
Overall RoleTerminationOrganizationControl
Typical Project UseFirst point of field cable collectionIntermediate point for signal routing and redistributionFinal point for control hardware and automation execution

Test Smarter and Eliminate Expensive Site Rework: Advanced 25-MCQ on Instrumentation Junction Box Schedule Engineering Drawing

FactorDetailed ExplanationPractical Impact
Number of SignalsThe number of loops is one of the first design drivers. More signals usually mean more cable entries, more terminals, and stronger marshalling requirements.Helps determine the enclosure size, terminal count, and wiring layout.
Future ExpansionProjects should include spare terminal capacity and spare rack space wherever possible. Future modifications become much easier when space is reserved early.Reduces rework and makes later plant changes easier.
Hazardous Area ClassificationEnclosures and glands must match the site classification. It influences the choice of material, certification and installation procedure.Ensures compliance with safety and suitable equipment choices.
Maintenance PhilosophyIf the plant is going to require a lot of troubleshooting and changes, a more robust marshalling concept can decrease future effort.Improves accessibility, traceability and serviceability.
Redundancy RequirementsCritical plants may require redundant controllers, redundant communication paths, and redundant power supplies in the system cabinet.Improves reliability and reduces the effect of hardware failure.
Safety RequirementsSafety related signals must be clearly separated and accurately identified. Documentation must be robust Installation must be installed to acceptable standards.Supports safe operation and compliance with regulations.
Project BudgetBudget influences the size, quality, and feature level of each enclosure. A low initial cost can lead to higher lifecycle cost if the design becomes hard to maintain.Affects both short term procurement and long term plant performance.
Lifecycle CostThe cheapest design is not always the most economical. A slightly better enclosure strategy can reduce downtime, rework, and maintenance time for years.Lowers long term operating and maintenance cost.

Master Signal Routing Techniques Used By EPC Experts: Instrument Junction Box (JB) schedule

Common Engineering MistakeDetailed ExplanationPractical Impact
Using a Junction Box as a Substitute for MarshallingA Junction Box only provides field termination and protection. It cannot perform full signal routing or cross wiring like a Marshalling Panel.Confuses during loop inspections, signal tracing and maintenance.
Mixing Analog and Digital Signals Without SegregationSeparate analog and digital circuitry to minimize interference and enhance clarity.May generate noise issues and complicate debugging.
Poor Shield Grounding PracticeShields should be grounded in accordance with the grounding philosophy of the project. Poor handling can inject unnecessary noise into the loop.Causes unreliable readings, signal interference and false warnings.
Missing Spare TerminalsProvide spare terminals for future alterations, modification, and maintenance flexibility.Costly, slow, disruptive future expansion.
Incomplete TaggingAll wires, terminals and loops will be clearly identified. Tags not present reduces traceability.Makes loop tracing slow, confusing, and error prone.
Wrong Intrinsic Safety Barrier SelectionIS barriers must match the signal type and hazardous area requirement. Incorrect selection can violate safety rules.Can compromise safety and create compliance problems.
Inadequate Terminal TighteningLoose terminals can cause intermittent contact, heat generation, and unstable signals.May lead to frequent faults and unreliable operation.
Incorrect Loop NumberingLoop numbers must match drawings, schedules, and field labels. Any mismatch creates confusion.Makes commissioning slower and less efficient.
Poor Cable Gland SelectionCable glands must suit the cable size, enclosure type, and protection requirement. Wrong glands reduce sealing quality.Can allow moisture entry and damage internal components.
No Clear Cross Wiring ScheduleCross wiring must be documented clearly so each field signal reaches the correct system channel.Leads to misrouting and repeated rework.
No Allowance for Future ExpansionThe panel should include spare capacity for additional loops and system changes.Forces early modifications and increases project cost later.
Confusing Field Termination Drawings with System DrawingsField drawings and system drawings serve different purposes and must not be mixed.Makes installation, testing, and verification much harder.
Using the Wrong Terminal Type for Disconnect NeedsDisconnect terminals should be used where isolation and testing are required. Standard terminals may not be enough.Makes testing and isolation difficult.
Overcrowding the PanelToo many components in a small space reduce access and increase wiring difficulty.Reduces maintenance access and raises the chance of errors.
Weak Revision ControlDrawings and schedules must be updated whenever changes are made. Poor revision control creates mismatch between documents and field work.Causes divergence between installation records and actual wiring.

Avoid Documentation Mistakes That Cause Major Delays: Instrument Index Generator for EPC Instrumentation Projects

A Junction Box is used to collect and terminate field wiring near the instruments. A Marshalling Panel is used to organize, route, and redistribute those signals toward the control system.

A Marshalling Panel receives field cables and arranges them in a clear signal order. It makes loop tracing, cross wiring, and control system connection much easier.

A System Cabinet houses active control hardware such as PLC or DCS components. It processes signals, runs control logic, and supports communication with the plant system.

Cross wiring is used because field cable order usually does not match control system I O order. It helps route each signal to the correct controller channel.

No, a Junction Box is normally a passive enclosure for termination only. Active control hardware belongs in a System Cabinet or similar control enclosure.

Marshalling Panels commonly route analog inputs, analog outputs, digital inputs, digital outputs, RTD, thermocouple, and pulse signals. The panel separates and organizes them before they reach the system cabinet.

SCADA Acceptance Testing Steps Every Engineer Should Know: Factory Acceptance Test (FAT) Activities for SCADA System: Step-by-Step Checklist

System Cabinets hold the hardware that actually controls the process. They contain the CPU, I O modules, power supplies, and communication devices needed for automation.

They look at signal count, project size, future expansion, safety needs, and maintenance philosophy. Larger and more complex plants usually need marshalling for better traceability.

Shielding helps reduce electrical noise and signal interference. Proper shield termination improves signal stability and prevents false readings.

Common mistakes include poor labeling, wrong cross wiring, missing spare terminals, weak shield grounding, and mixing signal types without segregation. These errors increase commissioning time and make troubleshooting difficult.

Field Reading Problems Solved Using Proven Methods: Loop Checking Field vs Control Room Reading Mismatch Explained

  1. Define the signal architecture early in engineering.
  2. Keep field termination, marshalling, and control hardware responsibilities separate.
  3. Maintain strict loop numbering discipline.
  4. Use clear and durable labels.
  5. Reserve spare terminals and spare cabinet space.
  6. Keep analog, digital, and safety signals segregated.
  7. Apply the correct shield grounding philosophy.
  8. Select enclosure ratings according to site conditions.
  9. Standardize terminal block types across the project.
  10. Use approved cross wiring schedules.
  11. Verify drawings before cable installation.
  12. Keep revision control strict.
  13. Involve commissioning teams during design review.
  14. Plan maintenance access from the beginning.
  15. Document all deviations immediately.
  16. Verify intrinsic safety details carefully.
  17. Use consistent cable identification practices.
  18. Allow for future expansion.
  19. Protect active cabinet hardware from heat and dust.
  20. Train field and control teams on the same signal philosophy.

Avoid PLC Panel Failures With Proper FAT Planning: Factory Acceptance Test (FAT) of a PLC Panel: A Step-by-Step Basic Guide

A Junction Box provides protection and termination. A Marshalling Panel provides signal organization and routing. A System Cabinet provides control and automation.

When these three elements are designed properly, the plant becomes easier to build, commission, operate, and maintain. For EPC projects, the value is not only in the hardware itself but in the quality of the signal architecture. Good design reduces confusion, improves reliability, and saves time throughout the asset life cycle.

Preparation of IO List Documentation in EPC Engineering in Process Industries: Advanced Quiz for Instrumentation and Control Engineers

0
Preparation of IO List Documentation in EPC Engineering in Process Industries: Advanced Quiz for Instrumentation and Control Engineers

The IO list is the heart of instrumentation engineering in EPC projects since it integrates field instruments, signal kinds, control systems and execution documentation in a single structured project reference. If the IO list is not complete or adequate, it might lead to design flaws, procurement problems and commissioning delays. Testing your expertise is a means to enhance coordination, improve control system design, and minimize costly mistakes in process industries during thorough engineering and launch.

Preparation of IO List Documentation in EPC Engineering in Process Industries: Advanced Quiz for Instrumentation and Control Engineers

The high-end quiz on documentation of IO list in EPC engineering is targeted to the professionals who are working in process industries where every signal matters. A well-prepared IO list drives instrumentation engineering, PLC DCS mapping, control system planning and precise engineering coordination across disciplines. It supports P and ID alignment, instrument index control, cabinet sizing, terminal allocation, vendor coordination, and revision management. By practicing scenario based questions, engineers can improve project execution quality, reduce rework, and strengthen the connection between field devices and the final control system design during construction, testing, and commissioning in oil and gas, chemical, power, pharmaceutical, water treatment, and utility projects.

1 / 25

Before final IFC issue, what is the strongest quality check for IO list documentation?

2 / 25

A smart field device offers diagnostics through communication, but the DCS needs only one status point. How should the IO list be written?


3 / 25

How does a good IO list support cause and effect development?

4 / 25

During loop check preparation, several IO points are added after the cable schedule is frozen. What is the likely consequence?

5 / 25

A vibration switch is shown as a process alarm instead of an equipment protection signal. Why does this matter?

6 / 25

A project plans a DCS system with remote I O panels. What IO list detail becomes especially important?

7 / 25

Why is IO list documentation important during procurement?

8 / 25

 A level switch is listed as AI because the process engineer expects a future transmitter. What should be done now?

9 / 25

The IO list includes an engineering unit column for every analog point. Why is this useful?

10 / 25

A project uses one IO list for PLC and DCS areas, but ownership is not clearly separated. What is the best practice?

11 / 25

What is the most reliable sequence for finalizing IO list documentation during detailed engineering?

12 / 25

A critical compressor trip signal is listed like a normal digital input with no special remark. Why is this a concern?

13 / 25

An analog input is shown as 0 to 10 V in the IO list, but the selected PLC module accepts only 4 to 20 mA directly. What should happen?

14 / 25

A junction box is being designed for several field instruments. Which IO list detail is most important for terminal planning?

15 / 25

The IO list shows an AI point, but the instrument data sheet shows a discrete switch output. What does this indicate?

16 / 25


A vendor sends a package skid IO list that does not match the project standard. What should be done?

17 / 25

A shutdown valve belongs to the safety system, but the DCS also needs status indication. How should the IO list handle this?

18 / 25

Two instruments share the same tag number across different packages. What is the best EPC engineering response?

19 / 25

A DCS cabinet has limited spare terminals, while future expansion is expected. What is the best IO list practice?

20 / 25

The IO list shows a temperature element tag, but the loop diagram is still under review. What should the project team assume?

21 / 25

A control valve is intended to fail closed on air loss, but the IO list does not mention fail action. What is the main risk?

22 / 25

A flow transmitter sends a 4 to 20 mA signal to the DCS for indication only. How should it be classified in the IO list?

23 / 25

A motor operated valve requires open and close commands, status feedback, and permissive inputs. How should it be represented in the IO list?

24 / 25

A pressure transmitter appears in the instrument index and also in the IO list. What is the most accurate interpretation?

25 / 25

During detailed engineering, the P and ID is updated after the IO list has already been issued for vendor review. What should be done first?

Your score is

The average score is 55%

0%

The high-end quiz on documentation of IO list in EPC engineering is targeted to the professionals who are working in process industries where every signal matters. A well-prepared IO list drives instrumentation engineering, PLC DCS mapping, control system planning and precise engineering coordination across disciplines. It supports P and ID alignment, instrument index control, cabinet sizing, terminal allocation, vendor coordination, and revision management. By practicing scenario based questions, engineers can improve project execution quality, reduce rework, and strengthen the connection between field devices and the final control system design during construction, testing, and commissioning in oil and gas, chemical, power, pharmaceutical, water treatment, and utility projects.

Access 1000+ MCQs tailored for instrumentation engineers:Instrumentation and Process Control Quiz Hub – 1000+ MCQs for Engineers 

#IOListDocumentation #InstrumentationEngineering #EPCEngineering #ProcessIndustries #PLCDCSMapping #ControlSystemDesign #DetailedEngineering #InstrumentationQuiz #ControlSystems #AutomationEngineering #IndustrialAutomation #InstrumentIndex #SignalClassification #EngineeringDocumentation #DCS #PLCProgramming #Commissioning #LoopChecking #ProcessControl #IndustrialEngineering #OilAndGasEngineering #ChemicalEngineering #PowerPlantEngineering #AutomationProfessionals #EngineeringTraining 

Faulty Thermocouple Replacement Procedure in Process Area: Complete Step-by-Step Field Guide for Instrumentation Engineers

0
Faulty Thermocouple Replacement Procedure in Process Area: Complete Step-by-Step Field Guide for Instrumentation Engineers
Table of Contents

Thermocouples are one of the most widely used temperature sensors in process industries because they are rugged, fast responding, and suitable for high-temperature applications. In refineries, petrochemical plants, power stations, chemical units, and pharmaceutical facilities, a faulty thermocouple can quickly affect process control, product quality, energy efficiency, and equipment protection.

A wrong temperature signal may lead to poor combustion control, unstable reactor conditions, overheated equipment, unsafe operating conditions, and nuisance trips. In severe cases, replacing a thermocouple incorrectly can create a new fault even after the original problem has been removed. That is why thermocouple replacement must be carried out in a disciplined sequence, with attention to safety, isolation, verification, installation, and final loop checking.

Where thermocouples are installed in thermowells, maintenance is generally safer and more practical because the sensor can be replaced without direct process exposure. Even then, thermowell condition, insertion length, and proper seating remain critical for accuracy and reliability.

This procedure defines the safe method for replacing a faulty thermocouple in a process area. It applies to thermocouples installed in thermowells, terminal heads, junction boxes, and associated field wiring connected to PLC, DCS, SIS, or monitoring systems.

Stop Making This Costly Wiring Mistake Every Engineer Faces: Thermocouple Wire vs. Thermocouple Extension Wire: The Complete Guide for Instrumentation Engineers

A thermocouple should not be replaced just because the indication looks unusual once. The fault must be confirmed by checking the signal, the field wiring, the junction box, the extension cable, and the control system input.

Common signs include:

  • Open circuit or faulty sensor
  • Temperature reading stuck at one value
  • Sporadic Variations
  • Apparent drift or slow drift
  • Incorrect temperature reading relative to neighboring instruments
  • Terminal loose connection
  • Ingress of moisture in junction box or head assembly
  • Corrosion on terminal or sheath
  • Mechanical damage to probe or lead wire
  • Burnout from process overheating
  • Damaged extension cable or incorrect cable material
Faulty Thermocouple Replacement Procedure  - How to Confirm the Fault Before Replacement

Check the signal at the transmitter or input card before replacing the sensor; check terminals, continuity, compare with a good reference and determine if the fault is in the sensor or the wiring line. This avoids unnecessary removal of a healthy thermocouple.

Good thermocouple replacement starts before the technician reaches the field. Review all available documentation and confirm the instrument tag and service conditions

  • Operations Personnel: Confirm process readiness, approve required bypasses, and coordinate plant conditions during maintenance.
  • Instrumentation Technician: Isolate, replace, wire, verify and restore according this method.
  • Instrumentation Lead: Check permit compliance, job preparedness, spare availability and final work completion.
  • Control Room Operator: (no text) Monitor Process Conditions Implement Approved Bypasses and Verify Signal Restoration after Maintenance.

Check the following:

  • P&ID
  • Instrument index
  • Loop diagram
  • Hook-up drawing
  • Cause and effect matrix
  • Instrument datasheet
  • Control narrative

Confirm:

  • Tag number
  • Service description
  • Thermocouple type
  • Measuring range
  • Insertion length
  • Thermowell type
  • Junction type
  • Process conditions

Before opening the work order, check:

  • Thermocouple type correct
  • Proper sheath material
  • Insertion length correct
  • Correct process connection 
  • Right polarity
  • Certificate of calibration, if relevant
  • Compatibility of material with process fluid

Wrong choice of thermocouple can lead to substantial measurement errors, sluggish response, or premature failure due to chemical attack, vibration, or temperature mismatch.

Instantly Convert Sensor Signals Without Complex Calculations: Thermocouple Voltage ↔ Temperature Calculator

  • Correct replacement thermocouple
  • Approved thermocouple extension cable
  • Multimeter
  • Temperature calibrator or loop calibrator
  • Insulated hand tools
  • Cable identification tags
  • Terminal lugs and ferrules
  • Cleaning materials
  • Flashlight
  • Portable communication device
  • Approved PPE
  • Calibration certificate where applicable

Select PPE based on the task and the area hazard.

Required PPE

  • Safety helmet
  • Safety glasses
  • Face shield
  • Flame resistant clothing
  • Heat resistant gloves
  • Chemical resistant gloves
  • Cut resistant gloves
  • Safety shoes
  • Hearing protection
  • Respiratory protection where required

Thermocouple removal often exposes technicians to residual process heat. Even after isolation, the thermowell and sensor housing may remain hot enough to cause burns. Heat resistant gloves help prevent:

  • Contact burns during sensor removal
  • Hand injury from hot thermowell surfaces
  • Accidental contact with heated metal parts
  • Reduced grip due to sudden heat exposure

The Accuracy Secret Many Temperature Systems Still Miss: Why Thermocouple Reference Junction Compensation(CJC) is Essential for Accurate Temperature Measurement ?

No thermocouple replacement in a process area should begin without valid permits. The permit system protects both personnel and the plant.

Depending on the job, obtain:

  • Instrument maintenance permit
  • Electrical isolation permit
  • Hot work permit, if applicable
  • Cold work permit
  • Area entry permit
  • Confined space permit, if applicable

Verify:

  • Permit validity period
  • Approval hierarchy
  • Exact job scope
  • Work location
  • Identified hazards
  • Control measures
  • Responsible signatories

If the scope of work changes, cease work and revalidate the permission before starting work.

Turn Raw Sensor Signals Into Reliable Process Values: How to Convert Thermocouple Millivolts to Temperature: A Step-by-Step Guide

Faulty Thermocouple Replacement Procedure  - Job Safety Analysis and Risk Assessment

Carry out a job safety analysis before starting.

  • Hot surfaces
  • High process temperature
  • Steam lines
  • Chemical exposure
  • Toxic gas exposure
  • Rotating equipment nearby
  • Slips, trips, and poor access
  • Electrical hazards
  • Barricade the work area
  • Confirm isolation boundaries
  • Maintain clear communication with operations
  • Perform gas testing where required
  • Keep emergency response arrangements ready
  • Ensure escape routes are not blocked

A thermocouple job may look small, but in a live process area, the surrounding hazards are often more serious than the instrument itself.

Only Experts Can Score High On This Challenge: Advanced Thermocouple Knowledge Quiz: Principles, Types, and Industrial Applications

Before disturbing the sensor, coordinate with the control room or operating team.

Depending on plant philosophy, apply temporary bypasses for:

  • Alarm bypass
  • Trip bypass
  • Shutdown bypass
  • Interlock bypass
  • Put affected loop in manual mode if required
  • Break cascade if the signal is part of a control structure
  • Freeze output if necessary
  • Maintain active process monitoring

Removing a thermocouple without preparing the control system can create false alarms, process upset, or unwanted shutdowns. The operator must know exactly what is being bypassed and when it will be restored.

Avoid Conversion Errors That Cause Major Process Issues: Converting Thermocouple Millivolts to Temperature: Methods and Examples

Thermocouple replacement often involves low-voltage circuits, but low voltage does not mean no hazard. Follow full lockout and tagout discipline.

  1. Identify the correct power source.
  2. Open the isolator.
  3. Remove fuse if applicable.
  4. Apply lock.
  5. Apply tag.
  6. Record the isolation in the permit or lock register.

Confirm isolation by:

  • Voltage testing
  • Loop verification
  • Dead testing

Never trust a switch position alone. Prove zero energy before touching wiring.

Maintain:

  • Lock register entry
  • Isolation certificate
  • Authorized signatures
  • Restoration authority record

Critical Startup Checks That Prevent Future Temperature Failures: Thermocouple Commissioning Checklist

Do not remove any instrument until you have positively identified it.

  • Correct tag number
  • Correct thermocouple
  • Correct cable identification
  • Correct junction box
  • Correct DCS or PLC point

A wrong removal can create a new control problem in a different loop. In many plants, this is one of the most common maintenance errors.

Stop the work immediately and inform supervision if:

  • Incorrect thermocouple tag is identified
  • Process isolation cannot be confirmed
  • Unexpected high temperature is detected
  • Thermowell damage is observed
  • Wrong spare thermocouple is supplied
  • Junction box contains unidentified wiring
  • Gas testing results are unsafe
  • Permit conditions are violated
  • Abnormal process conditions develop during maintenance

Use This Proven Checklist Before Replacing Any Sensor: Check List: How to Troubleshoot a Thermocouple?

  • Take a clear photograph of the terminal arrangement if possible or make proper marking and keep record of connection data.
  • Verify terminal numbers
  • Check polarity
  • Mark conductors if required
  • Loosen the terminal carefully
  • Protect conductor ends from damage
  • Inspect the cable condition
  • Check for extension cable deterioration

Thermocouple polarity is critical. Reversed polarity may not always create a complete failure, but it can give unstable or misleading readings. Use the correct extension wire for the thermocouple type.

  1. Confirm the process connection is safe to open.
  2. Gradually loosen fitting.
  3. Remove the sensor gently.
  4. Do not bend the probe
  5. Do not force the sensor if it is stuck.
  6. Protect the thermowell from mechanical damage.
  • Residual heat
  • Seized sensor inside thermowell
  • Corrosion on threads or fittings
  • Mechanical stress during extraction

If the probe does not come out smoothly, stop and inspect. Forcing the sensor may damage the thermowell or break the replacement job into a larger repair.

Can You Pass This Advanced Instrument Selection Challenge? – Quiz on RTD and Thermocouple Selection for Instrumentation Design Engineers

Faulty Thermocouple Replacement Procedure  - Thermowell Inspection and Verification

Thermowell inspection is not optional. A new thermocouple installed into a damaged thermowell will still give poor results.

Inspect for:

  • Corrosion
  • Erosion
  • Pitting
  • Cracks

Check for:

  • Bore cleanliness
  • Obstructions
  • Moisture ingress
  • Rust or debris inside the well

Confirm:

  • Thermowell insertion length
  • Bore diameter
  • Sensor fitment
  • Thread condition

Insertion length directly affects response time and measurement accuracy. If the sensor tip is not properly located in the well, the reading can lag the real process temperature. A sufficient depth of immersion and correct disposition of the thermowell are necessary for a stable measurement of temperature.

Where plant procedures require, inspect the thermowell for signs of thinning, vibration damage, cracking, excessive corrosion, or process erosion. A damaged thermowell can fail mechanically and may become a process safety hazard. Replace the thermowell if its integrity is doubtful.

Avoid Expensive Selection Errors With These Expert Tips: How to Select the Right Thermocouple for Temperature Measurement Applications?

  • Verify tag number
  • Confirm thermocouple type
  • Inspect the physical condition
  • Check calibration or supplier documentation
  1. Insert the sensor carefully.
  2. Verify correct insertion depth.
  3. Ensure full seating.
  4. Tighten the process connection to the correct torque.
  5. Confirm the probe is not under mechanical stress.

Correct immersion length, correct engagement of the thermowell. If the sensor is slack or not installed properly, thermal contact can be weak and readings can be unstable.

The Calibration Technique That Simplifies Sensor Simulation: How to simulate RTDs and Thermocouples using Multifunction calibrator?

  • Terminate on the correct terminal
  • Maintain correct polarity
  • Verify shield grounding
  • Inspect cable glands
  • Check all terminal tightness

Thermocouple polarity and proper extension cable selection are essential for signal integrity and measurement accuracy.

  • Reversed polarity
  • Loose terminal screws
  • Wrong extension wire type
  • Missing shield termination
  • Damaged gland sealing
  • Cross-wiring in junction box

Each of these can create noise, drift, or complete loss of indication.

Faulty Thermocouple Replacement Procedure  - Post-Installation Verification and Loop Testing

Post-Installation Verification and Loop Testing

  • Check terminal voltage
  • Confirm continuity
  • Measure sensor resistance and millVolt mV where applicable
  • Inspect the junction box again
  • Confirm DCS indication
  • Check PLC signal if applicable
  • Verify SCADA display
  • Observe trend stability
  • Compare with nearby temperature elements
  • Confirm process temperature consistency
  • Watch for signal stabilization after installation

The goal is not only to restore indication, but to restore trustworthy indication.

Before normal operation is resumed, remove all temporary bypasses in a controlled manner.

  • Restore alarm logic
  • Restore trip logic
  • Restore interlocks
  • Inform operations before normalization

Do not leave bypasses active after the repair is complete. This is a process safety risk.

Perform end-to-end loop verification.

  • Field sensor
  • Marshalling terminals
  • I/O channel
  • Controller input
  • HMI indication

Acceptance is achieved only when the signal is stable, correctly scaled, and consistent across the control system.

Faulty Thermocouple Replacement Procedure  - Acceptance Criteria for Successful Replacement

The replacement shall be considered successful only when:

  • Correct thermocouple type is installed
  • Correct insertion length is verified
  • Polarity is confirmed
  • Terminal connections are secure
  • Signal is stable at the DCS or PLC
  • No active alarms remain due to maintenance
  • All temporary bypasses are removed
  • Loop indication is consistent with process conditions
  • Required documentation has been completed

Once the loop is verified:

  • Remove locks
  • Remove tags
  • Restore power
  • Return controller to automatic mode
  • Inform operations
  • Confirm stable process operation

Normalization should be deliberate. A rushed return to service can undo the quality of the maintenance job.

Post Start-Up Monitoring After Thermocouple Replacement

After restoration, monitor the temperature indication for a suitable observation period.

Verify:

  • Stable trend response
  • No intermittent signal loss
  • No abnormal fluctuations
  • No unexpected alarms
  • Normal controller performance
  • Consistency with nearby temperature measurements

Any abnormal behavior shall be investigated before the work order is closed.

Record the work properly.

  • Failure details
  • Root cause observations
  • Replacement details
  • Calibration data
  • Spare consumption
  • Close the work order
  • Update asset history
  • Record reliability observations
  • Note recurring failure patterns

Good records help engineering teams identify chronic problems and improve future maintenance planning.

Discover Which Sensor Technology Fits Your Application Best: Choosing Between Thermocouples and RTDs: A Practical Guide for Temperature Sensing

Escalate the issue to supervision and engineering if:

  • The replacement thermocouple fails immediately after installation
  • The thermowell is damaged or severely corroded
  • The process temperature remains inconsistent after replacement
  • Repeated thermocouple failures occur in the same service
  • Wiring defects extend beyond the local installation
  • Control system input problems are suspected

Do not repeatedly replace sensors without determining the actual root cause of failure.

After the job, replenish the spare stock.

  • Check minimum inventory level
  • Trigger reorder if required
  • Classify critical spares correctly
  • Update inventory records

Immediate replenishment prevents delays during the next shutdown or emergency repair.

Follow These Proven Steps For Reliable Sensor Accuracy: 8 Steps Calibration Procedure for Thermocouple 

MistakeConsequence
Wrong thermocouple type installedIncorrect temperature reading
Wrong polarity connectionReversed or inaccurate signal
No bypass appliedAlarm, trip, or shutdown risk
LOTO not verifiedElectrical or process hazard
Wrong insertion lengthPoor response and accuracy
Thermowell not inspectedHidden mechanical failure remains
Wiring not labeledCross connection and confusion
Calibration certificate not checkedUnverified spare used
Improper PPE usedInjury from heat or chemicals
Alarm restoration missedUnsafe operating condition
Loose terminal connectionIntermittent signal
Wrong extension cableSignal error and drift
Sensor forced into wellMechanical damage
Missing field photo recordDifficult troubleshooting later
CMMS not updatedLoss of maintenance history
  1. Confirm the fault before replacement.
  2. Compare the reading with a nearby instrument.
  3. Review the loop diagram before going to the field.
  4. Always check thermocouple type and polarity.
  5. Use the correct extension cable, never a random spare.
  6. Photograph the existing wiring before removal.
  7. Inspect the thermowell every time the sensor is replaced.
  8. Verify insertion length against the datasheet.
  9. Never force a sensor into the well.
  10. Keep the work area barricaded.
  11. Inform the control room before disturbing the loop.
  12. Use the correct PPE for hot process areas.
  13. Check terminal tightness after reconnection.
  14. Confirm shield grounding practice.
  15. Verify indication at the DCS and locally.
  16. Watch for unstable readings after startup.
  17. Restore all bypasses before handing over.
  18. Record the failure cause, not only the replacement.
  19. Keep the spare stock organized by thermocouple type.
  20. Treat every temperature loop as a process safety item, not only an instrumentation item.
Faulty Thermocouple Replacement Procedure  - Critical Lessons Learned from Thermocouple Replacement Activities 

A thermocouple replacement in a process area must be handled as a controlled maintenance activity, not a simple sensor swap. The correct workflow starts with permit approval and safety preparation, then moves through control system bypassing, isolation, positive identification, careful removal, thermowell inspection, correct insertion length verification, proper installation, accurate wiring, signal validation, loop checking, normalization, documentation, and spare replenishment.

When each step is completed in sequence, the result is safe personnel work, stable process operation, and reliable temperature measurement. When steps are skipped, the plant often pays for it later through false readings, nuisance trips, repeat maintenance, or unsafe operating conditions.

First confirm the fault, then isolate the loop, apply LOTO, remove the old sensor carefully, inspect the thermowell, install the correct replacement, reconnect wiring with correct polarity, and verify the signal in the control system. The job should end only after loop checking, alarm restoration, and documentation are completed.

A thermocouple should be replaced only after the fault has been confirmed. Common signs include an open circuit, frozen temperature reading, erratic signal, drift, corrosion, moisture ingress, damaged wiring, or incorrect temperature indication.

Correct installation requires the proper thermocouple type, insertion length, polarity, and thermowell engagement. The sensor should be fully seated, terminals securely tightened, and the signal verified for stable operation after installation.

Yes, thermocouple replacement in process plants should be performed by qualified instrumentation personnel. The work involves permits, isolation, wiring verification, thermowell inspection, loop testing, and safe restoration of the process.

The replacement cost depends on the thermocouple type, installation location, labor requirements, plant safety procedures, and whether additional repairs such as wiring or thermowell replacement are needed. Complex process-area jobs typically cost more than simple replacements.

The time required depends on accessibility, permit requirements, isolation procedures, and testing requirements. A simple replacement may take less than an hour, while a process plant replacement involving verification and loop testing can take several hours.

Instrument Index Generator for EPC Instrumentation Projects

0
Instrument Index Generator for EPC Instrumentation Projects
Table of Contents
Instrument Index Generator

Instrument Index Generator

Powered by AutomationForum.co

0

Total Instruments

0

Analog Inputs

0

Analog Outputs

0

Digital Inputs

0

Digital Outputs

Add Instrument


S.NoTagDescriptionTypeServiceLoopPIDLocationSignalIOControl SystemAction

ISA Reference

PT, TT, FT, LT, PDT, CV, LIC, TIC, FIC

Engineering Notes

Maintain unique tags and verified IO assignments.
Powered by AutomationForum.co | Instrumentation and Control Engineering Tools

An instrument index generator is one of the most useful practical tools in EPC instrumentation engineering because it turns scattered tag details into a structured project database. In real projects, instrumentation teams must manage tag numbers, descriptions, types, services, loop numbers, PID references, locations, signal types, IO types, and control system allocation with accuracy. A small error in any one of these fields can affect design, procurement, wiring, FAT, SAT, pre commissioning, and final handover. The uploaded tool supports exactly these project needs with searchable instrument records, delete row control, clear all control, CSV export, local storage, and built in statistics for instrument counts and IO distribution. It also supports ISA style tag conventions and basic engineering discipline for unique tag management and verified IO assignment.

Avoid Costly PLC Integration Errors With This Guide: I/O List Preparation Guide for PLC, DCS and SIS Projects

What is an Instrument Index Generator

An instrument index generator is an EPC instrumentation tool used to create, maintain, and review the complete list of instruments in a project. It works as a digital instrument index template and also functions as an instrument index spreadsheet replacement for smaller teams that need a faster and more reliable way to manage data.

In a typical project, the instrument index is not just a list of tags. It is the master reference for engineering, construction, commissioning, and maintenance coordination. The tool becomes even more valuable when it allows the user to enter and track key project details such as tag number, description, type, service, loop number, PID number, location, signal type, IO type, and control system field.

For instrumentation engineers, this is more than documentation. It is a daily working register for design integrity and field execution.

The Cable Schedule Method That Prevents Rework Fast: Instrument Cable Schedule Explained with Practical Examples

What Is an Instrument Index in Instrumentation Engineering?

Instrument Index is a master document of instrumentation and control engineering to keep a complete record of all the instruments in a plant or project. It is a central repository of key data such as instrument tag numbers, description, instrument type, services, loop numbers, P and ID references, locations, signal types, IO classifications and control system assignments.

The instrument index is the basis for many of the technical deliverables including instrument datasheets, IO lists, loop diagrams, cable schedules, hook up drawings and control system database in EPC projects. It’s also useful in ensuring that all instruments are uniquely recognized and tracked appropriately throughout the project lifecycle.

The instrument index helps Instrumentation Engineers to cross check the tag details, to ensure uniformity of documentation and co-ordinate with Process, Electrical, Automation & commissioning teams. The main uses for control system engineers are IO allocation and system integration, and the main uses for commissioning teams are loop verification, calibration and startup activities.

A correctly kept instrument index increases accuracy of the project, avoids documentation errors, prevents duplicate tag assignments, and provides complete traceability from design through operation. It is one of the most important texts in EPC instrumentation engineering because of its importance.

The instrument index is the backbone of the instrumentation documentation in simple words. It helps the engineers in managing, tracking and controlling all the instruments of the plant efficiently throughout the project life cycle.

Critical Engineering Documents Every Instrument Engineer Needs: 82 Essential Drawings and Documents for Instrumentation and Control Engineers

Why Is an Instrument Index Important in EPC Projects?

The instrument index is a design tool for assigning instrument tags, defining services, creating datasheets, developing IO lists and maintaining consistency of all engineering documentation.

Instrument Index: Contains material requisitions, vendor coordination, purchase orders and instrument tracking to ensure the proper instruments are obtained for the project.

During site execution, construction teams use the instrument index to validate tag numbers, installation positions, cable routing information and field instrument details.

The instrument index is used during pre commissioning and commissioning for loop checking, calibration verification, IO validation, functional testing and starting readiness checks.

After the project is complete, the maintenance team uses the instrument index to troubleshoot, plan calibrations, equipment replacement, asset management and future plant improvements.

An accurate instrument index improves project coordination, reduces engineering errors, and provides complete instrument traceability from initial design to long term plant operation.

Core Features of the Instrument Index Generator

The tool allows engineers to add instrument records directly into the index. This is useful when the project team is building the list from datasheets, P and IDs, hook up drawings, cause and effect documents, and IO schedules.

Each record can include the main fields required for practical EPC documentation, making the tool suitable for both design phase and site execution phase work.

Tag numbering is the heart of any instrument index. The tool supports ISA style tags such as PT, TT, FT, LT, PDT, CV, LIC, TIC, and FIC.

This is important because tag consistency helps engineers quickly identify the function of the instrument. For example, PT indicates a pressure transmitter, TT indicates a temperature transmitter, FT indicates a flow transmitter, and LIC indicates a level indicating controller.

Using standard tag structures also reduces confusion during interdisciplinary review meetings and site walkdowns.

These fields make the tool practical for real EPC use.

Description explains what the instrument does.

Type defines the instrument classification.

Service identifies the process duty.

Loop number connects the tag to its loop folder and loop drawing.

Location helps field teams understand where the instrument is installed.

Together these fields create a clear engineering reference that can be used by design, construction, and commissioning teams.

The tool supports key signal types used in process industries, including 4 to 20 mA, HART, Foundation Fieldbus, Profibus PA, Modbus, and Digital.

It also supports IO type classification such as Analog Input, Analog Output, Digital Input, and Digital Output.

This is especially valuable for IO list development and for mapping field instruments to marshaling, remote IO, PLC cards, DCS channels, and SIS points. A clean control system IO list depends on this type of classification, and the tool supports that discipline in a simple and direct way.

The control system field allows the user to classify each instrument under DCS, PLC, or SIS.

That may sound simple, but it is very important in project documentation. A transmitter tied to a DCS loop is not handled the same way as a switch tied to a SIS shutdown function. Clear system allocation helps avoid late stage confusion during control philosophy review, cause and effect verification, and loop checking.

The search function allows users to quickly find a tag, service, loop, or description without scanning a long spreadsheet manually.

This saves time during engineering review, document control, and commissioning support. It also helps when a project has hundreds or thousands of tags and the team needs a fast lookup tool.

The delete row function makes correction work practical. During EPC execution, wrong entries can happen because of revised datasheets, tag renaming, or vendor changes.

Instead of leaving outdated data inside the index, the engineer can remove the incorrect row and maintain a cleaner master list.

The clear all function is useful when a team wants to reset the index and restart with a fresh project dataset.

This can be helpful in training, sample preparation, or when a team wants to rebuild the instrument list after a major scope revision.

CSV export is one of the strongest practical features because it lets engineers move data into Excel, share it with team members, or use it in other project systems.

A CSV instrument list tool is highly useful for project handover, review meetings, procurement coordination, and document control updates. It gives the team a portable output that can be filtered, audited, and distributed quickly.

Local storage support means the data remains available in the browser even after the page is closed and reopened.

For day to day engineering use, this is valuable because the team does not need to rebuild the instrument list every time. It behaves like a lightweight instrument index spreadsheet with persistence, which makes it more practical for repeated use during project execution.

Read Loop Diagrams Like a Senior Instrument Engineer: How to Read and Understand Instrument Loop Diagrams

The built in stats section gives the user a fast overview of total instruments, analog inputs, analog outputs, digital inputs, and digital outputs.

This is extremely useful for engineering review because the team can instantly see whether the IO distribution looks balanced and whether the index aligns with the expected control system scope.

For example, if the project suddenly shows a much higher number of digital inputs than expected, it may indicate missing signal classification, unreviewed cause and effect items, or duplicated device entries.

Master Instrument Index Secrets Every EPC Engineer Must Know: Instrument Index: Definition, Example, Template, Columns and Preparation Guide

How Instrument Index Generator Supports EPC Documentation

The Instrument Index Generator plays an important role in EPC projects by acting as a central source of instrument information. Instead of shuffling data around in a variety of spreadsheets and papers, engineers may use a single, organized database that can handle a wide variety of technical deliverables throughout the project lifecycle.

Instrument index Enables Consistency Between Instrument Tags and Datasheets Engineers may rapidly confirm instrument descriptions, services and types, thus avoiding documentation errors and ensuring the accuracy of datasheet information.

Signal kinds and IO classifications are part of the instrument index and can be a useful reference when building IO lists. This is to assist system engineers in accurately assigning Analog Inputs, Analog Outputs, Digital Inputs and Digital Outputs in PLC, DCS and SIS systems.

Loop diagrams require proper tag numbers, loop numbers and signal information. The index of instruments is a great resource for engineers in designing and checking loop drawings, and for ensuring uniformity among project documentation.

The instrument index provides information to identify and locate instruments for the purpose of preparing cable schedules. This ensures that the wires are accurately assigned and linked to the respective field devices during installation.

Build Reliable PLC And DCS I/O Lists Faster: PLC and DCS I/O List Development Best Practices

Accurate instrument information is required for hook-up drawings to establish installation needs. The instrument index also assists engineers in checking instrument services, locations and tag details and enhances the efficiency of field installation activities.

Instrument data is used to configure and integrate control system databases. Instrument index information assists automation engineers to create dependable PLC, DCS and SIS databases and support testing, commissioning and startup.

The Instrument Index Generator supports these critical engineering documents to increase documentation consistency, decrease manual errors and assist project teams better control instrumentation data from design to commissioning.

Stop Misreading P&IDs With These Proven Techniques: Step-by-Step Guide: Reading and Interpreting Piping and Instrumentation Diagrams (P&ID)

How Instrument Index Generator Supports EPC Documentation - Instrument Index Generator

The instrument index generator is a key reference during design for producing the control system IO list, preparing instrument datasheets, and aligning field device data with the P&ID.

In shutdown work, teams often need to quickly verify installed instruments, loop numbers and replacement tags. The tool helps field engineers manage updates fast and keep the maintenance record clean.

During pre commissioning, the instrument index helps verify that all devices are installed, tagged, and mapped to the correct loop and IO channel.

Commissioning teams can use the index to check signal type, IO type, and control system assignment before starting loop checks, simulation tests, and cause and effect validation.

Document controllers and lead engineers can use the CSV output as a controlled working file for review cycles, revision tracking, and final handover packages.

Why Accurate Hook-Up Drawings Save Project Costs: Instrument Hook-Up Drawings: Purpose and Applications

  • For instrumentation engineers, the tool eliminates manual work and maintains tag discipline.
  • It gives the lead engineers a better view of project status and IO allocation.
  • For EPC teams, it reinforces the coordination between process, instrumentation, electrical, automation and commissioning activities.
  • It makes record keeping easier for documentation specialists and offers revision control.
  • It reduces mistakes in loop identification and field verification by the commissioning teams.
  • Consistency is the main value. A uniform index of instruments makes the overall project easier to handle.

The Datasheet Mistakes That Trigger Major Project Delays: Instrument Datasheet Preparation and Interpretation Guide

  • Use a unique tag for each instrument and eliminate duplicate entries.
  • Compare the tag against the P and ID before finishing the record.
  • Keep the loop number and the PID number the same as the latest revision of the project.
  • Check the signal type for the real device and communication protocol.
  • Check IO type and direction of signal flow versus control method.
  • Update index when datasheet, loop drawing or cause and effect document is changed.
  • Export the CSV as a review copy, but preserve a restricted master record for project approval.

Master Cause And Effect Logic For Safer Operations: Cause and Effect Diagram in Instrumentation and Control Systems

  • The usual mistake is to add tags without confirming that they are unique.
  • Another error is mixing up signal type with IO type.
  • Sometimes teams also mis-assign a transmitter to the wrong control system, especially in cases when DCS, PLC and SIS scopes overlap.
  • Another common problem is missing loop numbers which causes confusion at commissioning.
  • Poor description quality is also a problem because vague names make the index harder to use in the field.
  • The best instrument index is not the longest one. It is the most accurate one.

Improve Junction Box Design Using Proven Grouping Methods: Junction Box Grouping in Industrial Instrumentation Projects

An instrument index is a master document which provides details of all instruments utilized in a plant of project. It is the primary reference for instrumentation engineering work.

It offers full transparency of all instruments and consistency in engineering papers. It also helps to avoid duplicate tags and documentation issues.

A typical instrument index includes tag number, description, services, location, loop number, and P and ID references. Other information can include signal types and control system assignments.

Instrumentation Engineers, Control Engineers, Project Managers, Commissioning teams and maintenance staff use the instrument index. It is the common reference point throughout the project lifecycle.

It helps engineers arrange instrument data and maintain consistency across drawings, datasheets and requirements. This leads to a better design and enhanced project collaboration.

Loop Check Steps Every Commissioning Engineer Should Follow: Instrument Loop Check Procedure for Commissioning Engineers

It offers instrument details for material requisitions and purchase orders. This helps make sure the right instruments are bought and tracked..

Construction teams utilize to verify instrument identifiers, placement and installation requirements. It is also useful for field inspections and progress tracking.

It is helpful to check instrument identification, loop numbers and field device information prior to testing. This reduces the overhead of loop checking and start-up.

Unique tags prevent confusion and ensure that each instrument is identified accurately. They also improve traceability across all project documents.

The instrument index references instruments shown on P and IDs. Together they provide complete information about process measurement and control devices.

It should be updated whenever instruments are added, modified, removed, or reassigned. Regular revisions ensure that the project documentation is valid and reliable.

Marshalling Cabinet Functions Every Control Engineer Should Understand: Marshalling Cabinet in Instrumentation and Control Systems

Provides easy access to instrument data for troubleshooting and calibration. It also facilitates asset management and future plant changes.

Projects can be double tagged, have paperwork discrepancies and commissioning delays. Such difficulties might cause re-work, additional expenditures and operational risk.

Yes, it is one of the most critical documents in EPC projects from instrumentation point of view. It supports activities of engineering, procurement, construction, commissioning and maintenance.

Pre-Commissioning Essentials That Prevent Startup Failures: Instrumentation Pre-Commissioning Checklist and Guidelines

Instrument index Summary information about all instruments in a project. A loop diagram shows precise wiring and signal information for a given control loop.

A practical instrument index generator is not just a convenience tool. In EPC instrumentation engineering, it supports tag discipline, IO control, loop tracking, and project documentation quality from design through commissioning. The uploaded tool brings together the core functions that engineers actually need, including data entry, search, deletion, clear all, CSV export, local storage, and built in statistics. It is especially useful when the project team needs a reliable instrument tag generator, an instrumentation project tool, or a simple CSV instrument list tool for day to day use. For better project control, every instrument index should be accurate, unique, verified, and aligned with the latest control system scope.

Control Valve Flow Characteristic Calculator: Linear, Equal Percentage, and Quick Opening Guide

0
Control Valve Flow Characteristic Calculator: Linear, Equal Percentage, and Quick Opening Guide
Table of Contents
Compact Control Valve Flow Characteristic Calculator

Control Valve Flow Characteristic Calculator

Linear • Equal Percentage • Quick Opening

Calculator

Results

Flow Rate

0.00

Flow %

0%

Factor

0

Type

Status

Applications

CharacteristicApplication
LinearLevel & Flow Control
Equal PercentagePressure & Temperature
Quick OpeningOn-Off & Safety Service

Formulas

Linear: Q = Qmax × x


Equal Percentage: Q = Qmax × ((e^(4x)-1)/(e⁴-1))


Quick Opening: Q = Qmax × √x

Standards

  • IEC 60534
  • ISA 75
  • ANSI/ISA Standards
  • ISO Process Control Guidelines

Engineering Notes

  • Installed and inherent characteristics differ.
  • Pressure drop affects actual flow.
  • Rangeability impacts low-flow control.
  • Trim design affects valve performance.

A Control Valve Flow Characteristic Calculator is one of the most useful learning and troubleshooting tools in instrumentation engineering because it connects valve opening to actual flow behavior in a simple way. In process control, the relationship between stem position and flow is not just a theory. It affects loop stability, controller tuning, valve sizing, rangeability, and overall plant performance. The uploaded calculator includes the three most common characteristics, Linear, Equal Percentage, and Quick Opening, and it also displays flow rate, flow percentage, factor, type, and status, making it a practical engineering aid for both students and working professionals.

When the wrong valve characteristic is selected, the loop may become unstable, the valve may hunt, or the process may respond too aggressively at one part of travel and too slowly at another. That is why understanding control valve characteristics is essential for flow control, pressure control, temperature control, and utility service applications.

This article explains how the calculator works, how each valve characteristic behaves, how to interpret the results, and how to relate the output to real plant conditions. It also connects the calculator to IEC 60534 control valve guidance, ISA 75 valve standards, and practical control valve sizing considerations.

Master Accurate Cv Calculations Before Costly Design Mistakes: Control Valve Sizing Calculator: Complete ISA S75.01 Cv Calculation Guide for Instrumentation Engineers

A control valve flow characteristic describes how flow changes as the valve opening changes. In simple terms, it tells you how much flow you get at 10 percent, 50 percent, or 80 percent valve travel.

There are two important views of valve behavior:

Inherent characteristic
This is the valve’s ideal flow behavior under constant pressure drop across the valve.

Installed characteristic

This is the actual behavior in the plant, where pipe friction, upstream pressure changes, downstream load, and process conditions all influence performance.

Avoid Sizing Errors That Cause Control Problems: Understanding Rangeability vs Turndown Ratio in Control Valve Sizing

The calculator in the uploaded file lets the user choose a valve characteristic, enter the valve opening percentage, enter maximum flow rate, and choose engineering units such as m³/h, GPM, LPM, or Cv equivalent. It then calculates flow rate, flow percentage, factor, characteristic type, and status. The file also includes sample loading, reset, print support, application guidance, formulas, and standards references.

InputMeaning
Valve Characteristic SelectionChooses Linear, Equal Percentage, or Quick Opening
Valve Opening PercentageStem travel from 0 to 100 percent
Maximum Flow RateThe full capacity value used for estimation
Engineering UnitsThe display unit for the calculated flow
OutputMeaning
Flow RateEstimated flow at the chosen opening
Flow PercentageFlow as a percentage of maximum
Flow FactorFraction of maximum flow
Characteristic TypeThe selected characteristic
Flow StatusA simple interpretation such as low, moderate, or maximum

This makes the tool useful not only for quick control valve flow calculation, but also for training and preliminary engineering checks.

Convert Gas Flow Parameters Faster With Proven Methods: Cv to Cg for Gases Conversion Calculator: Control Valve Sizing

Understanding Linear Valve Characteristics

A linear valve characteristic means flow increases in direct proportion to valve opening. If the valve is 50 percent open , the flow will be about 50 percent of maximum , assuming a steady pressure decrease .

Q = Qmax × x

Where:

Q = actual flow
Qmax = maximum flow
x = valve opening fraction, for example 0.65 for 65 percent

Linear valves have a uniform flow response over the whole trip range. Each percent of opening adds about the same amount of flow.

They are easy to understand, easy to calculate, and useful when process demand changes fairly uniformly.

They may not give the best controllability in systems where pressure drop varies widely.

Linear characteristics are often used in:

ApplicationWhy It Works
Flow control loopsDirect relationship between travel and flow
Level control systemsStable proportional response
Water treatment plantsPredictable service behavior
Utility servicesSimple operating behavior

Practical Example

If a linear valve is rated for 250 m³/h and opened to 65 percent, the flow estimate is about 162.5 m³/h. That is easy to interpret, which is why many engineers use linear behavior as a teaching baseline.

Understanding Equal Percentage Valve Characteristics

An equal percentage valve characteristic means each equal increment of stem travel produces an equal percentage increase in flow. The flow increase is small at low openings and much larger at higher openings.

A common simplified form used in calculators is:

Q = Qmax × ((e^(4x) - 1) / (e^4 - 1))

This is a practical approximation for learning and estimation.

At low openings, the valve is very gentle. At mid travel, the flow begins to rise more noticeably. At higher openings, the valve becomes much more responsive.

Equal percentage trim is often preferred because process conditions in real plants are not constant. Pressure drop changes, load changes, and supply variation are common. Equal percentage trims ensure practical control over a large working range.

They offer excellent rangeability, better low flow control, and strong real plant adaptability.

They are not always ideal for simple on off duty or for systems that need a direct one to one relationship between movement and flow.

ApplicationWhy It Works
Temperature controlSmooth response across changing loads
Pressure controlBetter handling of varying pressure drop
Steam controlStable behavior under wide operating conditions
Heat exchangersUseful with changing thermal demand
Process plantsStrong control over variable service

Practical Example

A 65 percent open equal percentage valve may still deliver less flow than a linear valve at the same opening, but its real value appears when the system pressure drop changes. That is why equal percentage is often the preferred choice in temperature and pressure loops.

Challenge Your Skills With Advanced Hunting Diagnostics: Advanced Control Valve Hunting Troubleshooting Quiz – Test Your Control Loop Expertise

Understanding Quick Opening Valve Characteristics

A quick opening valve characteristic gives a large flow increase at the first part of valve travel. After that, additional opening creates a smaller relative change in flow.

Quick opening valves are aggressive near the closed position. They are designed to deliver high flow quickly.

They provide fast response and are excellent for isolation or emergency use.

They are usually too aggressive for fine control. Small travel changes can create large process changes.

ApplicationWhy It Works
Emergency shutdown systemsRapid opening when needed
Safety functionsFast delivery of flow
On off controlClear open or closed service
Relief servicesImmediate flow response

Practical Example

A quick opening valve is not usually the first choice for tight process control. It is more suitable when the goal is to move a large amount of flow quickly rather than regulate it precisely.

Positioner Faults Secretly Destroying Control Valve Performance: Control Valve Hunting due to Valve Positioner: Troubleshooting

Control Valve Flow Characteristic Formulas Explained

The calculator uses simple engineering formulas to estimate flow behavior.

Q = Qmax × x

If maximum flow is 250 m³/h and opening is 65 percent:

Q = 250 × 0.65 = 162.5 m³/h

Q = Qmax × ((e^(4x) - 1) / (e^4 - 1))

Using the same 65 percent opening:

x = 0.65

This gives a lower flow than linear at the same travel in the simplified model, which matches the gentler low travel behavior of equal percentage trim.

Q = Qmax × √x

At 65 percent opening:

Q = 250 × √0.65 ≈ 201.56 m³/h

This shows why quick opening valves respond strongly in the early part of the travel range.

SymbolMeaning
QActual flow
QmaxMaximum flow
xOpening fraction from 0 to 1

Most Overlooked Reasons Behind Persistent Valve Oscillations: What are the main causes of control valve hunting?

Control Valve Characteristic Comparison Table
CharacteristicFlow ResponseControllabilityRangeabilityTypical ApplicationsAdvantagesLimitationsRecommended Services
LinearDirect proportional responseGood in stable systemsModerateFlow loops, level loops, utilitiesEasy to understandLess flexible with changing pressure dropConstant or nearly constant load
Equal PercentageSmall at low travel, large at high travelExcellent in real plantsHighTemperature, pressure, steam, heat exchangersBest all round process adaptabilityLess intuitiveVariable pressure drop service
Quick OpeningLarge early flow increasePoor for fine controlLowShutdown, safety, on off serviceVery fast responseCan be too aggressiveNon modulating duties

Critical Anti-Surge Valve Decisions Every Engineer Must Know: Anti-Surge Control Valve Selection and Sizing – Complete Engineering Guide

The uploaded calculator includes a sample mode with:

Maximum Flow = 250 m³/h
Valve Opening = 65 percent
Characteristic = Equal Percentage.

Results

The comparison shows why valve characteristic selection matters. A linear valve gives a straightforward result. A quick opening valve responds very aggressively. An equal percentage valve gives more refined control in a real process where pressure drop and load are not constant.

EPC Engineers: Avoid These ON-OFF Valve Selection Mistakes: ON OFF Control Valve Type Selection Procedure for EPC Engineering

Installed Characteristic vs Inherent Characteristic

The inherent characteristic is what the valve does on a test bench under constant pressure drop. The installed characteristic is what the plant actually sees.

A valve that looks perfect on paper may behave differently in the plant. That is why control valve sizing and system analysis are just as important as characteristic selection.

Prevent Material Selection Errors Before Project Execution: Control Valve Body Material Selection Guide for EPC Design Instrumentation Engineers

Several variables affect real valve behavior.

FactorImpact
Pressure dropChanges actual flow capacity
Valve sizingToo large or too small affects control quality
Valve authorityLow authority reduces controllability
RangeabilityLimits stable control at low flow
CavitationDamages trim and changes performance
FlashingReduces usable pressure drop
Trim designShapes flow behavior and noise
Actuator performanceAffects travel speed and force
Positioner accuracyImproves repeatability and response

In practice, the best valve characteristic still fails if sizing, trim selection, or actuator setup is poor.

  • IEC 60534: IEC 60534 is a key standard family for industrial process control valves. It helps guide sizing, testing, performance, and terminology.
  • ISA 75: ISA 75 is widely used in the control valve industry, especially for sizing and performance guidance.
  • ANSI ISA Standards: These standards support consistent engineering practice across vendors and plants.
  • ISO Process Control Guidelines: ISO guidance supports broader process instrumentation and quality practice.

Why are these standards important? They allow engineers to compare valves, validate sizing procedures, and choose trim behavior with accepted industry practice.

Stop Guessing Valve Sizes - Use Industry-Proven Tools: Top 10 Control Valve Sizing Software Used in Process Industries

MistakeWhy It Causes ProblemsHow to Avoid It
Choosing based only on catalog habitThe process may need a different responseMatch characteristic to process duty
Ignoring valve authorityPoor loop control and instabilityCheck pressure drop distribution
Oversizing the valvePoor resolution at low travelSize properly using process data
Undersizing the valveValve runs near full open too oftenConfirm maximum demand
Using quick opening for modulationCauses hunting and overshootReserve it for on off duties
Forgetting installed characteristicReal plant differs from test benchReview actual system pressure drop
Neglecting rangeabilityWeak low flow controlSelect trim suitable for operating range
Ignoring cavitation riskTrim damage and unstable flowEvaluate pressure recovery
Not considering actuator speedSluggish response or overshootMatch actuator to loop needs
Skipping positioner checksPoor travel accuracyCalibrate and verify positioner performance

Test Your Expertise With These Essential Valve MCQs: Top 25 MCQs on Control Valve Types, Selection, and Applications for Project Engineers

A control valve flow rate calculator is useful because it gives quick answers that support engineering decisions.

BenefitValue
Faster engineering decisionsHelps compare characteristic options quickly
Better troubleshootingShows whether the valve response looks reasonable
Training and learningHelps students understand valve behavior visually
Preliminary valve analysisUseful before detailed sizing
Process optimizationSupports better control loop setup


The calculator is especially valuable when explaining flow control valve performance to junior engineers, operators, or maintenance teams.

Industry Standards Every Control Valve Engineer Should Understand: Codes and Standards for Control Valve Selection in Industrial Applications

ServiceBest CharacteristicReason
Flow controlLinear or equal percentageDepends on pressure stability
Temperature controlEqual percentageHandles load changes well
Pressure controlEqual percentageBetter across varying pressure drop
Level controlLinearStraightforward response
On off serviceQuick openingFast response
Steam serviceEqual percentageStrong controllability
Opening PercentLinearEqual PercentageQuick Opening
10 percentLow and proportionalVery lowHigh relative early response
50 percentMid rangeModerateStrong response
65 percent65 percent of maxDepends on formula and real trimHigher than linear in early travel
90 percentNear maximumRapid increaseNear full capacity

The Engineering Principle That Improves Control Performance: Why Control Valve Characteristics Matter in EPC Instrumentation and Control Engineering

It is the relationship between valve travel and flow rate.
It indicates flow change as you open the valve.

There is no one optimal choice for all applications.

Equal % is frequently preferable for process control. Linear is good for stable services.

It is effective for the time varying pressure drop and process load.

This offers superior control across a wide working range.

This is the range in which the valve can efficiently control the flow.

Improved rangeability provides improved control at low and high flow.

More opening usually means more flow.
The exact change depends on the valve characteristic.

It is the proportion of total system pressure drop across the control valve.
Higher authority usually gives better control and stability.

Inherent characteristic is the ideal bench behavior of the valve.
Installed characteristic is the real behavior inside the plant system.

Yes, the wrong characteristic can cause poor tuning, hunting, and oscillation.
Proper selection enhances loop response and quality of control.

Typical reasons are oversizing, poor characteristic selection, low authority and poor tuning.

Problems with the actuator or positioner may potentially be a factor.

They help in estimation, learning and fast comparison.

 Proper engineering approaches and process data should still be applied to final sizing.

Common characteristics are linear, equal percentage, and quick opening.
Each one gives a different flow response as the valve opens.

It is a valve designed to follow a specific flow-opening curve.
That helps match the valve to the process requirement.

The main characteristics are linear, equal percentage, and quick opening.

Some applications may also use modified or custom characteristics.

Select based on process behavior, pressure drop variation, and control objective.
Equal percentage is common for variable loads, while linear fits stable systems.

Types of valves commonly used are check, gate, globe, ball, butterfly, plug and diaphragm valves.

These are used for isolation, regulation and non return responsibilities.

This is a 3 port valve used for mixing or directing flow.

It is frequently used for temperature control and bypass applications.

There are three basic flow characteristics – linear, equal proportion and rapid opening.

These are the flow features with valve travel.

The right characteristic enhances the control precision and process stability.

A bad choice can lead to hunting, overshoot and poor performance.

Generally, same proportion is used for temperature control applications.

It performs well under shifting load and pressure circumstances during the process.

Linear valves are commonly employed in situations where the pressure decrease is relatively constant.

A fast opening characteristic gives considerable increases in flow at small valve lifts.

It is often utilized for on-off service and emergency applications.

A linear characteristic means that the flow changes directly according to the valve movement.

The flow increases by roughly the same amount with each additional trip.

An equal percentage characteristic gives equal percentage increases in flow for equal increments of trip.

That gives a good controllability over a big operation range.

Yes you can change the valve trim or characterisation to change the flow behavior.

The procedure depends on valve design and application needs.

Eliminate Power Supply Sizing Errors With Confidence: Instrument Power Supply Load Calculator: 7 Critical Steps for Accurate 24VDC Power Supply Sizing

  • The Control Valve Flow Characteristic Calculator is a practical tool for understanding how valve travel affects flow.
  • Linear valves give direct proportional flow behavior.
  • Equal percentage valves give the best all round real plant controllability.
  • Quick opening valves are ideal for fast on off or safety service.
  • Installed performance is often different from inherent performance because of pressure drop, valve authority, and system effects.
  • Correct valve characteristic selection improves flow control, stability, and overall process performance.
  • For final design, always combine calculator results with proper control valve sizing and standards based engineering review.

Troubleshooting Coriolis Flowmeter in Process Industries Advanced Quiz for Instrumentation Engineers

0
Troubleshooting Coriolis Flowmeter in Process Industries Advanced Quiz for Instrumentation Engineers

Troubleshooting a Coriolis flowmeter in process industries is rarely about one fault alone. Most wrong readings come from installation issues, process condition changes, entrained gas, vibration, zero drift, poor grounding, or transmitter configuration errors. In refineries, chemical plants, food units, and utilities, a Coriolis mass flow meter can look healthy while giving bad mass flow, density error, or unstable output. Engineers need sharp troubleshooting logic that separates real process behavior from instrument faults, so they can restore accuracy, protect control loops, and avoid costly downtime during commissioning, maintenance, and verification work in demanding process operations.

Troubleshooting Coriolis Flowmeter in Process Industries Advanced Quiz for Instrumentation Engineers

Troubleshooting Coriolis Flowmeter in Process Industries Advanced Quiz for Instrumentation Engineers

Test Your Instrumentation Troubleshooting Skills with Practical Field Based Coriolis Flowmeter Problems 

Test your troubleshooting logic with real plant situations. Each question mirrors Coriolis flowmeter cases from field work, from zero drift and vibration to gas entrainment, wiring faults, and scaling mistakes. Choose carefully, because the wrong clue can send even experienced engineers down the wrong path. Read the process symptoms, not just the display, and decide what the meter is really telling you.

1 / 25

During commissioning, the meter passes a loop check, but the process value still does not match the mass balance after startup. What is the most professional next step?


2 / 25

A Coriolis meter on a batch skid is accurate at low flow but becomes erratic at peak demand. The line is long and the pump is oversized. What is the likely cause?


3 / 25

 An engineer notes that a meter gives normal mass flow, but the zero shifts every time the nearby reciprocating compressor starts. What is the best corrective action?


4 / 25

After a long shutdown, the meter reads zero flow but the line still contains stagnant liquid. The piping is cold and partially drained. What is the most likely reason for the reading?


5 / 25

A transmitter reports normal mass flow, but density is completely unrealistic after a new product grade change. Which setting should be checked first?

6 / 25

A slurry service meter shows increasing error over several weeks, but cleaning the pipe restores normal reading. What is the underlying cause?


7 / 25

In a power plant utility line, the meter output oscillates around the setpoint and the controller hunts. The transmitter diagnostics are clear. What should the engineer suspect?


8 / 25

 A meter that was verified last month now shows a steady low bias during routine operation. The process and wiring look normal. What is the best next step?


9 / 25

A Coriolis meter reads fine locally, but remote HART communication fails after a junction box repair. What should be checked first?


10 / 25

On a solvent line, the meter reads high during intermittent pump cavitation events. What is the strongest diagnostic clue?


11 / 25

A maintenance team replaces the transmitter, but the same zero drift returns after a week. What does this suggest?


12 / 25

The output becomes erratic only when a control valve throttles hard upstream of the meter. What is the most likely process cause?


13 / 25

A Coriolis meter on a food plant mixing line repeatedly reports empty pipe even though the vessel level is adequate. The line contains a long vertical rise. What is the most likely issue?


14 / 25

 An engineer zeros a meter while the line is warm, moving slowly, and not fully isolated. The next day the meter shows a small but stable offset. What mistake was made?


15 / 25

A Coriolis meter in a batch blend gives a density error only when the line pressure rises above a certain point. What is the best investigation?


16 / 25

The transmitter shows correct local display values, but the distributed control system receives a flat 4 to 20 mA signal at one value. What is the most likely fault area?


17 / 25

A meter in a hot oil line reads higher than expected immediately after startup, then stabilizes later. The process pressure is normal. What explains this behavior best?


18 / 25

A Coriolis flowmeter on syrup service is reading low, but the plant laboratory sample confirms the product density is normal. What should the engineer examine next?


19 / 25

The control room sees correct flow for hours, then sudden spikes appear when a nearby variable speed drive ramps up. Which action is most relevant?


20 / 25

A Coriolis meter installed after a pump discharge elbow develops frequent output noise after a maintenance crew replaced the pipe supports. What is the best interpretation?


21 / 25

The measured flow is higher than the tanker receipt value by a consistent margin, but the meter passes a dry electronics check. What is a common field cause?


22 / 25

A meter on a chemical transfer skid gives unstable mass flow and random density jumps whenever a nearby agitator starts. What is the most likely external influence?


23 / 25

During commissioning, a Coriolis flowmeter shows a positive zero offset whenever the line is shut and full. What should the engineer check first?


24 / 25

A liquid service meter suddenly reads much lower than expected after a suction line maintenance job. The product is foaming slightly and the pump is on a high suction lift. What is the most likely cause?


25 / 25

A Coriolis meter on transfer duty shows zero flow even when the pump is running and the line is fully open. The transmitter is healthy, the output is steady, and no alarm is active. What is the best first suspicion?

Your score is

The average score is 68%

0%

Access 1000+ MCQs tailored for instrumentation engineers: Instrumentation and Process Control Quiz Hub – 1000+ MCQs for Engineers

#CoriolisFlowmeter #FlowmeterTroubleshooting #InstrumentationEngineering #ProcessIndustries #IndustrialAutomation #MassFlowMeter #ZeroDrift #DensityError #EntrainedAir #ControlEngineering #ProcessControl #InstrumentationQuiz #FlowMeasurement #Calibration #Commissioning #MaintenanceEngineering #IndustrialInstrumentation #ProcessPlant #AutomationEngineers #TroubleshootingQuiz #FieldInstrumentation #ProcessEngineering #IndustrialDiagnostics #InstrumentationTools #EngineeringQuiz

Calibration Interval Risk Calculator for Industrial Instrument Calibration Planning

0
Calibration Interval Risk Calculator for Industrial Instrument Calibration Planning
Table of Contents
Calibration Interval Risk Calculator
AutomationForum.co

Calibration Interval Risk Calculator

Risk based calibration interval planner using ISO IEC 17025 concepts, NIST traceability practices, drift analysis, environmental severity, and process criticality scoring.

Instrument Inputs

Enter process and calibration details to estimate a suitable interval.
1 Low Impact • 5 Safety Critical

Calibration Result

0 /100 Risk Score
Low Risk
Recommended Interval
12.0 mo
Next Calibration Date
Risk Band
Drift Limit
Selected Basis
Criticality
0
Consequence
0
Environment
0
History
0

A calibration schedule should never be based only on habit. In many plants, instruments are still placed on a fixed 12 month cycle even when the device is stable, the process is non critical, and the historical drift data supports a longer interval. In other cases, the same 12 month schedule is used for highly critical safety instruments that should be reviewed much more frequently. That approach is simple, but it is not always technically justified.

This calculator is not just a date planner. It is a decision support tool for calibration management.

It helps answer a practical question that every plant faces. How often should this instrument really be calibrated?

Instead of treating every instrument the same, the calculator weighs the actual service conditions. A pressure transmitter on a clean utility line does not carry the same risk as a pressure transmitter protecting a reactor or a safety instrumented system. A flow meter in custody transfer does not behave the same way as a simple indication device. A gas analyzer in emissions monitoring may need tighter oversight because drift and compliance risk are more serious. The calculator reflects those real differences in a structured way.

Audit Your Calibration Program Before Compliance Fails: Internal Audit Checklist for ISO Process Instrument Calibration in Process Industries

Calibration Interval Risk Calculator for Industrial Instrument Calibration Planning- Why Calibration Interval Planning Matters in Industrial Instrument Calibration

Calibration interval planning matters because instruments do not stay perfect forever. They drift over time. That drift can come from process conditions, vibration, corrosion, temperature swings, humidity, wear, contamination, electronics aging, and mechanical stress.

When a device drifts beyond its permissible tolerance, the whole measurement chain becomes less trustworthy. That can affect product quality, energy usage, batch consistency, emissions control, process safety, maintenance decisions, and audit readiness.

A fixed interval may look neat on paper, but it does not reflect the actual condition of the instrument. A stable device may not need early replacement or frequent recalibration. A harsh service device may need more attention than the calendar suggests. That is why modern calibration programs are moving toward evidence based interval determination and historical performance review.

Stop Guessing: Know Calibration Versus Verification Fast: Calibration Vs Verification: Key Differences, Procedures, Examples and Best Practices In Process Industries

The instrument tag is the identity of the device in your maintenance and calibration system. Tags such as PT 101, TT 201, and FT 305 support traceability, work order control, and historical record keeping.

A unique tag helps you connect the device to its as found data, as left data, drift trend, failure history, and next due date. Without a proper tag, calibration history becomes fragmented and interval decisions become weak.

Different instrument technologies behave differently in service.

A pressure transmitter may drift because of diaphragm stress, process impulse line issues, or sensor aging. A temperature transmitter can be quite stable for a long time. However, wiring, thermowell response and sensor deterioration might impact performance. If the application is for custody transfer or process balance, then a flow meter may require more attention. A gas analyzer often needs closer control because sample handling, contamination, and environmental changes can influence readings. A valve positioner may be exposed to air supply quality, friction, and mechanical wear.

Because each technology has a different failure pattern, calibration intervals should be based on actual behavior, not only on the device category.

The manufacturer interval is a starting point, not the final answer.

Vendors often recommend an interval that is safe for a broad range of users. That recommendation is useful when you have limited historical data. It gives you an initial baseline. But once you have enough records, you should compare the vendor suggestion with field performance, drift trend, environment, and process risk.

A stable transmitter may justify extending beyond the initial vendor interval. A critical device in demanding service may need a shorter interval than the vendor default.

Protect Accuracy by Calibrating Calibrators the Right Way: Why Calibrating your Calibrators is Critically Important: Accuracy, Compliance and ISO 17025 and NIST Traceability

The last calibration date supports due date calculation and compliance tracking.

It allows you to determine the next calibration date, schedule work orders and avoid missed calibrations. It also gives auditors a clear record of the calibration cycle. Good calibration management depends on accurate date history, because interval decisions become much stronger when the last service date is known with confidence.

Process criticality tells you how important the measurement is to the plant.

A low criticality device may only provide general indication. A high criticality device may directly affect shutdown logic, control stability, product quality, or operator safety.

A good way to think about it is simple. If the instrument fails, does the plant merely lose a convenient display, or does it risk production loss, environmental release, or unsafe operation? The more serious the answer, the higher the criticality score should be.

The consequence of failure measures the real business and safety impact if the instrument becomes inaccurate or fails.

Some failures only create small operating inconvenience. Others can cause batch loss, off spec production, environmental harm, shutdowns, regulatory issues, or safety incidents. That is why the same instrument technology can have very different calibration needs depending on where it is used.

A transmitter in a utility line may tolerate a wider interval than the same model in a critical reactor or emissions service.

Environmental severity is one of the strongest interval drivers.

Harsh temperatures, humidity, vibration, dust, corrosive atmosphere, and hazardous area conditions all increase the chance of drift or failure. The calculator correctly treats environment as a major factor because field conditions often shorten the useful calibration interval more than the vendor brochure suggests.

An instrument in a clean control room may remain stable for a long time. An instrument mounted outdoors in a corrosive coastal plant may not.

Avoid Costly Re-ranging Mistakes in Instrument Loops: Why Calibration Isn’t the Same as Re-ranging in Process Instrumentation

Historical stability is where calibration planning becomes evidence based.

If past calibration records show that the instrument repeatedly stays within tolerance, then the interval may be extended with confidence. If records show frequent failure, excessive drift, or repeated adjustment, the interval should be reviewed and possibly shortened.

This is where as found data becomes extremely valuable. It shows what the instrument looked like before adjustment, and that is often more meaningful than the final pass result.

Drift is the slow movement of an instrument reading away from the true value over time.

A pressure transmitter might drift by a small amount each month. A temperature transmitter may show minimal drift for long periods and then move after repeated thermal cycling. A gas analyzer may drift due to sample contamination or sensor degradation. The key point is that drift rate helps predict when the instrument may leave its acceptable band.

If drift is high, the calibration interval should generally be shorter.

Permissible tolerance is the amount of error you can accept before the measurement is no longer fit for use.

This is the line between acceptable performance and unacceptable performance. A device with a narrow tolerance needs closer control than a device with a wide tolerance. The calculator uses tolerance together with drift rate to estimate how long the device can stay in service before it is likely to go out of limits.

Eliminate the Most Dangerous Calibration Errors Now: Top 15 Common Calibration Mistakes in Industrial Instruments

ISO IEC 17025 is important because it emphasizes competence, traceability, documentation, and evidence based control of calibration activities.

In practice, this means your calibration interval should not be a guess. It should be justified through technical evidence, historical data, and periodic review. The calculator supports that mindset by turning calibration history and risk factors into a more structured decision.

Traceability connects the instrument under test to recognized reference standards through an unbroken calibration chain.

In simple terms, your calibration result should be traceable back through the standards hierarchy. That strengthens audit readiness and measurement confidence. NIST traceability does not mean every instrument must be calibrated at the same fixed interval. Instead, interval choice should reflect stability, usage, and risk. That is why traceability and interval planning should work together, not separately.

Safety instrumented service usually needs tighter calibration control.

Upgrade Your Calibration Knowledge With These Proven Guidelines: Calibration Guidelines

Calibration Interval Risk Calculator for Industrial Instrument Calibration Planning - How the Calibration Risk Score Works

The calculator builds a risk score from the most important field and compliance factors.

The logic gives major weight to process criticality and consequence of failure because these two inputs describe the business and safety impact of error. Environmental severity matters because harsh service accelerates wear and drift. Historical stability matters because the past often predicts the future. Drift ratio matters because it directly shows how quickly the instrument may leave tolerance.

The calculator also adds extra concern when the instrument is part of safety instrumented service. That makes sense because safety critical equipment should be treated more conservatively.

In practical terms, the score is not just a number. It is a summary of how much confidence you should have in the current interval.

Get PLC Raw Count Calculations Right Every Time: PLC Raw Count Calculator: Comparison with PLC Internal Scaling Blocks, Real-World Use Cases and Practical Benefits

A calibration risk score should lead to a clear action, not confusion.

Low risk means the current interval may be extended if other evidence supports it. Moderate risk means the current interval is probably still acceptable. The higher the risk, the shorter the interval or the closer to follow up. High risk means a significant reduction is usually justified. Critical risk means the interval requires immediate review.

The intent is simple. High risk instruments should not share the same schedule as stable low risk devices.

Size PLC Power Supplies With Zero Margin Errors: PLC Power Supply Calculator – Complete Guide for Accurate PLC Power Sizing

Calibration Interval Risk Calculator for Industrial Instrument Calibration Planning - How Drift Limit Is Calculated in Calibration Interval Planning

The drift limit is one of the most useful outputs in the calculator.

The logic is straightforward. Drift limit equals tolerance divided by drift rate.

This tells you how many months the instrument may remain in service before it is likely to exceed its allowed error band. A low drift rate with a wide tolerance may support a long interval. A high drift rate with a tight tolerance may demand a much shorter interval.

For example, if tolerance is 0.500 and drift rate is 0.020 per month, the drift limit is 25 months. That does not automatically mean the calibration interval must be 25 months, but it does show that the device has a relatively comfortable margin before it exceeds tolerance. The final interval still depends on criticality, environment, and compliance needs.

Catch Instrument Calibration Errors Before They Spread: Calibration Error Calculator for Instruments 

A pressure transmitter used in utility service is usually a good example of a stable and low impact instrument. In many plants, this type of device is used for general monitoring, utility line indication, or non critical control loops where a small measurement shift does not create major production or safety problems. Because the process importance is moderate and the environment is often relatively controlled, the overall risk is usually not very high.

If the transmitter has shown stable calibration history with little drift over several cycles, the calculator may support keeping the interval at 12 months or even extending it slightly. In many cases, this becomes a strong candidate for interval optimization because the instrument is not exposed to severe process stress and does not carry a high consequence of failure. For maintenance teams, this means calibration effort can be focused on more critical devices without losing confidence in this transmitter.

Use ISO-Aligned Flow Calibration Procedures That Hold Up: ISO Standard Calibration Procedures for Flow Measuring Instruments

Calibration Interval Risk Calculator for Industrial Instrument Calibration Planning - Safety Critical Pressure Transmitter

A pressure transmitter used in a safety critical application must be treated very differently from a standard utility instrument. This type of device may be part of an alarm system, interlock, shutdown function, or safety instrumented service. In such cases, even a small error can have serious consequences because the instrument is directly linked to plant protection.

Even when the transmitter has a good drift history, the safety role increases the risk score because the acceptable level of uncertainty is much lower. If the device is installed in a harsh area with vibration, temperature cycling, or corrosive conditions, the need for a shorter calibration interval becomes even stronger. In practical terms, this is not the kind of instrument where interval extension should be done casually. The final decision should always be supported by field evidence, risk review, and compliance requirements.

Verify Calibration Results With Confidence and Speed: Instrument Calibration Verification Calculator 

A flow meter in custody transfer service is one of the most important examples in calibration planning because the measurement directly affects financial transactions. If the meter reads incorrectly, one party may lose product value while the other may receive inaccurate billing or accounting data. That makes both the consequence of failure and the process criticality very high.

For this reason, the calibration interval often needs to be tighter than a general service meter. Even small drift or bias can create unacceptable financial error. Audit expectations are also usually stricter because the measurement must be defensible and traceable. If the historical records show excellent stability, the interval may still be optimized, but only with strong technical justification and clear documentation. This is a strong example of why risk based calibration is more effective than applying a standard annual cycle to every meter.

Find the Exact Test Points You Need: Online Calibration Test Points Value Calculator 

A temperature transmitter in a reactor service is often a highly important control device because temperature has a direct effect on reaction rate, product quality, and process safety. In many cases, the transmitter output may influence control loops, alarms, or operating decisions. That means even a small amount of drift can create a large process impact.

If the transmitter starts reading higher or lower than the actual process temperature, the reactor may move away from its intended operating condition. This can lead to poor product quality, unstable operation, or unsafe process behavior. Because of that, calibration planning for this device should not rely only on the manufacturer recommendation. The engineer should also consider the historical drift pattern, the sensitivity of the process, and the consequences of a wrong reading. A reactor temperature transmitter is a good example of how process importance can justify a shorter and more carefully reviewed calibration interval.

Measure Instrument Accuracy Like a Pro Today: Instrument Accuracy Calculator 

A gas analyzer used in emissions monitoring often requires special attention because it is affected not only by instrument drift but also by sample quality, contamination, sensor condition, and environmental effects. If the analyzer gives inaccurate results, the organization may face compliance issues, reporting errors, or environmental risk. In many cases, regulatory responsibility makes this type of instrument more sensitive than a standard process measurement device.

Because of this, the calibration interval should be based on both technical stability and the cost of inaccurate reporting. If the analyzer has stable historical records and consistent as found results, a modest extension may be possible. However, that decision must be supported by strong evidence, proper review, and documented justification. For emissions servicing the primary issue is not only to maintain the analyzer running, but also to ensure the reported values are trustworthy for compliance and operational choices.

Re-range DP Flow Transmitters Without Risky Guesswork: DP Flow Transmitter Re-Ranging Calculator 

  • The best calibration programs do not blindly shorten every interval. They optimize.
  • That means extending intervals where the evidence supports it and shortening them where the risk is real. 
  • A well managed program reduces unnecessary calibration cost while improving trust in important measurements. It also helps avoid over calibration, which consumes labor and may introduce handling error without improving reliability.
  • The smartest approach is to review records regularly and adjust intervals only when the evidence is strong.

Calculate Differential Pressure Flow Output the Smart Way: Differential pressure Flow Transmitter Output Calculator 

  • One of the biggest mistakes is using 12 months for everything.
  • Another mistake is ignoring drift history. Historical behavior should guide future planning. Ignoring environmental severity is also risky because field conditions can shorten interval life dramatically. Poor records make good decisions impossible. No risk assessment means the interval is only a guess. Extending intervals without evidence can create hidden error. And ignoring safety critical devices is never acceptable.
  • A good calibration program avoids these mistakes by using records, risk, and technical judgment together.

Lock In a Better Weighing Calibration Process: Weighing System Calibration Procedure

Engineers should use this calculator whenever they need to establish, review, justify, or optimize calibration intervals for industrial instruments. It is particularly useful when moving from fixed calendar based calibration schedules to a risk based calibration strategy.

This calculator can be used during:

  • Calibration interval reviews
  • ISO 17025 audits
  • Reliability improvement programs
  • Instrument maintenance planning
  • Turnaround preparation
  • Safety instrument assessments
  • Calibration cost reduction initiatives
  • Instrument lifecycle management

This tool helps engineers make objective and data driven decisions rather than relying solely on historical practices.

Tighten Analytical Instrument Calibration With Expert Procedures: Analytical Instruments Calibration Procedures

Calibration Interval Risk Calculator for Industrial Instrument Calibration Planning - Calibration Interval Risk Calculator Inputs

The calculator evaluates several technical and operational factors that influence calibration frequency.

InputDescription
Instrument TagUnique instrument identification
Instrument TypeDevice category being evaluated
Manufacturer Recommended IntervalSuggested calibration period from vendor
Last Calibration DateMost recent calibration date
Process CriticalityImportance of the measurement
Consequence of FailureImpact of instrument failure
Environmental SeverityOperating environment conditions
Historical StabilityPrevious calibration performance
Observed Drift RateMeasured instrument drift
Permissible ToleranceMaximum allowable error
ISO IEC 17025 ContextCalibration quality requirements
NIST Traceability RequirementTraceability compliance needs
Safety Instrumented ServiceSafety related application status

Calibrate Control Valves Correctly and Avoid Downtime: Control Valve Calibration Procedures

After processing the entered data, the calculator generates several useful outputs.

OutputDescription
Risk ScoreOverall calibration risk value
Risk BandLow, Moderate, Elevated, High, or Critical
Recommended Calibration IntervalSuggested calibration frequency
Next Calibration DateEstimated next calibration due date
Drift LimitMaximum allowable operating period based on drift
Calibration BasisRisk based calibration justification

Follow Temperature Calibration Steps That Actually Work: Temperature Calibration Procedure

Many facilities continue to calibrate every instrument on a 12 month cycle regardless of service conditions, stability or criticality.

There are various benefits to a risk based approach:

  • Reduces unnecessary calibration
  • Maximizes maintenance resources
  • Improves the reliability of instruments
  • ISO 17025 compliance support
  • Increases confidence in measurement
  • Improves audit Preparedness
  • Lowers operating costs
  • Shifts focus to high risk assets

Nail Level Device Calibration With Fewer Failures: Calibration Procedures for Level Measurement Devices

This calculator helps organizations to establish a better approach to calibration management.

Benefits include:

  • Improved instrument dependability
  • Improved calibration planning
  • Lower maintenance expenses
  • Improved process safety
  • Improved Regulatory Compliance
  • Better audit preparations
  • Improved asset performance
  • Data-driven calibration choices
  • More accurate measurement
  • Optimised calibration tasks

Master Pressure Instrument Calibration With Proven Field Methods: Calibration Procedures for Various Pressure Measuring Instruments

The optimal calibration interval is the smallest time that will maintain the accuracy, reliability and compliance of the instrument without unnecessary maintenance effort. Depends on drift history , environment , criticality and consequence of failure .

The calibration interval is selected based on a review of manufacturer recommendations, previous stability, observed drift, severity of the environment and criticality of the process. The goal is to keep the instrument within the tolerances until the next calibration.

No, no annual calibration is required for each instrument from ISO IEC 17025. The interval needs to be justified by evidence, technical evaluation and continual monitoring.

If the instrument has a stable history, little drift and satisfactory performance in real use, calibration periods can be extended. Always justify your decision and do so on evidence.

Instrument drift can be caused by aging, vibration, temperature variations, humidity, corrosion, contamination, wear, electrical problems, and process stress. Harsh service conditions often accelerate drift.

Risk based calibration establishes the interval depending on the actual operational risk, not a predefined calendar rule. It takes into account importance, impact of failure, environment, stability and drift.

There is no interval for each pressure transmitter. Critical or safety service transmitters may need to be done more frequently, while stable utility service devices may live longer.

The frequency at which you test a flow meter will depend on the type of meter, the service conditions and the commercial implications of the error. Custody transfer or compliance applications generally require more stringent supervision than basic indication service.

NIST traceability means the measurement is linked through an unbroken calibration chain to recognized reference standards. It helps with accuracy, audit confidence and quality compliance.

Drift or danger of failure can be increased by harsh circumstances such as heat, humidity, vibration, dust and corrosion. Instruments used in extreme conditions frequently require more rigorous calibration assessment.

The historical stability indicates how the instrument has performed throughout time. If it stays within tolerance several times, the interval can be increased with confidence.

Drift is the variation of the instrument output with the time. Tolerance is the permitted error limit. If the drift exceeds the tolerance, the instrument is no longer acceptable.

Safety instruments should usually have shorter intervals because failure consequences are much higher. A conservative interval helps protect people, process, plant, and environment.

Yes, it can eliminate unnecessary calibrations by finding stable low risk instruments. It also helps to focus maintenance efforts on high risk devices that require more attention.

Calibration due date: The date on which the next calibration is scheduled. The standard calculation is to add the approved interval to the last date of calibration.

Calibration risk score indicates level of concern regarding the present interval. If the score is low, the interval may be safe; if it is excessive, it may need to be reduced.

18. Why is interval optimization better than fixed scheduling?

Interval optimization matches calibration effort to actual risk. It saves time on stable instruments and gives more attention to critical or unstable devices.

Click here for 200+ Online Instrumentation Calculators Collections 

Calibration interval planning should be evidence based, not habit based. The best interval is the one that reflects actual drift behavior, process risk, environmental severity, historical stability, tolerance, and compliance needs. That is exactly why the Calibration Interval Risk Calculator is valuable. It helps teams move away from one size fits all scheduling and toward a more reliable, auditable, and cost effective calibration strategy.

Tap the AutomationForum.co Calibration Interval Risk Calculator to develop data driven calibration schedules, eliminate wasteful calibration expenses, increase instrument dependability, support ISO 17025 compliance, and optimize maintenance plans across industrial sites.