- What is a Conductivity Cell Constant?
- How do you calibrate a conductivity meter with resistance?
- Purpose and Scope:
- Tools required for conductivity transmitter calibration:
- Safety
- How do you calibrate a conductivity transmitter?
- Calibration Setup
- Calibration principle
- Calibration procedure
- How do you calibrate a conductivity meter with resistance?
- How do you calculate conductivity resistance?
- What is the calibration factor for conductivity?
- Example calibration
- Recording calibration
- Completion of calibration
- Sample conductivity transmitter report
- Standards for Conductivity Transmitter Calibration
- Traceability of Calibration Standards
- Calibration Environment and Accuracy Considerations
What is a Conductivity Cell Constant?
The amount of current that a known volume of liquid can carry between two electrodes in order to determine conductivity. The volume between the two electrodes must be precise in order to calculate the amount of current that will pass through a “known amount of liquid”. The Cell Constant is the name given to this specific volume. A conductivity sensor-specific multiplier constant is known as the cell constant.

To calculate the electrical conductivity of the solution, multiply the measured current by the cell constant. The term “cell constant,” abbreviated “K,” describes a hypothetical electrode made up of two 1 cm square plates spaced 1 cm apart. The ratio between the distance between the electrode plates and the surface area of the plates is represented by the units of a cell constant, which are 1/cm (per centimeter).
How do you calibrate a conductivity meter with resistance?
Purpose and Scope:
The following procedure gives a detailed explanation of how to calibrate a conductivity transmitter in the process area, or analyzer room using decade resistance boxes.
Tools required for conductivity transmitter calibration:

- Necessary hand tools.
- Multimeter with mA option
- Decade resistance boxes
- Leads and probes.
- 475 field communicatorBeaker.
- Soft Cloth for cleaning.
- Reference manual
Safety
- For information on fundamental safety, general principles, and calibration operations in process industries, check out the link given below.
- Request that the operator of the SCADA/DCS panel configure the controller in manual mode for the conductivity transmitter control loop and MOS for the ESD loop.
- Find the conductivity transmitter you want to calibrate, double-check that it is the correct conductivity transmitter, and make a note of any important details, such as the tag number (for example, tag number, the manufacturer, model number, conductivity range, etc.).
- Switch off the power supply to the conductivity transmitter. Make sure that any nearby junction boxes in the analyzer room or marshalling panels close to the control room have their power sources turned off.(For instance, shut off the circuit breaker or unhook the cables).
- Keep in mind that depending on the particular conductivity transmitter and calibration place, this basic method may need to be modified. When working with conductivity transmitters or other process equipment, always adhere to any manufacturer’s instructions and local safety standards.
- In order to avoid an unauthorized start-up or usage of the conductivity transmitter, adhere to the necessary lockout/tagout protocols. Take care to keep the conductivity transmitter out of the way of the operation.
How do you calibrate a conductivity transmitter?
Calibration Setup

- The location of the calibration equipment must be free from electromagnetic interference and vibrations. The area must also be well-lit and ventilated.
- Collect all the tools,decade resistance boxes, and materials needed for the conductivity transmitter calibration.
- Use an instrument loop diagram and probes to create a series-connected analogue input loop to the multimeter (mA mode) between the junction box and the conductivity transmitter.
- The connections have been carried out and are currently being prepared for the conductivity transmitter’s calibration, as shown in the diagram.
Calibration principle
The calibration of a conductivity transmitter with a decade resistance box involves using a known resistance to simulate a known conductivity value and comparing the output of the transmitter to the expected value. The resistance value can be used to set the decade resistance box to simulate a specific conductivity value for calibration of the conductivity transmitter.
Calibration procedure
How do you calibrate a conductivity meter with resistance?
- Remove the sensor electrode from the sample line after closing the sample isolation valve.
- The instrument data sheet can be used to confirm a number of the parameters. The tag number, the LRV, and the URV are common characteristics of conductivity transmitters.

- Remove the conductivity transmitter terminal cover next, make a note of the connection between the conductivity sensor wires, and then disconnect the sensor wires to prepare a decade resistance box for simulation.
- Connect a decade resistance box for conductivity simulation and a second decade resistance box for temperature compensation simulation to the transmitter.
- For information on the working range and the resistance value for temperature adjustment, consult the instrument data sheet or instruction manual.
- Additionally, the transmitter and decade resistance box must be grounded in accordance with the diagram in the image.
- The decade resistance box for temperature correction simulates the operation of the PT100 RTD. It is necessary to consult the instrument handbook to determine the type of temperature sensor because it depends on the electrode manufacturer’s design.
- Turn on the conductivity transmitter’s power source as well as the multimeter and choose the mA mode.
- A reference of RTD resistance values at various temperatures may be found in the table below. These are used to test and figure out the sensor.
- The RTD resistance calculation formula can also be used to determine the below resistance value.
| Temperature (0 C) | Resistance(ohms) |
| 0 | 100.00 |
| 10 | 103.90 |
| 20 | 107.90 |
| 25 | 109.73 |
| 30 | 111.67 |
| 40 | 115.54 |
| 50 | 119.40 |
| 60 | 123.24 |
| 70 | 127.07 |
- Set the resistance to match the temperature at 25 degrees Celsius in the Decade resistance box.(109.73 ohms). This removes the condition of temperature.
- Calculate the simulation resistor needed to represent a value inside the given cell range.
- The following equation can be used to calculate the needed simulation resistance:
How do you calculate conductivity resistance?
Simulation resistance = cell constant / desired conductivity (Siemens)
Conversion: 1 ?S = 1 X 10⁻⁶ Siemens or 0.000001 Siemens
What is the calibration factor for conductivity?
The cell constant is only a calibration factor that changes conductance, which is measured in ?S , to conductivity, which is measured in ?S /cm. Cell constant is measured in values of 1/cm.
For example
Cell constant is 0.1,
Desired conductivity is 20 ?S
The resistance = 0.1/0.000020 = 5000 ohms
- By selecting a typical resistance value from the manufacturer’s manual’s example below Table and entering it into the decade resistance box, you can simulate a conductivity value.
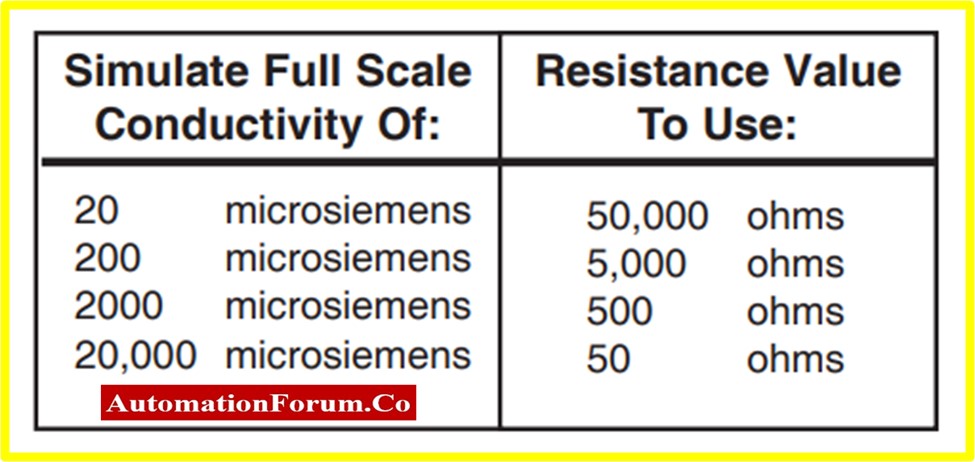
- The above resistance vs conductivity chart is based on an electrode conductivity cell constant of 1.0.
- For the purpose of simulating 0 microsiemens, remove one of the test leads from the resistance decade box.
- The conductivity transmitter reading should be zero, and the multimeter should show that it is producing 4 mA.
- Use the instructions provided by the transmitter to make adjustments if the value does not show zero (4mA).
- Reattach the test lead to the decade box in order to simulate full scale conductivity and choose the appropriate resistance value.
- The multimeter reading should indicate that 20 mA are being produced, and the conductivity transmitter reading should be at full scale.
- If the measurement does not display the full scale value (20mA), make changes according to the transmitter’s instructions.
- Check the reading on the half scale by multiplying the resistance value by two and entering that number into the decade resistance box.
- The conductivity transmitter reading should be at half scale, and the multimeter readout should show that 12 mA are being generated.
Example calibration
- For instance, if the intended conductivity range is 200 microsiemens and the electrode cell constant is 1.0.
- As a result of the calculation, the full scale simulation resistance value is 5000 ohms.
- When simulating with 5000 ohms, the transmitter should display the full scale conductance value of 200 microsiemens.
- When simulating with 2500 ohms, the transmitter should display a conductance value of 100 microsiemens at half scale.
Recording calibration
- Check that the transmitter’s conductivity circuitry is set up correctly for conductivity values at the zero scale, full scale, and half scale to make sure the conductivity transmitter is producing the desired results.
- If it will zero, read the full-scale and half-scale conductivity value to ensure that the sensor and transmitter conductivity circuitry are working properly. If not, test the sensor according to the relevant sensor’s instruction manual. Replace the transmitter’s electronic stack if the sensor passes its test without issue.
- If every output result (+/-%) falls within acceptable bounds, no additional calibration of the conductivity transmitter is necessary.
- The blank calibration report with conductivity electrode data should include the output values from the conductivity transmitter written in the as found/as left column.
Completion of calibration
- Attach the calibration label on the Conductivity transmitter once the calibration has been completed successfully.
- Clean the Conductivity transmitter, store it securely, and save the calibration data for later use when the calibration is finished.
- The sensor connections should be normalized after disconnecting every decade resistance box.
- Make sure the Conductivity transmitter’s calibration area is neat.
- De-isolate the Conductivity transmitter and take off any maintenance tags from it.
- Before resuming usage of the Conductivity transmitter, make sure it is functioning properly.
Sample conductivity transmitter report
The illustration below shows how the conductivity transmitter sample report of calibration was performed in the process area or analyzer room using decade resistance boxes.

By selecting the link below, you can get the Excel document that was used to create the conductivity transmitter calibration report.
Standards for Conductivity Transmitter Calibration
When calibrating conductivity transmitters, it is essential to follow internationally recognized standards to ensure the accuracy and reliability of the results.
The following standards are commonly referenced:
- ISO 17025:2017 (General requirements for the competence of testing and calibration laboratories): This standard specifies the requirements for the competence, impartiality, and consistent operation of calibration laboratories.
- NIST (National Institute of Standards and Technology) Traceability: All calibration references should be traceable to NIST, which guarantees the use of national standards for measurements. This is critical for regulatory compliance in industries such as pharmaceuticals, food and beverage, and water treatment.
- IEC 60746 (Water quality – Instrumentation): The standard covers the performance and calibration requirements for conductivity measurement instruments, including the use of sensors, transmitters, and displays.
- ASTM D1125 (Standard Test Methods for Electrical Conductivity and Resistivity of Water): This standard is useful when determining conductivity in water and provides the accepted test methods for conductivity measurements.
Traceability of Calibration Standards
All tools and reference equipment used during calibration should be calibrated against traceable standards to ensure accuracy. The traceability chain guarantees that measurements are traceable to the International System of Units (SI).
Key traceability points include:
- Reference Resistance Standards: The decade resistance box used during calibration must be traceable to NIST-calibrated resistance standards. A certificate of calibration with uncertainty should be available for these devices.
- Multimeter: The multimeter used for mA measurements must be calibrated in line with NIST or another accredited body, with a valid calibration certificate confirming its traceability to national standards.
- RTD Simulators: The RTD temperature simulation values used during calibration should be derived from NIST-traceable standards, ensuring that the resistance values applied during the simulation accurately reflect the corresponding temperatures.
Calibration Environment and Accuracy Considerations
Calibration should take place in a controlled environment to reduce sources of error such as electromagnetic interference, temperature fluctuations, or vibration. Following ISO 10012 (Measurement Management Systems – Requirements for Measurement Processes and Measuring Equipment) ensures that the environment and process meet the required accuracy and precision.