- Introduction to Calibration Interval Risk Calculator
- What Is a Calibration Interval Risk Calculator?
- Why Calibration Interval Planning Matters in Industrial Instrument Calibration
- How to Use the Calibration Interval Risk Calculator Inputs
- How the Calibration Risk Score Works
- Calibration Risk Bands and Recommended Actions
- How Drift Limit Is Calculated in Calibration Interval Planning
- Worked Industrial Examples of Calibration Interval Calculation
- Calibration Interval Optimization Strategy
- Common Calibration Interval Mistakes to Avoid
- When Should You Use the Calibration Interval Risk Calculator?
- Calibration Interval Risk Calculator Inputs
- Calibration Interval Risk Calculator Outputs
- Why Risk Based Calibration Is Better Than Fixed Annual Calibration
- Benefits of Using the Calibration Interval Risk Calculator
- Calibration Interval Risk Calculator FAQ
- 1. What is the ideal calibration interval?
- 2. How is calibration interval determined?
- 3. Does ISO 17025 require annual calibration?
- 4. How can calibration intervals be extended?
- 5. What causes instrument drift?
- 6. What is risk based calibration?
- 7. How often should pressure transmitters be calibrated?
- 8. How often should flow meters be calibrated?
- 9. What is NIST traceability?
- 10. How does environmental severity affect calibration frequency?
- 11. Why is historical stability so important?
- 12. What is the difference between drift and tolerance?
- 13. Why should safety instruments have shorter intervals?
- 14. Can this calculator reduce calibration cost?
- 15. What is a calibration due date?
- 16. What does a calibration risk score mean?
- 17. How should calibration records be used?
- 18. Why is interval optimization better than fixed scheduling?
- Conclusion: Data Driven Calibration Interval Planning
Calibration Interval Risk Calculator
Risk based calibration interval planner using ISO IEC 17025 concepts, NIST traceability practices, drift analysis, environmental severity, and process criticality scoring.
Instrument Inputs
Calibration Result
Introduction to Calibration Interval Risk Calculator
A calibration schedule should never be based only on habit. In many plants, instruments are still placed on a fixed 12 month cycle even when the device is stable, the process is non critical, and the historical drift data supports a longer interval. In other cases, the same 12 month schedule is used for highly critical safety instruments that should be reviewed much more frequently. That approach is simple, but it is not always technically justified.
The Calibration Interval Risk Calculator is designed to solve that problem. It helps instrumentation engineers, calibration engineers, maintenance teams, reliability teams, quality teams, EPC engineers, commissioning engineers, and ISO 17025 laboratories determine a more practical calibration interval using risk based logic. The calculator evaluates process criticality, consequence of failure, environmental severity, historical stability, drift rate, permissible tolerance, manufacturer guidance, safety service needs, ISO 17025 expectations, and NIST traceability considerations. It then produces a risk score, a risk band, a recommended calibration interval, a drift limit, a next calibration date, and a calibration basis.
Refer the below link for the ISO Standards For Instrumentation Calibration Complete Guide for Industrial Engineers
What Is a Calibration Interval Risk Calculator?
This calculator is not just a date planner. It is a decision support tool for calibration management.
It helps answer a practical question that every plant faces. How often should this instrument really be calibrated?
Instead of treating every instrument the same, the calculator weighs the actual service conditions. A pressure transmitter on a clean utility line does not carry the same risk as a pressure transmitter protecting a reactor or a safety instrumented system. A flow meter in custody transfer does not behave the same way as a simple indication device. A gas analyzer in emissions monitoring may need tighter oversight because drift and compliance risk are more serious. The calculator reflects those real differences in a structured way.
Audit Your Calibration Program Before Compliance Fails: Internal Audit Checklist for ISO Process Instrument Calibration in Process Industries
Why Calibration Interval Planning Matters in Industrial Instrument Calibration
Calibration interval planning matters because instruments do not stay perfect forever. They drift over time. That drift can come from process conditions, vibration, corrosion, temperature swings, humidity, wear, contamination, electronics aging, and mechanical stress.
When a device drifts beyond its permissible tolerance, the whole measurement chain becomes less trustworthy. That can affect product quality, energy usage, batch consistency, emissions control, process safety, maintenance decisions, and audit readiness.
A fixed interval may look neat on paper, but it does not reflect the actual condition of the instrument. A stable device may not need early replacement or frequent recalibration. A harsh service device may need more attention than the calendar suggests. That is why modern calibration programs are moving toward evidence based interval determination and historical performance review.
Stop Guessing: Know Calibration Versus Verification Fast: Calibration Vs Verification: Key Differences, Procedures, Examples and Best Practices In Process Industries
How to Use the Calibration Interval Risk Calculator Inputs
Instrument Tag
A unique tag helps you connect the device to its as found data, as left data, drift trend, failure history, and next due date. Without a proper tag, calibration history becomes fragmented and interval decisions become weak.
Instrument Type
Different instrument technologies behave differently in service.
A pressure transmitter may drift because of diaphragm stress, process impulse line issues, or sensor aging. A temperature transmitter can be quite stable for a long time. However, wiring, thermowell response and sensor deterioration might impact performance. If the application is for custody transfer or process balance, then a flow meter may require more attention. A gas analyzer often needs closer control because sample handling, contamination, and environmental changes can influence readings. A valve positioner may be exposed to air supply quality, friction, and mechanical wear.
Because each technology has a different failure pattern, calibration intervals should be based on actual behavior, not only on the device category.
Manufacturer Recommended Interval
The manufacturer interval is a starting point, not the final answer.
Vendors often recommend an interval that is safe for a broad range of users. That recommendation is useful when you have limited historical data. It gives you an initial baseline. But once you have enough records, you should compare the vendor suggestion with field performance, drift trend, environment, and process risk.
A stable transmitter may justify extending beyond the initial vendor interval. A critical device in demanding service may need a shorter interval than the vendor default.
Protect Accuracy by Calibrating Calibrators the Right Way: Why Calibrating your Calibrators is Critically Important: Accuracy, Compliance and ISO 17025 and NIST Traceability
Last Calibration Date
The last calibration date supports due date calculation and compliance tracking.
It allows you to determine the next calibration date, schedule work orders and avoid missed calibrations. It also gives auditors a clear record of the calibration cycle. Good calibration management depends on accurate date history, because interval decisions become much stronger when the last service date is known with confidence.
Process Criticality
Process criticality tells you how important the measurement is to the plant.
A low criticality device may only provide general indication. A high criticality device may directly affect shutdown logic, control stability, product quality, or operator safety.
A good way to think about it is simple. If the instrument fails, does the plant merely lose a convenient display, or does it risk production loss, environmental release, or unsafe operation? The more serious the answer, the higher the criticality score should be.
Consequence of Failure
The consequence of failure measures the real business and safety impact if the instrument becomes inaccurate or fails.
Some failures only create small operating inconvenience. Others can cause batch loss, off spec production, environmental harm, shutdowns, regulatory issues, or safety incidents. That is why the same instrument technology can have very different calibration needs depending on where it is used.
A transmitter in a utility line may tolerate a wider interval than the same model in a critical reactor or emissions service.
Environmental Severity
Environmental severity is one of the strongest interval drivers.
Harsh temperatures, humidity, vibration, dust, corrosive atmosphere, and hazardous area conditions all increase the chance of drift or failure. The calculator correctly treats environment as a major factor because field conditions often shorten the useful calibration interval more than the vendor brochure suggests.
An instrument in a clean control room may remain stable for a long time. An instrument mounted outdoors in a corrosive coastal plant may not.
Avoid Costly Re-ranging Mistakes in Instrument Loops: Why Calibration Isn’t the Same as Re-ranging in Process Instrumentation
Historical Stability
Historical stability is where calibration planning becomes evidence based.
If past calibration records show that the instrument repeatedly stays within tolerance, then the interval may be extended with confidence. If records show frequent failure, excessive drift, or repeated adjustment, the interval should be reviewed and possibly shortened.
This is where as found data becomes extremely valuable. It shows what the instrument looked like before adjustment, and that is often more meaningful than the final pass result.
Observed Drift Rate
Drift is the slow movement of an instrument reading away from the true value over time.
A pressure transmitter might drift by a small amount each month. A temperature transmitter may show minimal drift for long periods and then move after repeated thermal cycling. A gas analyzer may drift due to sample contamination or sensor degradation. The key point is that drift rate helps predict when the instrument may leave its acceptable band.
If drift is high, the calibration interval should generally be shorter.
Permissible Tolerance
Permissible tolerance is the amount of error you can accept before the measurement is no longer fit for use.
This is the line between acceptable performance and unacceptable performance. A device with a narrow tolerance needs closer control than a device with a wide tolerance. The calculator uses tolerance together with drift rate to estimate how long the device can stay in service before it is likely to go out of limits.
Eliminate the Most Dangerous Calibration Errors Now: Top 15 Common Calibration Mistakes in Industrial Instruments
ISO IEC 17025 Context
ISO IEC 17025 is important because it emphasizes competence, traceability, documentation, and evidence based control of calibration activities.
In practice, this means your calibration interval should not be a guess. It should be justified through technical evidence, historical data, and periodic review. The calculator supports that mindset by turning calibration history and risk factors into a more structured decision.
NIST Traceability
Traceability connects the instrument under test to recognized reference standards through an unbroken calibration chain.
In simple terms, your calibration result should be traceable back through the standards hierarchy. That strengthens audit readiness and measurement confidence. NIST traceability does not mean every instrument must be calibrated at the same fixed interval. Instead, interval choice should reflect stability, usage, and risk. That is why traceability and interval planning should work together, not separately.
Safety Instrumented Service
Safety instrumented service usually needs tighter calibration control.
Upgrade Your Calibration Knowledge With These Proven Guidelines: Calibration Guidelines
How the Calibration Risk Score Works
The calculator builds a risk score from the most important field and compliance factors.
The logic gives major weight to process criticality and consequence of failure because these two inputs describe the business and safety impact of error. Environmental severity matters because harsh service accelerates wear and drift. Historical stability matters because the past often predicts the future. Drift ratio matters because it directly shows how quickly the instrument may leave tolerance.
The calculator also adds extra concern when the instrument is part of safety instrumented service. That makes sense because safety critical equipment should be treated more conservatively.
In practical terms, the score is not just a number. It is a summary of how much confidence you should have in the current interval.
Get PLC Raw Count Calculations Right Every Time: PLC Raw Count Calculator: Comparison with PLC Internal Scaling Blocks, Real-World Use Cases and Practical Benefits
Calibration Risk Bands and Recommended Actions
A calibration risk score should lead to a clear action, not confusion.
Low risk means the current interval may be extended if other evidence supports it. Moderate risk means the current interval is probably still acceptable. The higher the risk, the shorter the interval or the closer to follow up. High risk means a significant reduction is usually justified. Critical risk means the interval requires immediate review.
Size PLC Power Supplies With Zero Margin Errors: PLC Power Supply Calculator – Complete Guide for Accurate PLC Power Sizing
How Drift Limit Is Calculated in Calibration Interval Planning
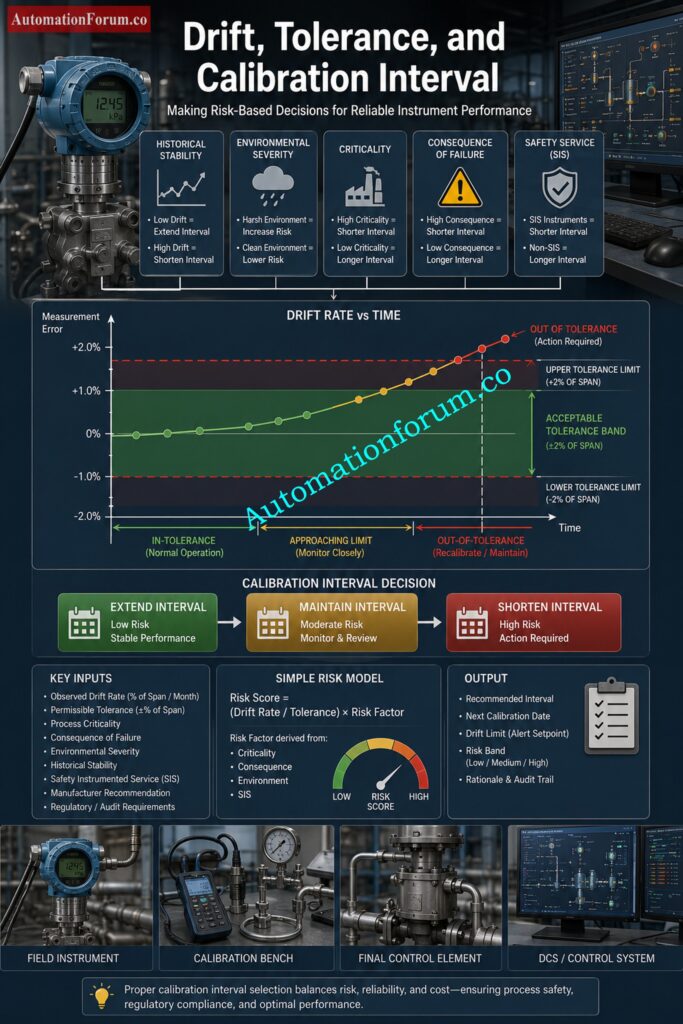
The drift limit is one of the most useful outputs in the calculator.
The logic is straightforward. Drift limit equals tolerance divided by drift rate.
This tells you how many months the instrument may remain in service before it is likely to exceed its allowed error band. A low drift rate with a wide tolerance may support a long interval. A high drift rate with a tight tolerance may demand a much shorter interval.
For example, if tolerance is 0.500 and drift rate is 0.020 per month, the drift limit is 25 months. That does not automatically mean the calibration interval must be 25 months, but it does show that the device has a relatively comfortable margin before it exceeds tolerance. The final interval still depends on criticality, environment, and compliance needs.
Catch Instrument Calibration Errors Before They Spread: Calibration Error Calculator for Instruments
Worked Industrial Examples of Calibration Interval Calculation
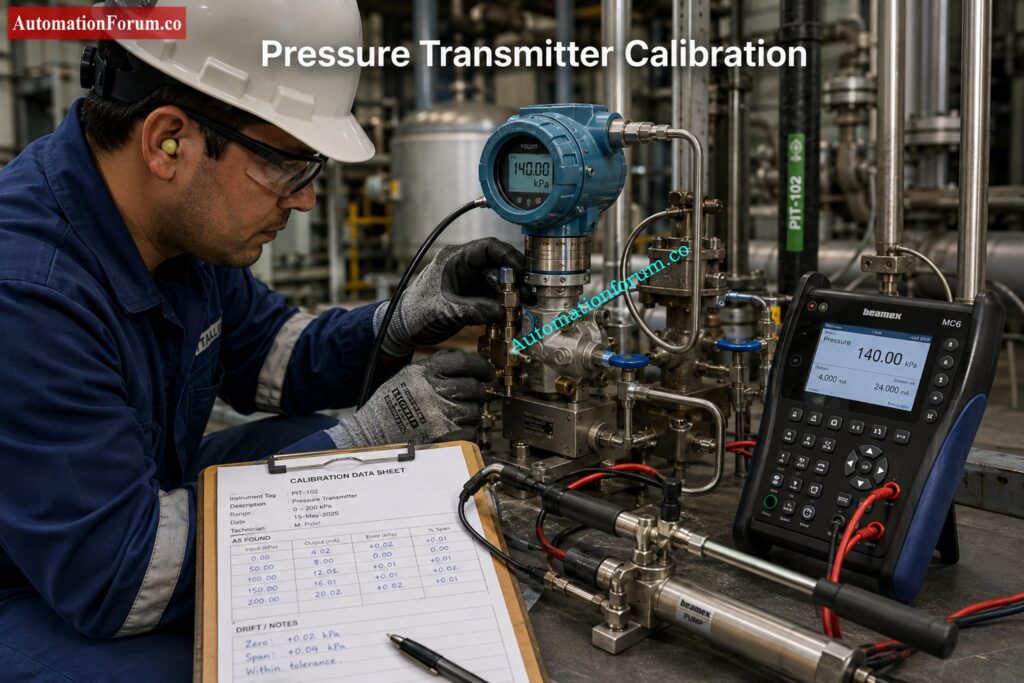
Example 1 Pressure Transmitter in Utility Service
A pressure transmitter used in utility service is usually a good example of a stable and low impact instrument. In many plants, this type of device is used for general monitoring, utility line indication, or non critical control loops where a small measurement shift does not create major production or safety problems. Because the process importance is moderate and the environment is often relatively controlled, the overall risk is usually not very high.
If the transmitter has shown stable calibration history with little drift over several cycles, the calculator may support keeping the interval at 12 months or even extending it slightly. In many cases, this becomes a strong candidate for interval optimization because the instrument is not exposed to severe process stress and does not carry a high consequence of failure. For maintenance teams, this means calibration effort can be focused on more critical devices without losing confidence in this transmitter.
Use ISO-Aligned Flow Calibration Procedures That Hold Up: ISO Standard Calibration Procedures for Flow Measuring Instruments
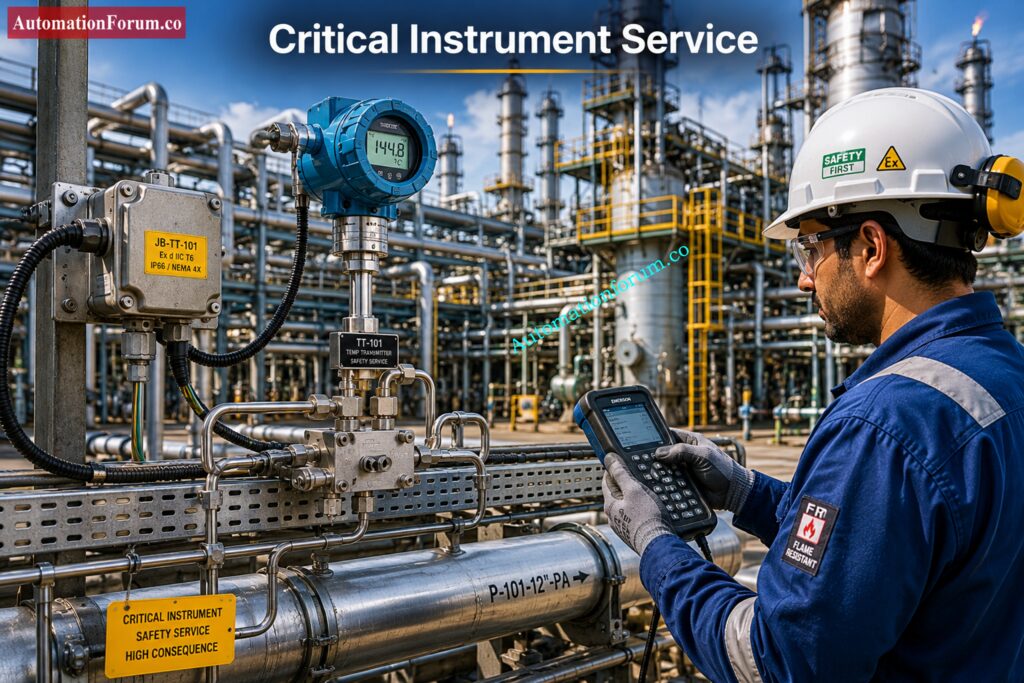
Example 2 Safety Critical Pressure Transmitter
A pressure transmitter used in a safety critical application must be treated very differently from a standard utility instrument. This type of device may be part of an alarm system, interlock, shutdown function, or safety instrumented service. In such cases, even a small error can have serious consequences because the instrument is directly linked to plant protection.
Even when the transmitter has a good drift history, the safety role increases the risk score because the acceptable level of uncertainty is much lower. If the device is installed in a harsh area with vibration, temperature cycling, or corrosive conditions, the need for a shorter calibration interval becomes even stronger. In practical terms, this is not the kind of instrument where interval extension should be done casually. The final decision should always be supported by field evidence, risk review, and compliance requirements.
Verify Calibration Results With Confidence and Speed: Instrument Calibration Verification Calculator
Example 3 Flow Meter in Custody Transfer
A flow meter in custody transfer service is one of the most important examples in calibration planning because the measurement directly affects financial transactions. If the meter reads incorrectly, one party may lose product value while the other may receive inaccurate billing or accounting data. That makes both the consequence of failure and the process criticality very high.
For this reason, the calibration interval often needs to be tighter than a general service meter. Even small drift or bias can create unacceptable financial error. Audit expectations are also usually stricter because the measurement must be defensible and traceable. If the historical records show excellent stability, the interval may still be optimized, but only with strong technical justification and clear documentation. This is a strong example of why risk based calibration is more effective than applying a standard annual cycle to every meter.
Find the Exact Test Points You Need: Online Calibration Test Points Value Calculator
Example 4 Temperature Transmitter in Reactor
A temperature transmitter in a reactor service is often a highly important control device because temperature has a direct effect on reaction rate, product quality, and process safety. In many cases, the transmitter output may influence control loops, alarms, or operating decisions. That means even a small amount of drift can create a large process impact.
If the transmitter starts reading higher or lower than the actual process temperature, the reactor may move away from its intended operating condition. This can lead to poor product quality, unstable operation, or unsafe process behavior. Because of that, calibration planning for this device should not rely only on the manufacturer recommendation. The engineer should also consider the historical drift pattern, the sensitivity of the process, and the consequences of a wrong reading. A reactor temperature transmitter is a good example of how process importance can justify a shorter and more carefully reviewed calibration interval.
Measure Instrument Accuracy Like a Pro Today: Instrument Accuracy Calculator
Example 5 Gas Analyzer in Emissions Monitoring
A gas analyzer used in emissions monitoring often requires special attention because it is affected not only by instrument drift but also by sample quality, contamination, sensor condition, and environmental effects. If the analyzer gives inaccurate results, the organization may face compliance issues, reporting errors, or environmental risk. In many cases, regulatory responsibility makes this type of instrument more sensitive than a standard process measurement device.
Because of this, the calibration interval should be based on both technical stability and the cost of inaccurate reporting. If the analyzer has stable historical records and consistent as found results, a modest extension may be possible. However, that decision must be supported by strong evidence, proper review, and documented justification. For emissions servicing the primary issue is not only to maintain the analyzer running, but also to ensure the reported values are trustworthy for compliance and operational choices.
Re-range DP Flow Transmitters Without Risky Guesswork: DP Flow Transmitter Re-Ranging Calculator
Calibration Interval Optimization Strategy
- The best calibration programs do not blindly shorten every interval. They optimize.
- That means extending intervals where the evidence supports it and shortening them where the risk is real.
- The main tools for optimization are drift trending, as found data, historical pass and fail patterns, environmental assessment, and criticality review.
- A well managed program reduces unnecessary calibration cost while improving trust in important measurements. It also helps avoid over calibration, which consumes labor and may introduce handling error without improving reliability.
- The smartest approach is to review records regularly and adjust intervals only when the evidence is strong.
Calculate Differential Pressure Flow Output the Smart Way: Differential pressure Flow Transmitter Output Calculator
Common Calibration Interval Mistakes to Avoid
- One of the biggest mistakes is using 12 months for everything.
- A good calibration program avoids these mistakes by using records, risk, and technical judgment together.
Lock In a Better Weighing Calibration Process: Weighing System Calibration Procedure
When Should You Use the Calibration Interval Risk Calculator?
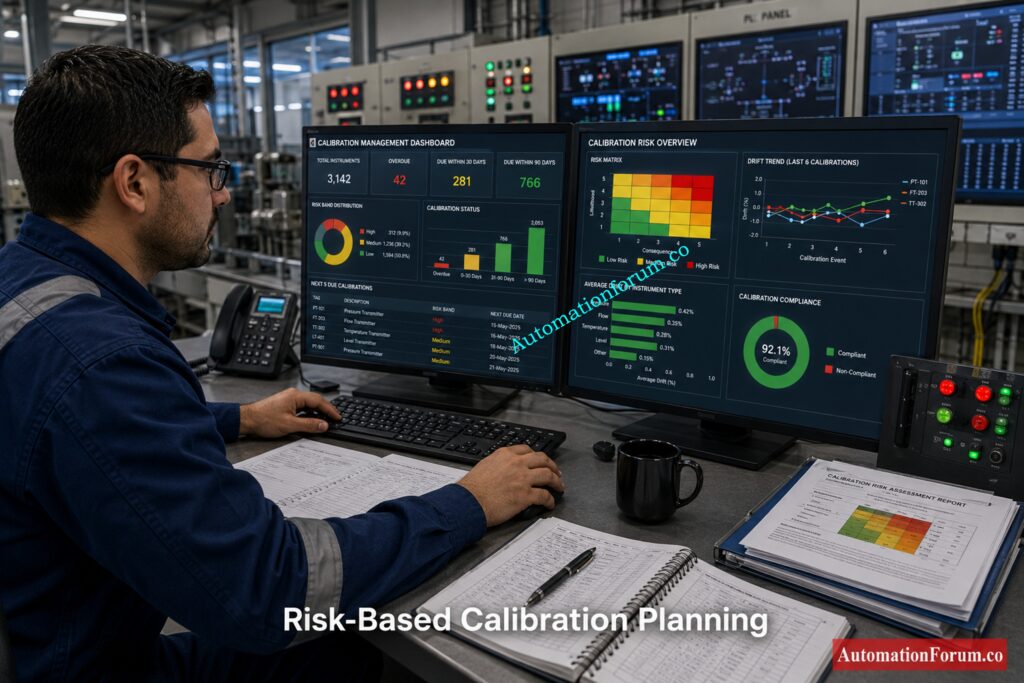
Engineers should use this calculator whenever they need to establish, review, justify, or optimize calibration intervals for industrial instruments. It is particularly useful when moving from fixed calendar based calibration schedules to a risk based calibration strategy.
This calculator can be used during:
- Calibration interval reviews
- ISO 17025 audits
- Reliability improvement programs
- Instrument maintenance planning
- Turnaround preparation
- Safety instrument assessments
- Calibration cost reduction initiatives
- Instrument lifecycle management
This tool helps engineers make objective and data driven decisions rather than relying solely on historical practices.
Tighten Analytical Instrument Calibration With Expert Procedures: Analytical Instruments Calibration Procedures
Calibration Interval Risk Calculator Inputs
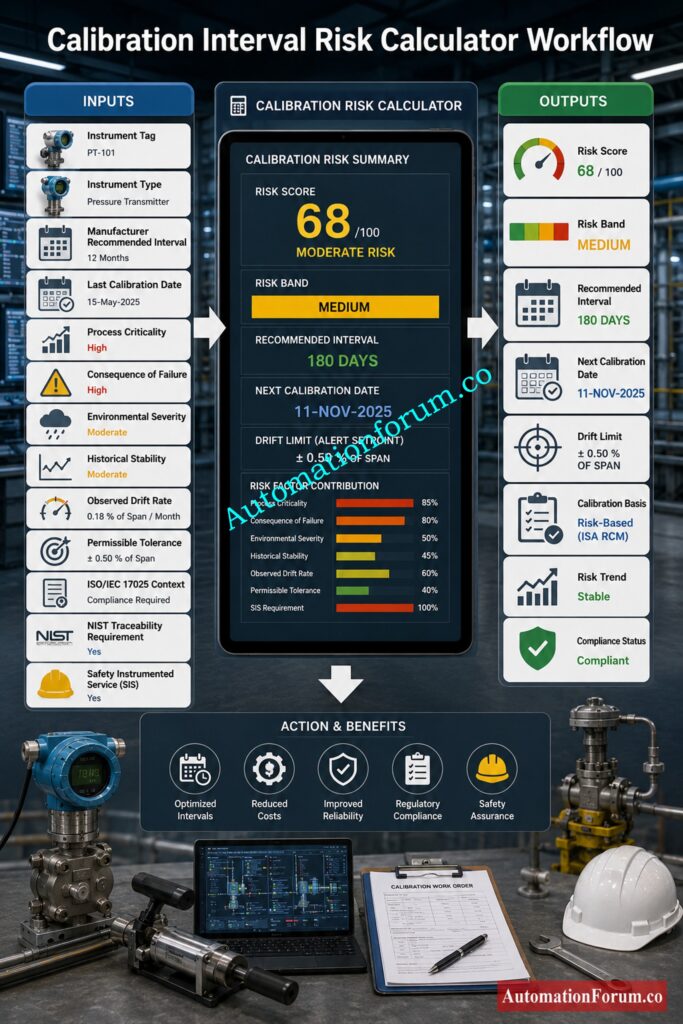
The calculator evaluates several technical and operational factors that influence calibration frequency.
| Input | Description |
| Instrument Tag | Unique instrument identification |
| Instrument Type | Device category being evaluated |
| Manufacturer Recommended Interval | Suggested calibration period from vendor |
| Last Calibration Date | Most recent calibration date |
| Process Criticality | Importance of the measurement |
| Consequence of Failure | Impact of instrument failure |
| Environmental Severity | Operating environment conditions |
| Historical Stability | Previous calibration performance |
| Observed Drift Rate | Measured instrument drift |
| Permissible Tolerance | Maximum allowable error |
| ISO IEC 17025 Context | Calibration quality requirements |
| NIST Traceability Requirement | Traceability compliance needs |
| Safety Instrumented Service | Safety related application status |
Calibrate Control Valves Correctly and Avoid Downtime: Control Valve Calibration Procedures
Calibration Interval Risk Calculator Outputs
After processing the entered data, the calculator generates several useful outputs.
| Output | Description |
| Risk Score | Overall calibration risk value |
| Risk Band | Low, Moderate, Elevated, High, or Critical |
| Recommended Calibration Interval | Suggested calibration frequency |
| Next Calibration Date | Estimated next calibration due date |
| Drift Limit | Maximum allowable operating period based on drift |
| Calibration Basis | Risk based calibration justification |
Follow Temperature Calibration Steps That Actually Work: Temperature Calibration Procedure
Why Risk Based Calibration Is Better Than Fixed Annual Calibration
Many facilities continue to calibrate every instrument on a 12 month cycle regardless of service conditions, stability or criticality.
There are various benefits to a risk based approach:
- Reduces unnecessary calibration
- Maximizes maintenance resources
- Improves the reliability of instruments
- ISO 17025 compliance support
- Increases confidence in measurement
- Improves audit Preparedness
- Lowers operating costs
- Shifts focus to high risk assets
This allows organisations to link calibration activities with actual process risk, rather than arbitrary calendar dates.
Nail Level Device Calibration With Fewer Failures: Calibration Procedures for Level Measurement Devices
Benefits of Using the Calibration Interval Risk Calculator
This calculator helps organizations to establish a better approach to calibration management.
Benefits include:
- Improved instrument dependability
- Improved calibration planning
- Lower maintenance expenses
- Improved process safety
- Improved Regulatory Compliance
- Better audit preparations
- Improved asset performance
- Data-driven calibration choices
- More accurate measurement
- Optimised calibration tasks
Master Pressure Instrument Calibration With Proven Field Methods: Calibration Procedures for Various Pressure Measuring Instruments
Calibration Interval Risk Calculator FAQ
1. What is the ideal calibration interval?
The optimal calibration interval is the smallest time that will maintain the accuracy, reliability and compliance of the instrument without unnecessary maintenance effort. Depends on drift history , environment , criticality and consequence of failure .
2. How is calibration interval determined?
The calibration interval is selected based on a review of manufacturer recommendations, previous stability, observed drift, severity of the environment and criticality of the process. The goal is to keep the instrument within the tolerances until the next calibration.
3. Does ISO 17025 require annual calibration?
No, no annual calibration is required for each instrument from ISO IEC 17025. The interval needs to be justified by evidence, technical evaluation and continual monitoring.
4. How can calibration intervals be extended?
If the instrument has a stable history, little drift and satisfactory performance in real use, calibration periods can be extended. Always justify your decision and do so on evidence.
5. What causes instrument drift?
Instrument drift can be caused by aging, vibration, temperature variations, humidity, corrosion, contamination, wear, electrical problems, and process stress. Harsh service conditions often accelerate drift.
6. What is risk based calibration?
Risk based calibration establishes the interval depending on the actual operational risk, not a predefined calendar rule. It takes into account importance, impact of failure, environment, stability and drift.
7. How often should pressure transmitters be calibrated?
There is no interval for each pressure transmitter. Critical or safety service transmitters may need to be done more frequently, while stable utility service devices may live longer.
8. How often should flow meters be calibrated?
The frequency at which you test a flow meter will depend on the type of meter, the service conditions and the commercial implications of the error. Custody transfer or compliance applications generally require more stringent supervision than basic indication service.
9. What is NIST traceability?
NIST traceability means the measurement is linked through an unbroken calibration chain to recognized reference standards. It helps with accuracy, audit confidence and quality compliance.
10. How does environmental severity affect calibration frequency?
Drift or danger of failure can be increased by harsh circumstances such as heat, humidity, vibration, dust and corrosion. Instruments used in extreme conditions frequently require more rigorous calibration assessment.
11. Why is historical stability so important?
The historical stability indicates how the instrument has performed throughout time. If it stays within tolerance several times, the interval can be increased with confidence.
12. What is the difference between drift and tolerance?
Drift is the variation of the instrument output with the time. Tolerance is the permitted error limit. If the drift exceeds the tolerance, the instrument is no longer acceptable.
13. Why should safety instruments have shorter intervals?
Safety instruments should usually have shorter intervals because failure consequences are much higher. A conservative interval helps protect people, process, plant, and environment.
14. Can this calculator reduce calibration cost?
Yes, it can eliminate unnecessary calibrations by finding stable low risk instruments. It also helps to focus maintenance efforts on high risk devices that require more attention.
15. What is a calibration due date?
Calibration due date: The date on which the next calibration is scheduled. The standard calculation is to add the approved interval to the last date of calibration.
16. What does a calibration risk score mean?
Calibration risk score indicates level of concern regarding the present interval. If the score is low, the interval may be safe; if it is excessive, it may need to be reduced.
17. How should calibration records be used?
Calibration records should be reviewed for drift trends, repeated failures, and stability patterns. They are the best evidence for extending, reducing, or reviewing an interval.
18. Why is interval optimization better than fixed scheduling?
Interval optimization matches calibration effort to actual risk. It saves time on stable instruments and gives more attention to critical or unstable devices.
Click here for 200+ Online Instrumentation Calculators Collections
Conclusion: Data Driven Calibration Interval Planning
Calibration interval planning should be evidence based, not habit based. The best interval is the one that reflects actual drift behavior, process risk, environmental severity, historical stability, tolerance, and compliance needs. That is exactly why the Calibration Interval Risk Calculator is valuable. It helps teams move away from one size fits all scheduling and toward a more reliable, auditable, and cost effective calibration strategy.
Tap the AutomationForum.co Calibration Interval Risk Calculator to develop data driven calibration schedules, eliminate wasteful calibration expenses, increase instrument dependability, support ISO 17025 compliance, and optimize maintenance plans across industrial sites.
Refer the below link to Choose Calibration Management Software That Delivers Results