- Why Plants Use Multiple Transmitters for the Same Measurement
- Key Reasons for Using Multiple Transmitters in Process Industries
- Voting Logic and MooN Architectures in Safety Instrumented Systems
- Comparison of Redundant Transmitter Architectures
- Safety Integrity Level (SIL) and Reliability Concepts
- Worked Example of PFD Calculation for Redundant Transmitters
- Diagnostic Coverage and Proof Test Influence on PFD
- Common Cause Failure (CCF) and Beta Factor in Redundant Systems
- Example Calculation of PFD with Common Cause Failure
- Engineering Practices to Reduce Common Cause Failures
- Implementation Best Practices for Redundant Transmitter Systems
- Common Mistakes in Redundant Instrumentation Design
- Practical Case Study – Redundant Flow Measurement for Furnace Protection
- Design Checklist for Redundant Transmitter Systems
- Recommended Redundant Architectures Based on Process Criticality
- Designing Reliable Redundant Transmitter Systems
- FAQ on Redundant Transmitters, CCF, Diagnostics and Proof Testing
Why Plants Use Multiple Transmitters for the Same Measurement
Multiple transmitters for a single process variable are not redundancy for redundancy’s sake they are deliberate engineering choices to control risk, maintain production continuity and meet functional safety obligations. In continuous and semi-continuous process industries (oil & gas, petrochemical, fertilizer, power), a single lost or biased measurement can cause process excursions, spurious trips or prolonged shutdowns.
Proper redundancy reduces single-point failures, allows online maintenance, detects drift and supports Safety Instrumented System (SIS) claims under IEC 61511.
This article provides practical guidance on why multiple transmitters are used, how different MooN voting architectures behave, the quantitative link to SIL via PFDavg calculations, and field-proven implementation practices and pitfalls all targeted at EPC instrumentation engineers and I&E specialists who must make defensible, auditable design choices.
Key Reasons for Using Multiple Transmitters in Process Industries
Continuity of Operation and High Availability in Process Plants
- Objective: minimise unplanned shutdowns and operator interventions.
- Mechanism: redundant channels provide immediate failover so control and protection functions continue when one device stops or produces bad data.
- Example: in a gas compressor suction control, loss of flow or pressure measurement can force a trip; a 1oo2 or 2oo3 sensing architecture keeps the loop active while maintenance is scheduled.
- Metric impact: redundant sensing reduces mean time to failure exposure and increases calculated availability (e.g., % uptime), which can be translated into production-loss dollars in the business case.
Maintenance and Calibration Without Process Shutdown
- Objective: perform calibration/repair without halting a process unit.
- How it is implemented: use MooN architectures that allow one channel out for calibration while others maintain the safety/control decision. Include hot-swap or exchange kits and procedural steps (isolation, tagging, SIS bypass if required) in the operations manual.
- Practical notes: ensure mechanical tappings and manifolds permit individual instrument isolation without impacting measurement fidelity on remaining channels.
Global Safety Standard Guide: S84 / IEC 61511 Standard for Safety Instrumented Systems – Complete Guide
Increased Confidence in Measurement for Control and Safety
- Objective: detect bias, drift and installation errors early.
- Methods: cross-comparison logic, plausibility checks, statistical filtering and trend alarms. Multiple transmitters allow the system to detect a slowly drifting transmitter before it becomes a dangerous failure.
- Operational benefit: improved controller tuning and reduced oscillation/hunting when the controller uses fused or voted inputs.

Diagnostic Coverage and Proof Testing for Smart Transmitters
- Diagnostic coverage (DC): proportion of failures that diagnostics will detect automatically. Higher DC reduces the portion of dangerous undetected failures, lowering PFDavg.
- Proof testing: scheduled manual tests detect failures not covered by diagnostics. Define proof-test intervals (Ttest) based on device reliability and consequence.
- Documentation: record proof-test procedures and results in the asset/SIL file to demonstrate lifecycle compliance.
Regulatory and Safety Requirements under IEC 61511
- IEC 61511 context: redundancy and voting are common design patterns to achieve target SIL through reduced PFDavg.
- Lifecycle view: document allocation of safety requirements, architecture justification and verification evidence in the safety requirements specification (SRS) and the safety validation report.
Refer the below link for the Virtual Redundant Transmitter (VRT) in Honeywell Turbomachinery Control Systems
Voting Logic and MooN Architectures in Safety Instrumented Systems
Understanding M out of N (MooN) Voting Logic
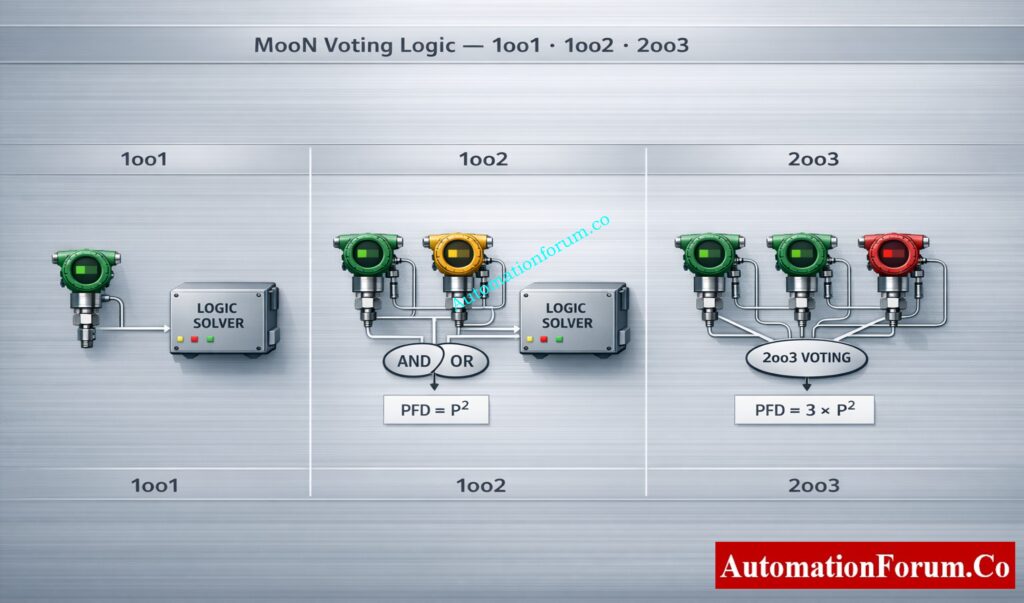
- MooN meaning: “M out of N” channels must agree to assert an action. For SIS, clarify whether the logic is voting-to-trip (majority required to trip) or voting-to-run (majority required to continue normal operation) the semantics affect spurious trip behaviour and degraded operation modes.
1oo1 Architecture – Simple but No Redundancy
- Pros: simplest, minimal hardware and wiring.
- Cons: no redundancy; any dangerous failure directly impacts safety function.
1oo2 Architecture – High Availability with Limited Fault Tolerance
- Use: where online maintenance and minimal interruptions are prioritized.
- Behaviour: system continues with a single healthy channel; but a single faulty channel can increase nuisance trips if voting logic treats inconsistent data as trip condition. Best used with robust plausibility and alarm suppression during transient conditions.
2oo3 Architecture – Preferred Design for High Integrity SIS Loops
- Use: high-consequence SIS loops where both availability and low spurious-trip risk are needed.
- Behaviour: tolerates a single device failure without loss of protective function; reduces spurious trips by requiring concurrence. Supports graceful degradation.
1oo3 Architecture – Special Cases in Availability Driven Systems
- 1oo3 increases availability but can be sensitive to majority voting semantics. Evaluate case-by-case.
Impact of Voting Architecture on Spurious Trips and System Availability
- Availability vs safety: 1oo2 favours availability; 2oo3 favours safety and robustness to spurious trips.
- Complexity: 2oo3 requires more hardware and more extensive CCA because of increased CCF exposure paths.
- Operational mode: define explicit degraded-mode SOPs (e.g., alarm when architecture falls to 1oo2).
Critical Control System Concept: What is a redundant power supply?
Comparison of Redundant Transmitter Architectures
| Architecture | Trip sensitivity | Tolerance to dangerous failure | Tolerance to safe failure | Typical application |
| 1oo1 | High | 0 | 0 | Low-risk control |
| 1oo2 | Medium | 0 (unless voted) | 1 | Availability-critical control |
| 2oo3 | Low | 1 | 2 | High-risk SIS loops |
| 1oo3 | Medium | 0–1 | 2 | Redundant availability cases |
Safety Integrity Level (SIL) and Reliability Concepts
Understanding SIL Requirements in IEC 61511
- PFDavg: average probability that the safety function will fail on demand over the mission/proof-test interval.
- SIL mapping: IEC 61511 uses PFDavg bands to assign SIL levels (e.g., SIL 1 to SIL 4 ranges). Achieving SIL is about demonstrating PFD via credible data, diagnostics and architecture.
Plant Safety Explained Clearly: ESD vs SIS Difference When to Use Each and Practical Engineering Guide
Worked Example of PFD Calculation for Redundant Transmitters
Assumptions Used for Reliability Calculation
Single transmitter PFDavg (P) = 1 × 10⁻² (0.01).
Independence is assumed between channels (no Common Cause Failure) for the baseline comparison.
Diagnostic functions and proof tests are assumed to be included within the value P.
Reliability Formulas for 1oo1, 1oo2 and 2oo3 Architectures
For redundant architectures, the simplified reliability relationships are:
PFD₁oo₁ = P
PFD₁oo₂ ≈ P²
(Both transmitters must fail simultaneously to impair the safety function.)
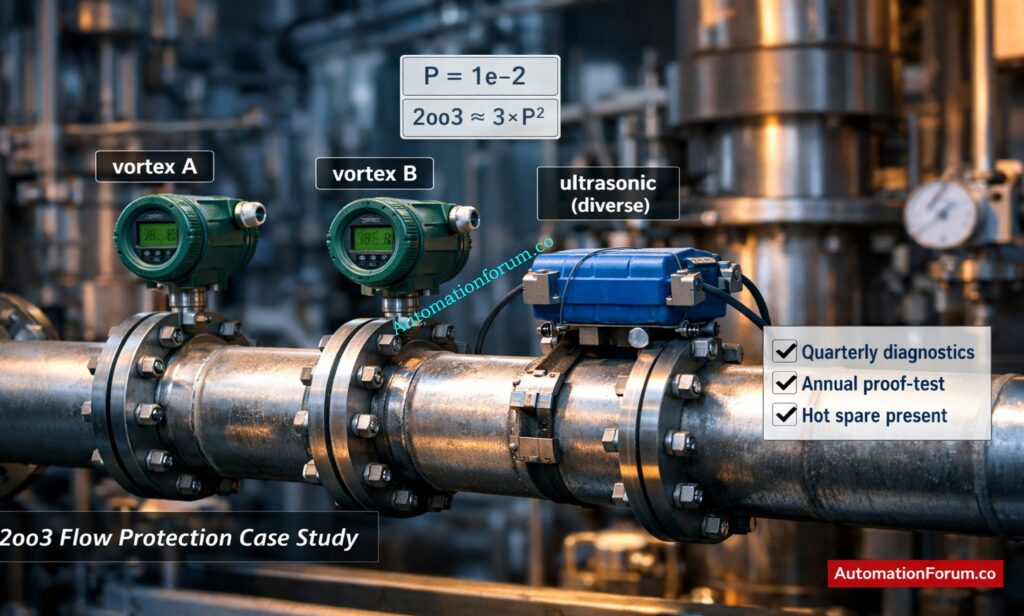
PFD₂oo₃ ≈ 3 × P²
(The combinational factor C(3,2) = 3, meaning any two transmitters out of three must fail.)
Numeric PFD Calculation Example
1oo1 Architecture
PFD₁oo₁ = 1 × 10⁻²
PFD₁oo₁ = 0.0100
1oo2 Architecture
PFD₁oo₂ ≈ (1 × 10⁻²)²
PFD₁oo₂ ≈ 1 × 10⁻⁴
PFD₁oo₂ ≈ 0.0001
2oo3 Architecture
PFD₂oo₃ ≈ 3 × (1 × 10⁻²)²
PFD₂oo₃ ≈ 3 × 1 × 10⁻⁴
PFD₂oo₃ ≈ 3 × 10⁻⁴
PFD₂oo₃ ≈ 0.0003
Interpretation of Results for Different Architectures
A single transmitter with P = 1 × 10⁻² roughly corresponds to SIL 1 capability, depending on the proof-test interval and system design.
A 1oo2 architecture significantly improves reliability because both transmitters must fail simultaneously before the safety function fails. This gives approximately 100× improvement compared with a single transmitter.
A 2oo3 architecture may show a slightly higher theoretical PFD in simplified calculations compared with ideal 1oo2, but it provides important operational advantages such as:
- Lower spurious trip probability
- Higher fault tolerance
- Ability to tolerate one faulty transmitter while maintaining operation
For this reason, 2oo3 voting is widely used in high-integrity Safety Instrumented Systems (SIS).
Core Functional Safety Concept: Voting Logic in Safety Instrumented System
Diagnostic Coverage and Proof Test Influence on PFD
Diagnostic Coverage (DC) in Smart Field Instruments
Diagnostic Coverage represents the percentage of dangerous failures automatically detected by device self-diagnostics.
Modern smart transmitters typically provide:
60–90% diagnostic coverage
Higher diagnostic coverage reduces the dangerous undetected failure rate (λDU), which directly lowers the PFDavg.
Free Engineer Resource: Functional Safety Terminology – Excel Download for Industrial Automation
How Diagnostic Coverage Reduces Dangerous Undetected Failures
Example:
If the dangerous failure rate is
λD = 1 × 10⁻⁶ failures/hour
and the diagnostic coverage is
DC = 80%
then only 20% of failures remain undetected.
Therefore:
λDU = 0.2 × λD
This significantly reduces the probability of failure on demand.
Importance of Proof Test Interval in Safety Systems
Proof testing detects failures that internal diagnostics cannot detect.
Typical proof-test intervals in process plants are:
- 6 months
- 12 months
PFDavg is approximately proportional to the proof-test interval.
Typical Proof Test Intervals in Process Industries
Therefore:
If the proof-test interval is reduced from 12 months to 6 months, the time-dependent portion of PFDavg is roughly reduced by half.
For high-risk applications such as:
- High-pressure reactors
- Furnace safety systems
- Toxic chemical storage tanks
shorter proof-test intervals are often selected.
Shutdown Reliability Design: Understanding 2 out of 2 SOV: Working & Configuration
Common Cause Failure (CCF) and Beta Factor in Redundant Systems
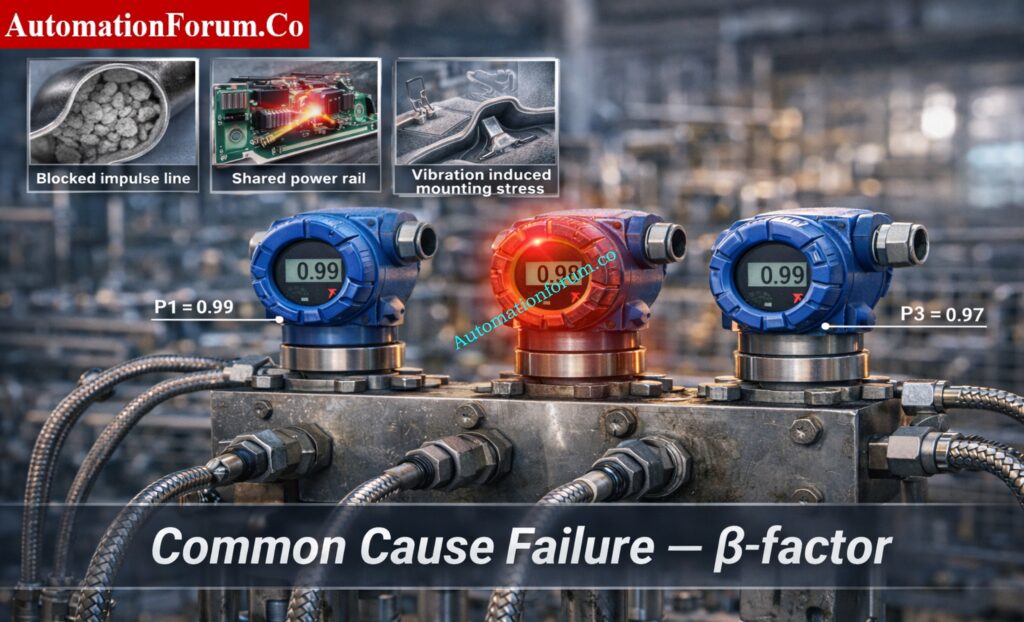
Understanding Common Cause Failure in Redundant Transmitters
Examples include:
- Same design defect in identical transmitters
- Common impulse line blockage
- Extreme ambient conditions
- Mechanical vibration affecting all instruments
IEC 61511 reliability calculations commonly use the β-factor model.
Typical Beta Factor Values in Industrial Installations
Typical β values:
| Installation condition | Typical β value |
| Identical transmitters, same installation | 0.05 – 0.1 |
| Some diversity and separation | 0.02 – 0.05 |
| High diversity and physical separation | < 0.02 |
Simplified PFD Calculation Including Beta Factor
For a 1oo2 architecture, a simplified correction formula is:
Ppair ≈ β × P + (1 − β) × P²
Where:
P = PFD of one transmitter
β = common cause failure factor
High Availability Control Strategy: Designing 2 out of 4 Voting Logic in Control Systems
Example Calculation of PFD with Common Cause Failure
Assume:
P = 1 × 10⁻²
β = 0.05
Step 1 – Common Cause Contribution
β × P
= 0.05 × 1 × 10⁻²
= 5.0 × 10⁻⁴
Step 2 – Independent Failure Contribution
(1 − β) × P²
= 0.95 × (1 × 10⁻²)²
= 0.95 × 1 × 10⁻⁴
= 9.5 × 10⁻⁵
Step 3 – Total Corrected PFD
Ppair ≈ (5.0 × 10⁻⁴) + (9.5 × 10⁻⁵)
Ppair ≈ 5.95 × 10⁻⁴
Ppair ≈ 0.000595
This example shows that Common Cause Failure can dominate the total PFD value.
Even though the theoretical independent result was:
P² = 1 × 10⁻⁴
the inclusion of CCF increases the result to:
5.95 × 10⁻⁴
This demonstrates an important principle in functional safety engineering:
Redundancy alone does not guarantee reliability unless common cause failures are minimized.
Most Used Safety Architecture: Designing 2 out of 3 Voting Logic in Control Systems
Engineering Practices to Reduce Common Cause Failures
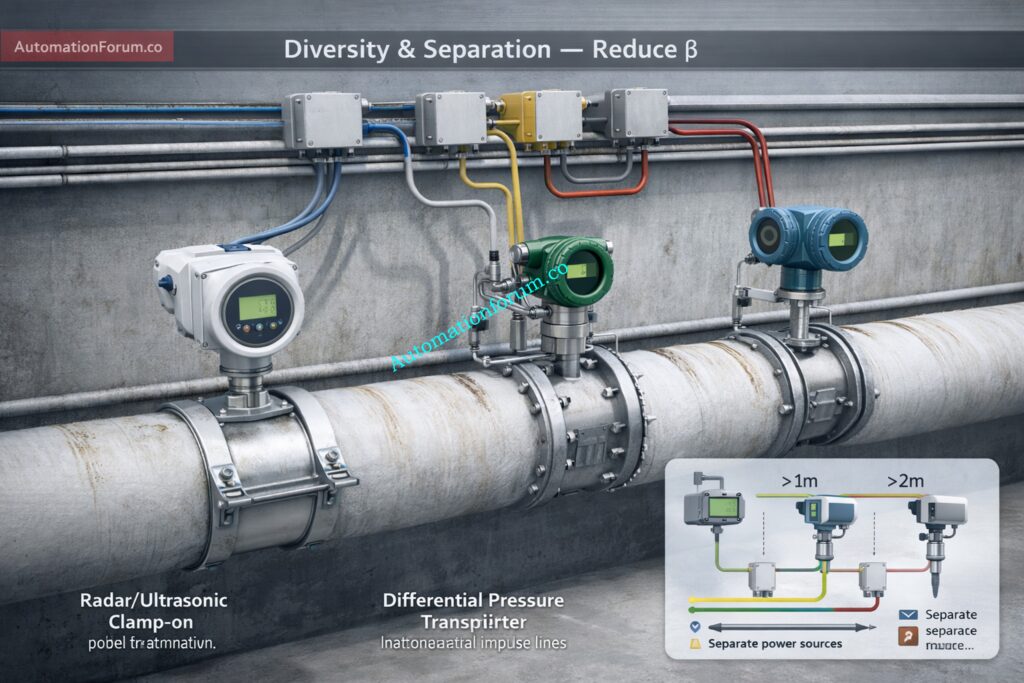
To reduce β and preserve the benefit of redundancy, instrumentation engineers typically apply:
- Technology diversity (e.g., radar level transmitter with differential pressure transmitter)
- Physical separation of transmitters
- Independent impulse lines
- Separate power supplies
- Separate signal cables and I/O modules
- Staggered proof-test intervals
During SIL verification, a Common Cause Analysis (CCA) is performed to justify the selected β-factor and confirm that the redundant architecture genuinely reduces the overall risk.
Engineer’s Quick Tool: 4 to 20 mA Transmitter Output Process Value Calculator
Implementation Best Practices for Redundant Transmitter Systems
Key Design Principles for EPC Instrumentation Engineers
- Physical separation: stagger tappings and manifold locations; avoid common supports that can introduce mechanical CCF.
- Independent power and grounding: separate UPS/PSUs and isolated earthing to prevent electrical single-point failures.
- Independent signal routing: separate conduits and junction boxes; different cable trays preferred.
- Robust diagnostics: require HART/fieldbus diagnostics and ensure diagnostic flags pass to SIS.
- Staggered proof tests: avoid simultaneous proof-testing of redundant channels to prevent temporary loss of redundancy.
Vendor Data Requirements for SIL Verification
- Request manufacturer λD, DC, MTTR and field failure data; require factory test certificates and detailed diagnostics descriptions. Include acceptance tests for redundancy features.
Industrial Signal That Never Dies: Why Engineers Still Trust the 4-20 mA Signal in Automation Systems
Common Mistakes in Redundant Instrumentation Design
- Masking diagnostics via aggregating gateways: design to pass native device health, not a binary “OK” consolidated flag.
- Mounting-induced correlation: identical mounting leading to identical errors mitigate with diverse mounts or position offsets.
- Single spare strategy: lack of spares can extend exposure; include exchange units and calibration kits.
Functional Safety Fundamentals: What is SIS, SIF and SIL? An In-Depth Guide to Functional Safety
Practical Case Study – Redundant Flow Measurement for Furnace Protection
Process Scenario and Safety Requirement
Scenario: high-pressure steam header low-flow detection required SIL 2 to prevent furnace damage. Consequence: potential tube overheating and production loss.
Selection of 2oo3 Architecture with Technology Diversity
Chosen architecture: 2oo3 using two vortex flowmeters and one ultrasonic clamp-on (diverse tech). Justification:
- Vortex meters provide primary reliable measurement; ultrasonic adds independence and is non-intrusive.
- Diversity reduces β and addresses different failure modes (mechanical clogging v. electronics).
Reliability Estimation and Beta Factor Consideration
- Per-device P = 1×10^-2, β conservatively estimated 0.03 due to diversity. Approximate 2oo3 combinatorial corrected PFD ~ 4×10^-4 (rounded) after including β and shorter proof-test (T=6 months) and DC improvements.
Maintenance and Diagnostic Monitoring Strategy
- Quarterly diagnostic trend review, annual SIS trip proof-test, and immediate exchange of any trending device. Keep hot spare and calibration exchange kit.
SIL Verification Simplified: SIF PFDavg / SIL Verification – Complete Guide + Online Calculator
Design Checklist for Redundant Transmitter Systems
Design review checklist:
- Define target SIL and justify architecture in SRS.
- Require λD, DC and MTTR from vendors.
- Choose MooN and document voting semantics.
- Perform CCA/CCF and specify β value justification.
- Design independent routing, power and earthing.
- Document proof-test intervals and SOPs.
- Ensure diagnostics are visible in SIS and DCS.
- Train ops on degraded modes and provide spare strategy.
Test Your Safety Knowledge: Top 25 MCQs on Safety Integrity Level (SIL) for Instrumentation and Control Engineers
Recommended Redundant Architectures Based on Process Criticality
Recommended architectures vs criticality:
| Criticality | Recommended architecture | Key rationale |
| Low | 1oo1 | Cost-effective for non-critical control |
| Medium | 1oo2 or diverse 1oo2 | Availability with some redundancy |
| High | 2oo3 with diversity | Robustness, low spurious trips, degradation support |
Can You Solve Real Plant Problems?: Advanced SIS Troubleshooting Quiz for Process Industries (25 MCQs with Answers)
Designing Reliable Redundant Transmitter Systems
- Redundant transmitters are a deliberate tool for balancing availability, safety and operational cost.
- Use MooN voting, realistic β and DC values, vendor data, and formal SIL verification to justify designs.
- Immediate next steps for I&E teams: run a Common Cause Analysis, update loop drawings to show physical independence, and perform SIL verification with documented assumptions.
- Implement disciplined proof-test and diagnostics governance to maintain the claimed PFD performance throughout the lifecycle.
Dangerous if Misused: IEC 61511 Safety Bypass And Override in Instrumentation and Control System Maintenance
FAQ on Redundant Transmitters, CCF, Diagnostics and Proof Testing
What are redundant transmitters in process instrumentation?
Redundant transmitters are several sensors that measure the same process variable to make sure it works better and is safer.
They allow systems to continue operating even if one transmitter fails, which is common in SIS and critical control loops.
What is MooN voting logic in transmitter redundancy?
MooN (M-out-of-N) voting logic determines how many transmitters must agree before a control action occurs.
For example, 2oo3 voting requires two out of three transmitters to confirm the condition, improving fault tolerance.
What is Common Cause Failure (CCF) in redundant transmitter systems?
Why are diagnostics important in smart transmitters?
Smart transmitters have built-in diagnostics that can find problems like sensor drift, electronics failure, or mistakes in the configuration.
These diagnostics improve safety integrity and help maintenance teams identify problems before process shutdown occurs.
What is proof testing in safety instrumentation systems?
Scheduled proof testing checks that safety devices work correctly.
Refer the below for the Intrinsic Safety Protection Systems: Understanding Ex ia, Ex ib, and Ex ic