Home Blog Page 2

DP Calculator for Zero Suppression in Open Tank Level Measurement

0
DP Calculator for Zero Suppression in Open Tank Level Measurement
Table of Contents

Open tank level measurement with a differential pressure transmitter is one of the most common level applications in process plants. It is used in water tanks, chemical tanks, storage vessels, utility systems, and many commissioning and maintenance jobs where the liquid is open to atmosphere. In this type of application, the transmitter does not always start at true zero. Often the transmitter is mounted below the low point or below the tank reference elevation, so the measured head at empty condition is already above zero. That is where zero suppression becomes important.

A DP calculator for zero suppression helps instrumentation engineers calculate the correct transmitter range before configuration, loop checking, calibration, and startup. It gives the Lower Range Value, the Upper Range Value, and the span based on tank height, specific gravity, and offset below the HP tap. This saves time in the field, reduces range setting mistakes, and makes open tank level measurement calculation much easier to verify during commissioning.

At AutomationForum.co, this kind of calculation is especially useful for engineers who need a quick and reliable differential pressure level transmitter formula for real plant work, not just theory.

Use this DP Calculator for Zero Suppression to quickly calculate LRV, URV, and Span for open tank level measurement applications. Enter tank height, specific gravity, and offset below the HP tap to determine the correct differential pressure transmitter range for calibration, commissioning, and configuration.

DP Calculator for Zero Suppression Level Measurement | Automation Forum
AUTOMATIONFORUM.CO
Your Trusted Source for Automation Power Tools & Solutions

DP Calculator — Zero Suppression Level Measurement

Calculate LRV, URV, and span for open tank differential pressure level measurement

Open Tank Zero Suppression DP Level

What this calculates

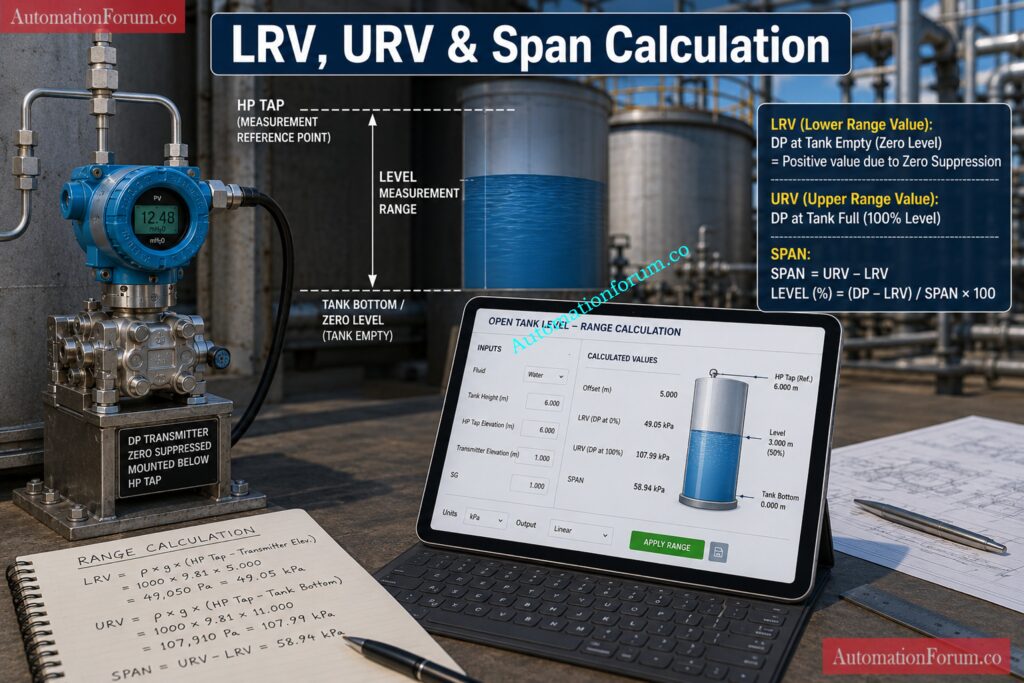
Open-tank zero-suppression where transmitter LRV is the offset head and URV is offset head plus tank height. In simple form: LRV = SG × h1 and URV = SG × (h + h1).

Inputs
mm
mm
Results
Enter values above to see results.
LRV
URV
Span
ParameterValueUnit
No results yet

Formula used — open tank zero suppression

LRV = SG × h1
URV = SG × (h + h1)

The transmitter range spans from the offset head at empty to offset head plus full tank height at 100% level.

What Is Zero Suppression in Open Tank Level Measurement?

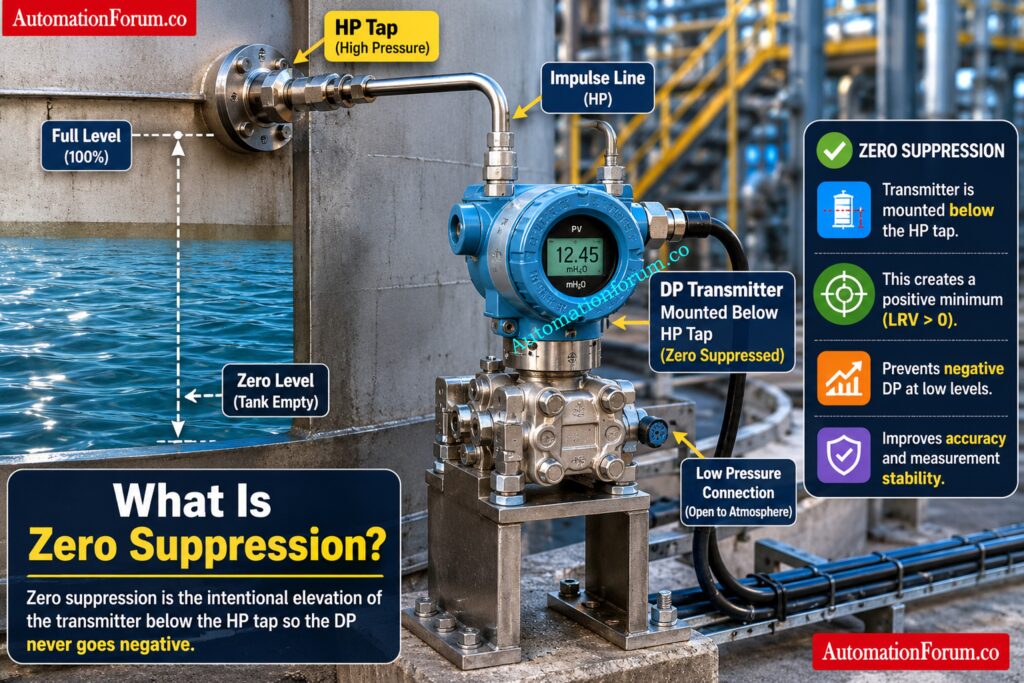
Zero suppression is the adjustment of a differential pressure transmitter range when the transmitter is installed below the HP tap or below the reference point in an open tank level measurement application. In this condition, the transmitter already sees liquid head even when the tank is empty. Because of that, the transmitter does not start from true zero. The lower range value is shifted upward to match the static head created by the installation elevation.

Unlock wet leg DP results before mistakes cost time: DP calculator for Closed tank level measurement – Wet Leg system

Why Zero Suppression Is Required in Differential Pressure Level Measurement

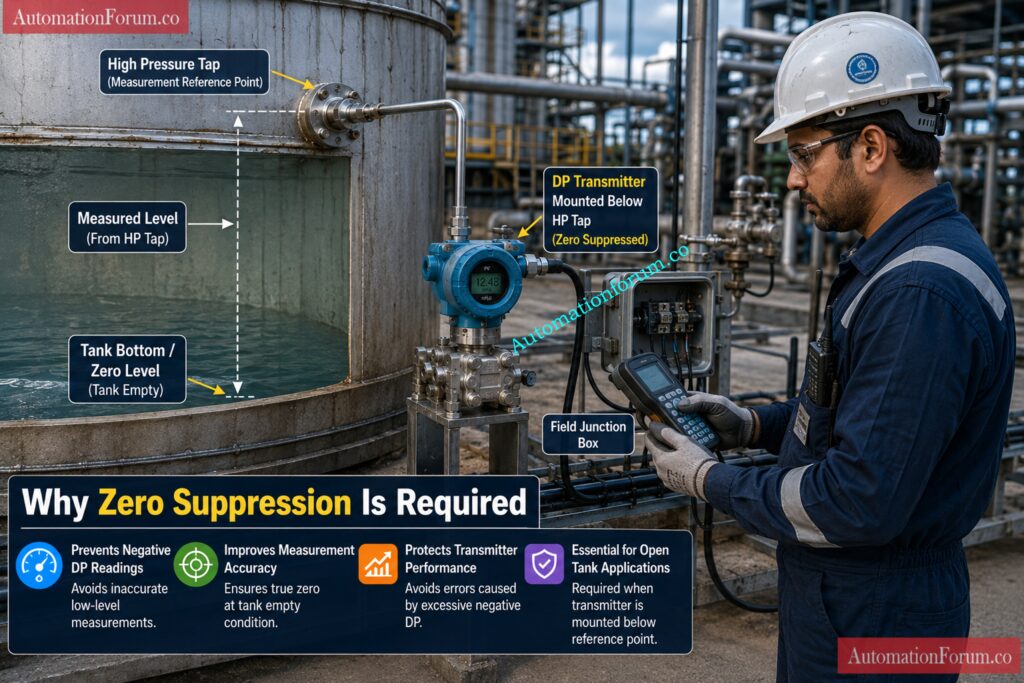
Zero suppression is required because the transmitter must reflect the actual pressure at empty tank condition, not an assumed zero pressure. If the transmitter is mounted below the tank bottom or below the HP tapping point, the liquid column above the transmitter creates pressure even when there is no level in the tank. Without zero suppression, the range setting will be wrong and the displayed level will not match the actual process condition.

Crack dry leg closed tank readings in minutes: DP calculator for Dry leg Level measurement – closed tank

In open tank level measurement, zero suppression is very important because the tank is open to atmosphere and the low pressure side is usually vented to atmosphere. The measured pressure on the high pressure side depends on the liquid head above the transmitter location. If the transmitter is installed below the reference point, the empty tank condition still produces a positive pressure. Proper zero suppression is important for accurate LRV, URV and span setup, dependable level indication, correct transmitter design and superior commissioning outcomes.

Master open tank level calculations without confusion today: DP calculator for open tank level measurements

A DP calculator for zero suppression level measurement is a practical technical tool for calculating the right transmitter range for open tank applications. Determining the span, Lower Range Value and Upper Range Value depending on tank height, specific gravity and the offset below the HP tap helps. This calculator helps engineers to prevent range setting errors during loop inspection, transmitter calibration, commissioning and control system configuration. It saves time in the field and ensures the DP transmitter is adjusted to the actual installation and process circumstances.

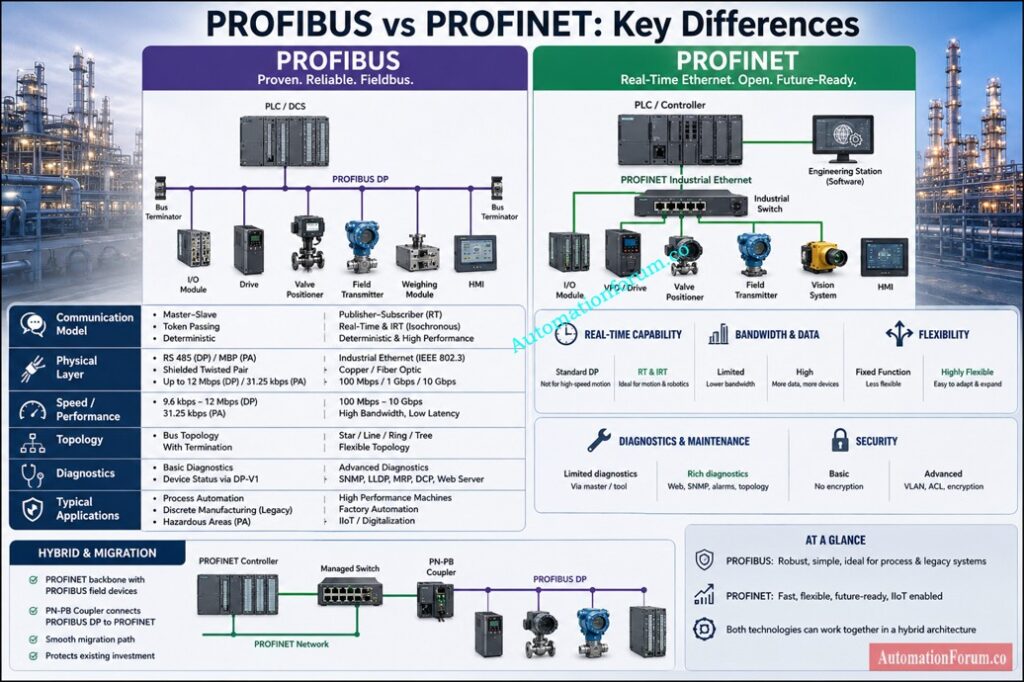
Design cleaner Profibus networks with this smart calculator: Profibus Segment Calculator for DP and PA Network Design

Use this DP calculator for zero suppression when you are working with an open tank level measurement application and the differential pressure transmitter is installed below the HP tap or reference point. In this condition, the transmitter does not start from true zero because it already senses liquid head at empty tank condition.

This calculator is also useful during transmitter configuration, loop checking, commissioning, and field calibration. It helps the engineer to compute the right LRV, URV and span before setting up the transmitter output or scaling the level value in the control system.

Convert pressure changes into flow without trial-and-error:Flowrate to Differential Pressure (DP) Calculator

The calculator is widely used in various industrial applications for open tank level measurement systems. It is often used on water tanks, chemical tanks, process vessels, storage tanks and utility tanks where the liquid level is detected by a differential pressure transmitter.

It finds wide application in industries like oil and gas, chemical processing, water treatment, power plants, food processing, pharmaceuticals, and general process automation. In all these applications the need of correct range setup for dependable level indication and steady transmitter operation is discussed.

Get interface level values fast, accurate, and usable: Interface level calculator from Differential pressure (DP)

This calculator is used by Instrumentation Engineers, Process Engineers, Commissioning Engineers, EPC Engineers, Maintenance Engineers and Calibration Technicians. It is also handy for students and trainees who studying the industrial level measurement and transmitter range computation.

It is used by field engineers to verify transmitter settings. Commissioning teams use it during startup. Maintenance teams use it when checking or recalibrating existing instruments. Design engineers use it during project engineering and range selection.

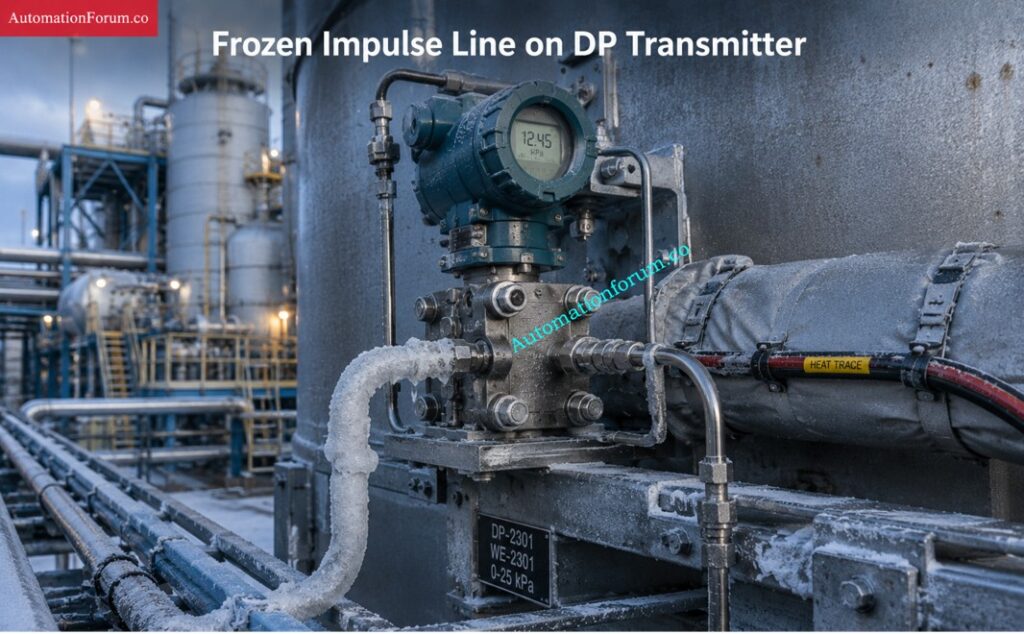
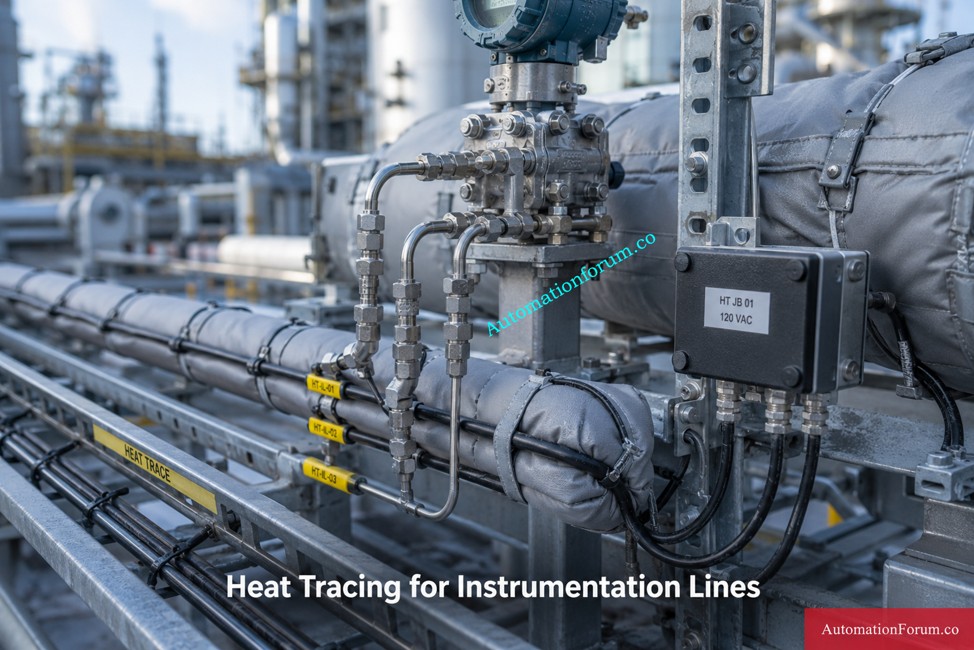
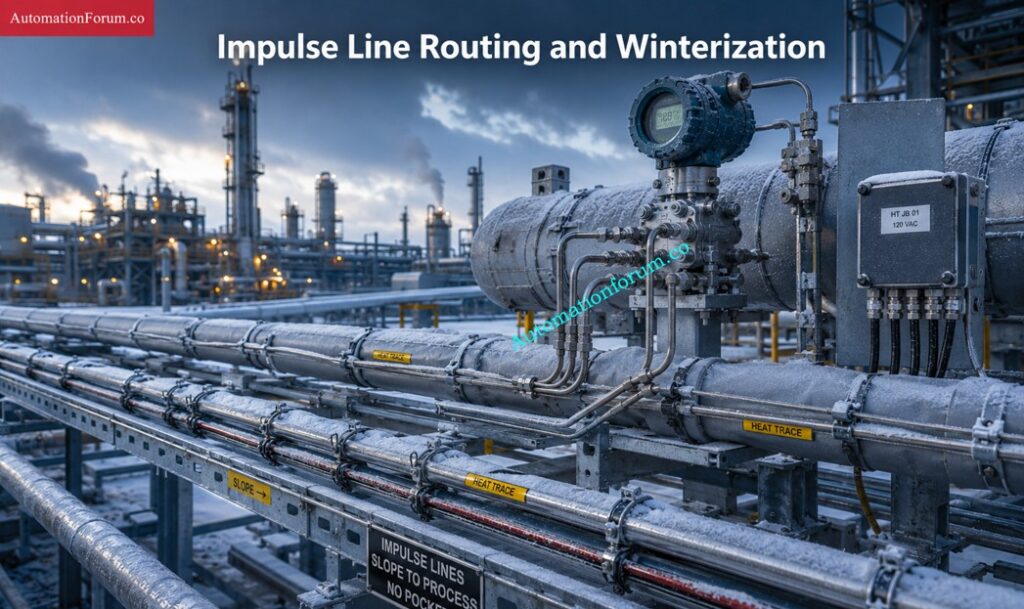
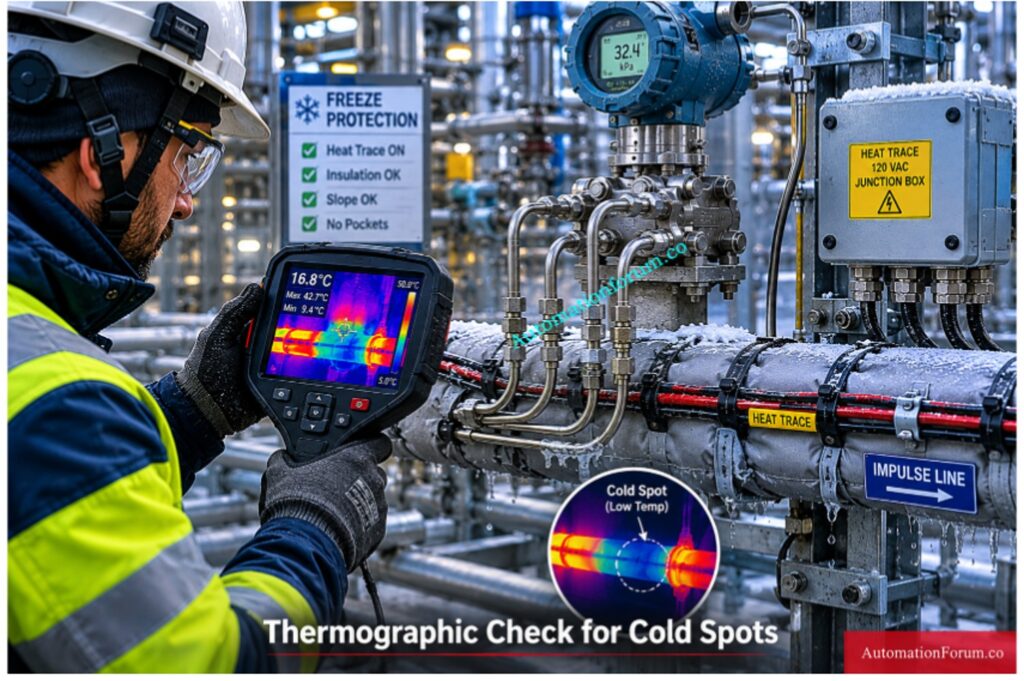
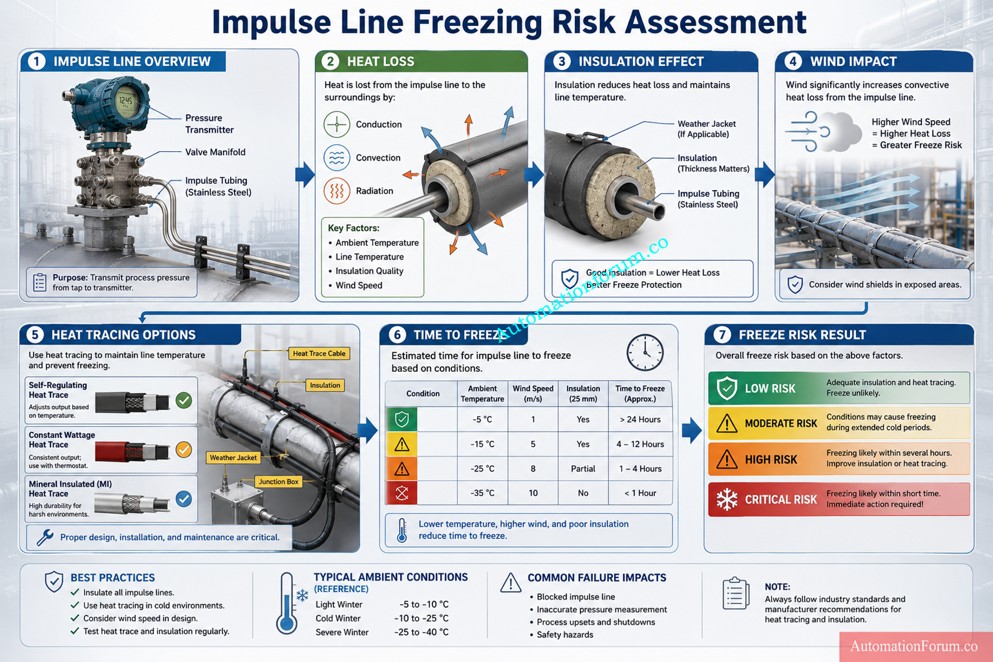
Beat impulse line freezing before your loop fails: Impulse Line Freezing Risk and Heat Tracing Calculator for Instrumentation Engineers 

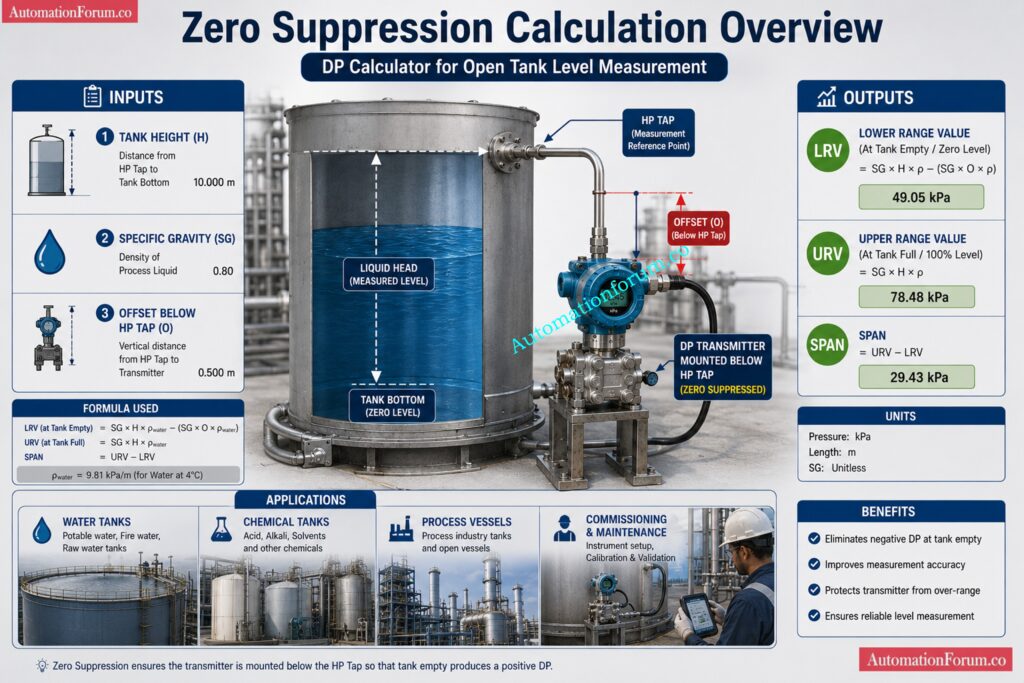
The calculator uses three main inputs.

  • Tank height is the total liquid level range from empty to full in the tank.
  • Specific gravity is the density of the liquid compared with water.
  • Offset below the HP tap is the vertical distance between the transmitter and the high pressure reference point.
  • These inputs are essential because they determine the head pressure seen by the transmitter at empty and full conditions.

Find hidden DP transmitter faults with this checklist: Step-by-Step Troubleshooting Checklist for Closed Tank DP Type Level Transmitter

The calculator gives three important outputs.

  • LRV is the lower range value, which is the pressure at empty tank condition.
  • URV is the upper range value, the pressure at full tank condition.
  • The span is the difference between the URV and the LRV, and it is the transmitter’s full scale range.
  • These outputs are utilized for transmitter range setting, scaling, calibration and loop checking. 
  • They help ensure that the DP transmitter is configured correctly for zero suppression in open tank level measurement.

Calibrate displacer transmitters faster with proven dry steps; Displacer Level Transmitter Calibration Calculator for Dry Calibration Step by Step Guide

This calculator is built for open tank level measurement using a DP transmitter where the transmitter is installed below the reference tapping point. The logic is simple and practical.

The main inputs are tank height, specific gravity, and offset below the HP tap.

Tank height means the full liquid height from empty to full level. In level applications, it is usually the effective measuring range of the tank.

Specific gravity is the ratio of the liquid density to water density. It tells the transmitter how much pressure is created by the liquid column.

Offset below the HP tap means the vertical distance between the transmitter and the bottom reference point or HP tap. This offset creates head even when the tank is empty.

The calculator then gives:

  • LRV, which is the pressure seen by the transmitter at zero level
  • URV, which is the pressure seen at full level
  • Span, which is the difference between URV and LRV
  • In physical terms, zero suppression means the transmitter zero point is shifted upward because the transmitter already sees positive pressure at empty tank condition. Instead of starting from zero, the transmitter starts from the pressure created by the offset head.

Stop grounding noise issues before they wreck signals: Shield Grounding Noise Calculator for Instrumentation: A Practical Engineer Guide

Zero Suppression Formula for Open Tank Level Measurement

The formula used in this calculator is straightforward and very useful in day to day instrumentation level calculation.

For an open tank:

  • LRV = SG × h1
  • URV = SG × (h + h1)

Where:

  • SG is the specific gravity of the liquid
  • h is the tank height
  • h1 is the offset below the HP tap

The span is:

  • Span = URV minus LRV

This simplifies to:

  • Span = SG × h

That means the offset changes the starting point and ending point of the transmitter range, but it does not change the span.

Here is the engineering meaning of the formula.

At empty tank condition, the transmitter still sees the pressure from the liquid column above it if it is mounted below the reference point. That pressure is the LRV. When the tank reaches full level, the transmitter sees the pressure from the full liquid height plus the offset. That pressure is the URV.

So the offset below the HP tap directly pushes both LRV and URV upward by the same amount. This is why zero suppression in level measurement is very common in open tank applications.

This is also why the calculator is useful for LRV and URV calculation for DP transmitter selection and configuration. It helps you define the exact transmitter range before entering values into the field device.

Catch earth fault current risks in intrinsic safety loops: IS Barrier Earth Fault Current Calculator | Intrinsic Safety Loop Design Tool

Zero Suppression Calculation

Let us take a realistic industrial example for open tank level measurement.

Suppose a water based process tank has:

  • Tank height = 3000 mm
  • Specific gravity = 0.85
  • Offset below HP tap = 500 mm

Using the formula:

  • LRV = SG × h1
  • LRV = 0.85 × 500
  • LRV = 425 mmWC

Now calculate the URV:

  • URV = SG × (h + h1)
  • URV = 0.85 × (3000 + 500)
  • URV = 0.85 × 3500
  • URV = 2975 mmWC

Now calculate the span:

  • Span = URV minus LRV
  • Span = 2975 minus 425
  • Span = 2550 mmWC

Practical meaning:

  • At empty tank, the transmitter should read 425 mmWC.
  • At full tank, the transmitter should read 2975 mmWC.
  • The transmitter span is 2550 mmWC.
  • This is the correct range for configuration when the transmitter is installed below the HP tap. The result also shows an important point: even when the tank is empty, the transmitter does not read zero because of the offset head. That is the essence of zero suppression.

Measure earthing resistance the right way, every time: Instrument Earthing Resistance Calculator for Process Industries Complete Engineering Guide

During loop checking, the first question is often whether the transmitter range matches the installed elevation. If the LRV and URV are wrong, the signal may look correct in the control system at first glance but will fail when the tank level changes.

This calculator helps the commissioning team quickly verify the expected range before applying pressure or simulating level. It is especially useful when setting the 4 to 20 mA output, checking the scaled value in the DCS or PLC, and confirming the transmitter engineering units.

It also reduces confusion between the actual process level and the pressure seen by the transmitter. That is a common source of errors during startup.

Size control valves correctly and avoid costly oversizing: Control Valve Sizing Calculator: Complete ISA S75.01 Cv Calculation Guide for Instrumentation Engineers

How This Calculator Helps in Field Calibration and Range Setting

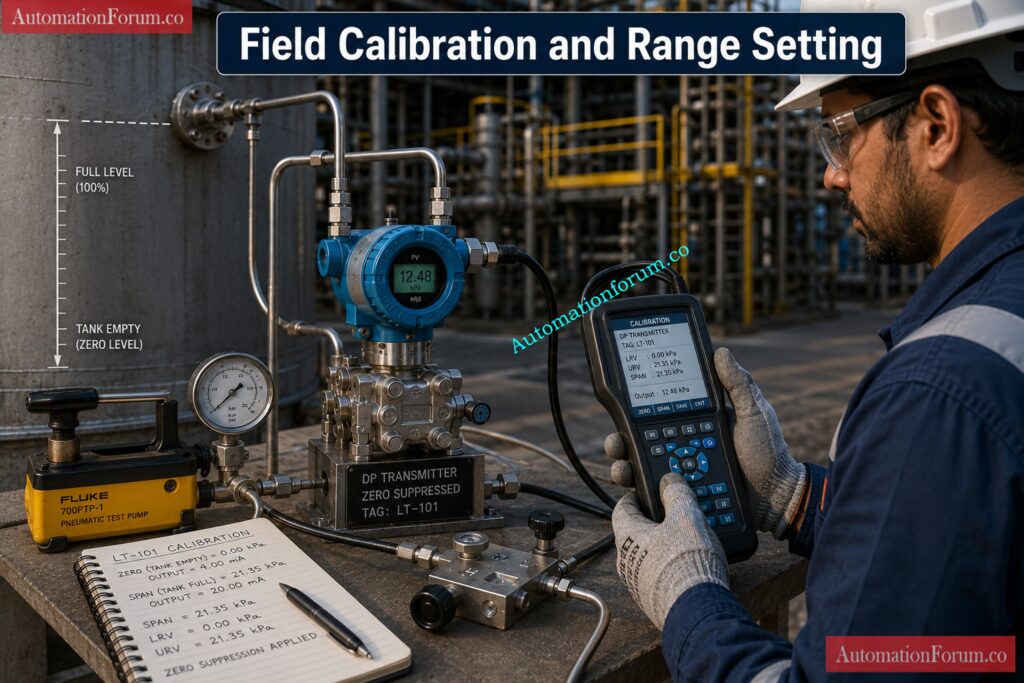
Field calibration becomes much easier when the correct LRV and URV are known in advance. The technician can use the calculated values to set the transmitter range, trim the output if needed, and confirm whether the live reading is correct against the applied head.

For range setting, the calculator helps the engineer define the exact zero and full scale pressure points. This is especially valuable when using a handheld communicator, HART configurator, or bench calibration setup.

In short, the calculator supports better calibration accuracy, fewer rework cycles, and faster commissioning.

Dry-calibrate displacer levels with a sharper weight-loss method: Dry Calibration of Displacer Level Troll Using Weight Loss Calculator

Open tank level measurement calculation using a DP transmitter is used across many industries.

  • Water tanks: In utility systems, the method is used for clean water, filtered water, and service water tanks. The calculation is simple, but the transmitter must still be ranged correctly.
  • Chemical tanks : In chemical facilities, the density of liquids may be different from water, hence specific gravity becomes important. A tiny inaccuracy in SG can result in a considerable range error.
  • Process vessels: DP transmitters are widely used for dependable level indication in open vessels in batch and process systems especially where radar or ultrasonic sensors are not preferred.
  • Open storage tanks: In storage applications the liquid might be open to atmosphere and the transmitter must be set up for the correct head pressure and offset.
  • Zero suppression dp calculator is a quick reference for the technical teams involved in the design, installation and maintenance work on AutomationForum.co.

Inspect impulse lines before failures shut everything down: Impulse Line Inspection Step By Step Procedure For DP Transmitters

Common Mistakes in Zero Suppression Calculation
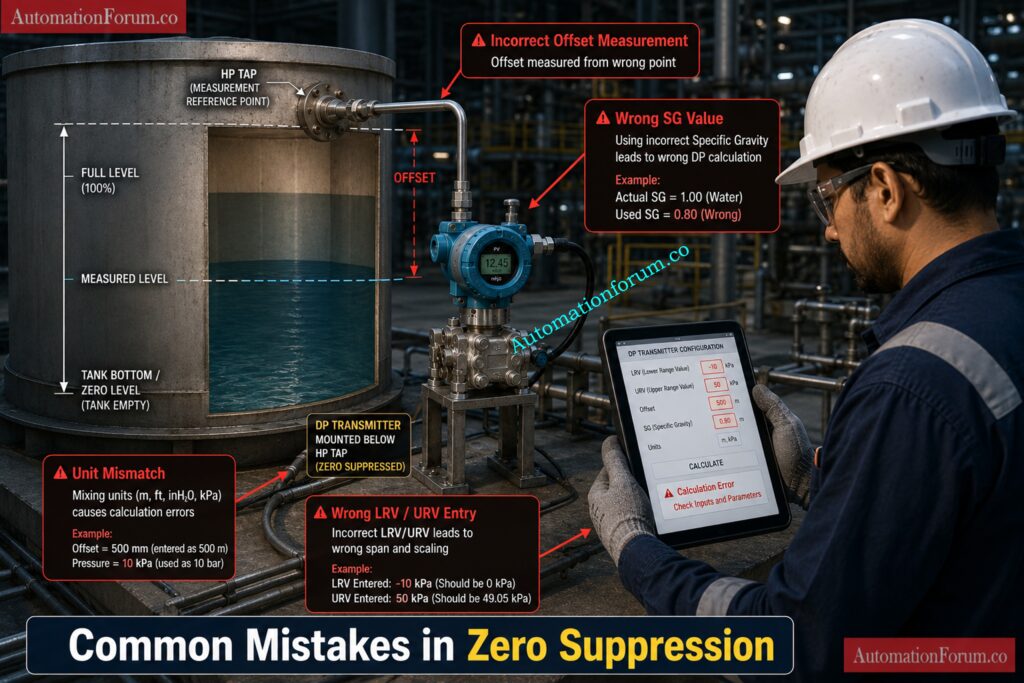
  • Wrong SG number : A lot of engineers use water specific gravity as default, even if the liquid is heavier or lighter. This gives an incorrect LRV and URV.
  • Wrong offset measurement: The offset below the HP tap must be measured vertically and carefully. A small mistake here changes the zero point.
  • Confusing zero suppression with zero elevation: Zero suppression is used when the transmitter sees positive pressure at empty condition. Zero elevation is a different situation and should not be mixed with it.
  • Unit mismatch: Some teams enter tank height in meters, offset in millimeters, and expect the result in mmWC without conversion. This creates range errors.
  • Ignoring installation elevation: If the transmitter is mounted higher or lower than expected, the actual head may differ from the design drawing.

Dry-calibrate displacer transmitters with less guesswork, more accuracy: Displacer Level Transmitter Calibration Calculator for Dry Calibration Step by Step Guide

  • When transmitter reading is unstable, check for impulse line blockage, trapped air, venting issues, or fluctuating liquid surface. In open tank applications, even small installation problems can create noisy readings.
  • When output does not match actual level, verify the SG, the transmitter location, the tap point, and the calibration range. Most problems come from wrong range setup rather than from the sensor itself.
  • When range calculation seems wrong, first confirm the formula, then confirm the units. Many field issues come from mixing millimeters, meters, and pressure units without conversion.
  • If the transmitter shows correct behavior at one point but not across the full range, check whether the lower and upper range values were entered in the correct order.

Convert mass flow units instantly across every scale: Mass Flow Rate Converter : Convert kg/s, lb/min, SCFM, L/h and 50+ Units

A DP calculator for zero suppression helps calculate the correct LRV, URV, and span for level transmitters installed below the reference point in open tank applications.
It ensures accurate transmitter configuration, calibration, and commissioning by accounting for installation offset.

Zero suppression is needed because the transmitter senses positive hydrostatic pressure even when the tank level is zero.
Without zero suppression, the transmitter range and displayed level will be inaccurate.

The formulas are LRV = SG × h₁ and URV = SG × (h + h₁), where SG is specific gravity.
These equations calculate the pressure seen by the transmitter at empty and full tank conditions.

Span is the difference between the Upper Range Value (URV) and Lower Range Value (LRV).
For open tank zero suppression applications, Span = SG × h.

Size valve actuators with confidence, safety, and precision: Valve Actuator Sizing Calculator – Complete Engineering Guide for Torque, Safety Factor & Gear Ratio Selection

The transmitter is mounted below the HP tap, so it experiences liquid head pressure even when the tank is empty.
This static pressure shifts the transmitter zero point above true zero.

A change in specific gravity changes the hydrostatic pressure generated by the liquid column.
As a result, the transmitter range and level calculation must be recalculated using the new SG value.

Yes, it is widely used during commissioning, loop checking, and transmitter configuration activities.
It helps engineers verify correct LRV, URV, and span values before startup.

Zero suppression is calculated by multiplying the specific gravity of the liquid by the vertical offset below the HP tap.
Formula: Zero Suppression = SG × Offset Height.

Zero suppression occurs when the transmitter is installed below the reference level and sees positive pressure at zero level.
Zero elevation occurs when the transmitter is installed above the reference point and requires a negative LRV.

DP level is calculated by dividing the measured differential pressure by the liquid specific gravity.
Formula: Level = DP ÷ SG, assuming pressure is expressed in equivalent liquid head units.

Turn differential pressure into flow in seconds: Differential Pressure to Flow Calculator – Complete Interactive Tool for Process Engineers

For reliable open tank level measurement, a correct DP calculator for zero suppression is required. It offers you the correct LRV, URV, and span based on tank height, specific gravity and offset below HP tap. This means better transmitter configuration, faster loop checking, cleaner field calibration, and fewer commissioning errors.

For instrumentation engineers, control engineers, EPC teams and maintenance workers this computation is not only a theory exercise. It is a practical instrument that has a direct impact on plant dependability and measurement precision. Used appropriately, it makes differential pressure level transmitter formula simple, consistent and field ready.

Such material can be a good fit for AutomationForum.co as a solid technical article matching search intent, supporting featured snippet visibility, and targeting working engineers looking for actionable outcomes.

OT Cybersecurity Norms: Complete Guide to IEC 62443, NIST SP 800 82 and Industrial Control System Security

0
OT Cybersecurity Norms: Complete Guide to IEC 62443, NIST SP 800 82 and Industrial Control System Security
Table of Contents

Operational Technology, or OT, is the systems that control, monitor and automate physical industrial operations. These systems are used in manufacturing plants, power stations, oil and gas facilities, water treatment plants, chemical units, utilities and other critical infrastructure environments. OT includes PLCs, DCS, SCADA systems, RTUs, industrial networks, engineering workstations, sensors, actuators, HMIs, and connected field devices.

OT cybersecurity is different from general IT cybersecurity because the main priority is not only confidentiality. In industrial environments, availability, safety, reliability, and process continuity are often more important than anything else. A security event in an office network may cause data loss or downtime. A security event in a plant can stop production, damage equipment, create unsafe conditions, affect environmental compliance, and in some cases threaten human life.

That is why OT cybersecurity norms are becoming mandatory worldwide. Industrial organizations now understand that cybersecurity is not only an IT issue. It is an operational issue, a safety issue, a reliability issue, and a business continuity issue. Modern plants are more connected than ever before, which means the attack surface is expanding. Remote access, cloud integration, vendor support, industrial IoT, wireless systems, and IT OT convergence have all increased the need for strong protection.

For automation professionals, the practical goal is clear. OT cybersecurity has to be implemented in such a way that safeguards the facility and doesn’t hinder production. It has to honor maintenance periods, support legacy equipment, maintain control performance, and work with plant operations. That’s why standards like IEC 62443, NIST SP 800 82, and the NIST Cybersecurity Framework are so vital.

OT cybersecurity is the practice of protecting industrial systems, control networks, and physical processes from unauthorized access, manipulation, disruption and sabotage. This covers the protection of devices and systems that directly impact industrial operations.

Which means:

  • PLCs (programmable logic controllers) that do logic and control equipment
  • DCS platforms for process control of large installations
  • SCADA systems for remote site monitoring and field operations
  • Remote and dispersed control sites with RTUs
  • Operator HMIs for process monitoring and control
  • Industrial switches, routers and firewalls to facilitate plant communication
  • Workstations for control system configuration & maintenance
  • Historians, gateways, protocol converters, and remote access technologies
  • Industrial IoT devices connecting to maintenance and process systems

Expose the Hidden PLC Cyber Threats Right Now: Cybersecurity in PLC Systems – Advanced 25 MCQ Quiz

Much of the OT cybersecurity is critical infrastructure protection as many industrial environments support critical services. If power, water, oil, gas, transportation, or manufacturing systems are disrupted, the effect can spread beyond one facility. That is why OT security must be viewed as part of national and organizational resilience.

In practical terms, OT cybersecurity means asking questions such as:

  • Who can change the PLC logic?
  • Who can connect remotely to the plant?
  • How is vendor access controlled?
  • What happens if one machine becomes infected?
  • How is a control network separated from business systems?
  • How is a safety system protected from accidental or malicious access?

These are not theoretical questions. They are daily engineering questions in modern industrial environments.

Fix SCADA and DCS Switch Requirements Fast: Network Switches requirements in “SCADA” and “DCS” Architecture

OT cybersecurity norms matter because industrial systems are increasingly targeted by cyber attackers. Attackers know that industrial organizations are highly sensitive to downtime. They also know that many industrial systems were designed before cybersecurity became a major concern. Older systems may have inadequate authentication, low visibility, unsupported software or extensive maintenance cycles.

A successful attack on OT can result in:

  • Production downtime
  • Loss of product quality
  • Equipment damage
  • Safety incidents
  • Environmental release
  • Supply chain disruption
  • Financial loss
  • Regulatory penalties
  • Reputation damage

Allocate Switch Ports Before Topology Problems Begin: Network switch port allocation details

One of the main reasons why OT cybersecurity regulations are increasingly relevant is the increase in cyber incidents affecting physical operations. Stuxnet shown that malware may be built to target industrial equipment and physical processes. The Colonial Pipeline incident highlighted how ransomware may have a significant operational impact and cause enterprises to shutdown or curtail key services. These cases changed how industries think about cyber risk.

Another reason is compliance. Governments, regulators, insurers, and customers increasingly expect industrial organizations to prove that they are protecting operational systems. Security is no longer optional. It is part of responsible operation.

Another important factor is the growing connection between IT and OT. In the past, many plants were isolated. Today, many control systems are connected to enterprise networks, cloud platforms, analytics tools, vendors, and centralized monitoring systems. That connectivity improves efficiency, but it also increases exposure. A weak point in one network can become a pathway into another.

OT cybersecurity standards provide a rigorous framework for automation teams. They describe what needs to be secured, how systems should be separated, who should be granted access, how incidents should be handled, and how security should be maintained over time.

Prove Your Control Security Skills With This Challenge: Advanced Quiz on Control System Cybersecurity in Process Industries – Test Your Expertise

Major OT Cybersecurity Standards and Frameworks

One of the key standards for industrial cybersecurity is IEC 62443. It is made specifically for industrial automation and control systems. It is a technique of securing OT settings from the design and procurement to operation and maintenance phases of the lifecycle.

One of the most useful ideas in IEC 62443 is the idea of security tiers. These levels let organizations determine how much protection is needed based on risk.

Not every system needs the same level of security. A high risk process area will need stronger controls than a low risk utility network.

Another important concept is zones and conduits. A zone is a group of systems with similar security requirements. A conduit is the controlled communication path between zones. This is highly practical for industrial network design. This helps engineers break up systems into logical pieces and govern the flow of traffic between them.

The roles of different groups are also defined in the IEC 62443.

Asset owners are accountable for security standards, risk management and for the secure operation of the plant.

System integrators are responsible for secure design, secure implementation and correct setup.

Product providers produce secure goods and provide security support.

This shared responsibility model is very useful in industrial projects because OT security is not the task of one team alone. It involves operations, engineering, maintenance, vendors, cybersecurity teams, and management.

Practical industrial examples of IEC 62443 include:

  • Separating packaging lines into different zones
  • Using firewalls between the plant network and the enterprise network
  • Restricting vendor access to a jump server
  • Defining security requirements in engineering projects before commissioning
  • Monitoring communication between PLC networks and supervisory systems

IEC 62443 is widely adopted because it fits the way real industrial systems are built and operated. It gives organizations a common language for OT cybersecurity.

Choose Baud Rates Correctly Before Signal Errors Grow: Key Factors to Consider When Setting Baud Rate in Modbus Networks

NIST SP 800 82 is a foundational guide for securing industrial control systems. Particularities of OT and ICS contexts are the main focus. NIST recognizes that control systems are not office IT systems. These systems frequently enable continuous operations, involve legacy technology, and have safety and reliability limits.

This guidance covers topics such as:

  • ICS architecture
  • Threats and vulnerabilities
  • Network segmentation
  • Access control
  • Patch management
  • Monitoring
  • Incident response
  • Risk management
  • Recovery planning

What makes NIST SP 800 82 so useful is it does not consider OT security as an IT checklist. It understands that security controls should be applied with an awareness of the impact on operations. In industrial plants, a security change that causes downtime can create more damage than the vulnerability itself if it is not managed properly.

NIST SP 800 82 is valuable for:

It helps the organization build practical protection while preserving reliability and safety.

The core functions are as follows:

  • Identify
  • Protect
  • Detect
  • Respond
  • Recover

In OT contexts these functions can be interpreted extremely practically.

Identify is about recognizing your assets, risks and crucial dependencies. •

Protect involves implementing access control, segmentation, hardening and secure configuration .

Detect means looking for anomalous traffic, unlawful access or suspicious activity.

Respond means to contain a situation safely and quickly.

Recover means to resume operations and check systems are safe to return to normal production.

This approach is particularly effective for plant companies who seek a management level structure to security without compromising operational emphasis. It helps connect cybersecurity with business risk.

See How Remote Work Opens Cyber Doors: Remote Work Cybersecurity: Common Vulnerabilities and How to Prevent Attacks

ISA IEC 62443 Framework and Defense in Depth Strategy

ISA IEC 62443 is widely respected in industrial automation because it combines theory and practical implementation. It is more than a technical document. It is a lifecycle based framework for secure industrial operations.

Its main strengths include:

  • Defense in depth
  • Secure lifecycle approach
  • Risk based protection
  • Continuous monitoring
  • Shared responsibility across stakeholders

This framework is useful for new plants, brownfield modernization, system upgrades, and vendor management. It lets firms set security requirements early, instead of trying to bolt on security after commissioning.

ISA IEC 62443 is extremely useful to the automation specialist since it speaks the language of the industrial project. It supports engineering decision, supplier needs and operational security planning.

Learn the Core Cybersecurity Facts Everyone Skips: Cybersecurity Basics: Types, Threats, and Protection Tips

Network Segmentation Best Practices for OT Security

Network segmentation is one of the most critical OT security procedures. It prevents the transmission of threats and assists in segregating systems by risk and function. In industrial environments, segmentation should not be treated as a nice extra. It should be a core design principle.

A strong segmentation strategy may separate:

  • Enterprise IT systems
  • Industrial DMZ
  • Supervisory systems
  • Control system networks
  • Vendor remote access zones
  • Wireless and IIoT zones
  • Different production areas or units

This kind of separation reduces the chance that one compromised system can reach the entire plant. It also makes troubleshooting and monitoring easier.

Lock Down PLCs Before Attackers Move In: Cybersecurity Standards for PLCs

The Purdue Model is commonly used as a reference for structuring industrial networks. It helps teams think in layers—from the enterprise system down to the field device. It is not a complete security solution on its own but is nevertheless a valuable framework to understand trust boundaries and flow of communication.

The Purdue Model is still used in many industrial security initiatives because it provides a recognizable structure for operations and engineering teams. This is particularly useful when used with current controls such as firewalls, access gateways and monitoring tools.

Security zones and conduits are key ideas within IEC 62443. A zone groups assets with similar security needs. A conduit controls how data moves between zones.

For example, one production line may be one zone, with its own PLCs, HMIs, and I O modules. Another line may be another zone. The connection between them should be controlled, monitored, and limited to necessary traffic only.

This approach reduces risk and provides the business with a clean architecture for access control and monitoring.

A DMZ in an industrial environment is a managed buffer between the IT side and OT side. It can host systems that need to communicate with both environments, such as historians, file transfer services, patch relay servers, and remote access brokers.

Firewalls should be configured to allow only required traffic. Open access should be avoided. Default allow rules should not be used in sensitive OT environments. Every allowed connection should have a reason.

A properly designed DMZ reduces direct exposure of control systems and creates a safer path for communication between enterprise and operational networks.

Access control is one of the simplest and strongest security measures available. That means only the right individuals can get to the right systems at the right time.

Best practices include:

  • Role based access control
  • Least privilege
  • Unique user accounts
  • Multi factor authentication
  • Temporary vendor access
  • Account review and revocation

Shared accounts should be removed wherever possible. If shared accounts are unavoidable in some legacy environments, they should be tightly controlled and monitored.

Test Your ICS Defense Readiness Before Crisis Hits: ICS/SCADA OT Cybersecurity Self-Assessment: NIST-Based Procedure for Critical Infrastructure

Asset Inventory Management for Operational Technology

You cannot protect what you do not know exists. A complete OT asset inventory is essential for cybersecurity.

The inventory should include:

  • Device name
  • Device type
  • Location
  • Network address
  • Firmware version
  • Operating system
  • Owner
  • Criticality
  • Support status
  • Maintenance schedule

This is important because many plants have hidden or forgotten devices. Untracked devices create security blind spots. An accurate inventory gives the organization the foundation for patching, monitoring, and risk assessment.

OT vulnerability management must be risk based. In a plant, not every vulnerability can be patched immediately. Some systems may be too critical to restart without planning. Some devices may no longer be supported by the vendor. Some patches may require testing before deployment.

That is why OT vulnerability management should include:

  • Risk assessment
  • Vendor consultation
  • Patch testing
  • Maintenance planning
  • Compensating controls
  • Temporary isolation when needed

The goal is not only to patch quickly. The goal is to reduce risk without creating operational instability.

Incident Response Planning for OT Environments

Incident response in OT must be designed for industrial reality. A containment action that is appropriate for IT may not be safe in OT. For example, disconnecting a critical system without planning may cause a process upset.

An OT incident response plan should include:

  • Detection
  • Escalation
  • Containment
  • Safety verification
  • Communication
  • Recovery
  • Post incident review

It should also define who has authority to act, what systems can be isolated, how production teams are informed, and how a safe restart is confirmed.

Decode OT Security Protocols Before Your Plant Pays: Protocols and Standards in Industrial Automation: A Guide to OT Cybersecurity 

Operational discipline is the foundation of robust OT cybersecurity. Some of the more effective practices are:

  • Change default credentials immediately and use strong passwords.
  • Apply multi factor authentication to remote access and privileged accounts.
  • Control vendor access through approved, monitored, and time limited paths.
  • Use network monitoring to discover abnormal communication or unrecognized devices.
  • Back up logic, recipes, configuration files and project data on a regular basis.
  • Train engineers, operators and maintenance staff to be alert to cybersecurity.
  • Use formal change management to control all changes. Document and approve all changes.
  • Use configuration baselines for controllers, servers, firewalls and workstations.
  • Secure engineering workstations with endpoint restrictions and limited access.
  • Review and eliminate any unneeded accounts and privileges.
  • Minimize removable media and scan USB devices before usage.
  • Look for unlawful activity of software or protocols.
  • Test recovery techniques in advance of a genuine incident.
  • Conduct frequent risk reviews as the plant develops.

These techniques are not difficult, but they demand discipline. In OT generally the simpler is more consistent.

Compare PROFIBUS and PROFINET Before Choosing Anything: PROFIBUS vs PROFINET: Complete Industrial Network Comparison

Many industrial plants are still running on obsolete PLCs, controllers and HMI platforms that were not designed with cybersecurity in mind. These systems might have inadequate authentication, outdated protocols or restricted support for updates.

The engineering workstations and supervisory systems still run on unsupported operating systems. This is a danger because there may not be anymore security updates and vendor support.

Many plants cannot be halted on command. There are also times when security updates have to wait for a planned shutdown, outage or maintenance window. That makes patching/upgrading more complex.

Remote support and vendor connectivity might be a weak spot if access is not strictly managed. Vendors typically require access but that should be managed carefully.

With IT/OT convergence, security advancements in one sector might impact the other. This introduces complexity that must be coordinated amongst teams.

More sensors, smart instruments and monitoring devices boost visibility and efficiency, but also present new attack avenues.

OT systems depend on hardware, software, integrators, and suppliers. A weakness in the supply chain can affect the plant even if internal controls are strong.

These challenges are common in industry. The answer is not to avoid all technology. The answer is to manage risk intelligently.

Calculate Segment Limits Before Your Network Breaks: Profibus Segment Calculator for DP and PA Network Design

OT Cybersecurity Compliance Checklist for Industrial Organizations
Security AreaCompliance StatusRecommended Action
Asset inventoryNot startedCreate a complete list of OT assets
Network segmentationPartialSeparate IT and OT networks properly
DMZ architecturePartialBuild a controlled industrial DMZ
Remote accessPartialUse MFA and jump server access
Password policyPartialRemove default and shared passwords
Privileged accountsNot startedRestrict admin rights
Backup strategyPartialVerify backups for logic and configurations
Patch managementPartialTest and approve patches before deployment
Vulnerability reviewNot startedBuild a risk based review process
LoggingPartialCollect and review event logs
MonitoringPartialTrack unusual OT traffic
Incident response planNot startedCreate OT specific response procedures
Vendor managementPartialControl and record vendor access
Configuration managementPartialMaintain secure baselines
Removable media controlNot startedRestrict USB and external media use
Security trainingPartialTrain plant and maintenance staff
Recovery testingNot startedTest restoration and failover procedures

This checklist is most useful when it becomes part of regular plant audits, maintenance planning, and management review. It should not remain a paper exercise.

Zero trust is gaining momentum because it assumes no device or user should be trusted automatically. Every access request must be verified. In OT, this must be implemented carefully, but it offers a strong model for reducing unnecessary trust.

Artificial Intelligence and advanced analytics are being increasingly employed to detect anomalies in traffic, access behavior and process data. This may also help to detect threats sooner than manual screening alone.

More organizations are building security operations capabilities specifically for industrial environments. These teams understand both cyber risk and process impact.

Security information and event management tools are being connected more closely to OT networks so that events can be correlated across systems.

Industrial IoT will continue to grow, but future deployments will need stronger identity, secure communication, lifecycle control, and device visibility.

Digital twins and simulation environments can be used to test security scenarios, validate defenses and train teams in a way that does not impact live production.

More enterprises are moving to IEC 62443 as it presents a practical foundation for lifecycle based OT security.

We expect governments and regulators to continue to enhance standards for industrial cyber resilience, reporting and critical infrastructure security.

The future of OT security will be more linked, more watched and more regulated. The more an organization prepares, the better it will be able to sustain its resilience.

Pick the Right Protocol Before Downtime Costs Rise: Modbus TCP/IP vs Profinet: Which Protocol Suits your Industrial Network Best?

The OT Cybersecurity Framework is a methodical strategy to safeguard industrial control systems through risk management, asset visibility, threat detection, incident response and recovery processes. NIST SP 800 82 and IEC 62443 standards often consistent with NIST Cybersecurity Framework.

OT (Operational Technology) is the hardware and software that monitors and controls physical industrial processes. This includes PLCs, DCS, SCADA systems, RTUs and industrial networks. OT security aims to secure these systems from cyber attacks while guaranteeing safety and ongoing reliable operation.

Best practices for OT cybersecurity include: Network segmentation Multi factor authentication Asset inventory management Continuous monitoring Secure remote access Vulnerability management Regular backups These techniques enhance Industrial Control System Security and minimize cyber risk.

IEC 62443 is the worldwide standard for cybersecurity designed primarily for Industrial Automation and Control Systems. It establishes requirements for asset owners, system integrators and product suppliers to safeguard OT environments across their lifecycle.

There is no single ISO standard that is solely focused on OT security. What Standards are used by Organizations? ISO 27001 for Information Security Management IEC 62443 for Industrial Control System and Operational Technology Security

ISO 31000 is broad organizational risk management principles that can be applied across many industries. NIST 800 37 is the Risk Management Framework for information systems and cybersecurity activities. The NIST 800 37 is more specific in security control implementation and risk assessment operations.

OT cybersecurity is the safeguarding of industrial control systems, operational networks, and physical processes from cyberattacks, unlawful access, and operational interruption. It guarantees safety, availability, dependability and business continuity in industrial plants.

IEC 62443 is a holistic cybersecurity standard for Industrial Automation and Control Systems that includes security standards, risk management methods, zones and conduits, and secure lifecycle approaches. It’s frequently used in industrial, energy and critical infrastructure industries.

OT security focuses on operational availability, process safety, and equipment reliability, while IT security focuses on ensuring the confidentiality and integrity of data. An OT cybersecurity event can have direct impacts on physical operations and manufacturing systems.

Network segmentation separates important industrial assets and confines the spread of cyber threats across OT environments. It increases Industrial Network Security by managing the flow of communications between business systems and control networks.

Security zones are collections of assets that have comparable cybersecurity needs, and conduits are regulated communication paths between security zones. This IEC 62443 concept guides enterprises in establishing safe and managed OT network infrastructures.

The Purdue Model is a layered architecture which is used to divide business systems, supervisory systems, control systems and field devices in industrial networks. It also helps in secure network architecture and reducing cyber security threats in Operational Technology environments.

OT cyber threats include ransomware, malware, external remote access, insider threats, supply chain assaults, phishing campaigns, and attacks on PLCs, SCADA systems, and industrial communication networks.

OT “Zero Trust” is a cybersecurity method that does not trust any user, device, or connection by default. All access requests should be continuously checked, authenticated and permitted before interacting with industrial systems.

OT cybersecurity standards are necessary for current industrial operations. But as facilities become increasingly networked, the possibility of cyber disruption increases. Industrial enterprises need security strategies that protect data, equipment, process integrity, safety and uptime.

IEC 62443, NIST SP 800 82 and NIST Cybersecurity Framework provide a solid framework for industrial cybersecurity. They assist firms develop secure infrastructures, manage risk, protect vital assets and respond efficiently to incidents.

For automation professionals, the most effective approach is practical and disciplined. Know your assets. Segment your networks. Control access. Monitor continuously. Test recovery. Train the team. Review risk often. That is how OT cybersecurity becomes part of operational excellence.

Top 25 Advanced Safety PLC MCQs for Instrumentation and Functional Safety Engineers

0
Top 25 Advanced Safety PLC MCQs for Instrumentation and Functional Safety Engineers

Safety PLC systems are essential to modern process industries to protect humans, equipment, the environment and production processes. In high risk sectors including oil and gas, LNG, refinery, chemical and power plants, Safety Instrumented Systems enable reduction of operational hazards thanks to reliable shutdown logic, diagnostics and fault resistant architectures. 

Safety PLC systems are essential to modern process industries to protect humans, equipment, the environment and production processes. In high risk sectors including oil and gas, LNG, refinery, chemical and power plants, Safety Instrumented Systems enable reduction of operational hazards thanks to reliable shutdown logic, diagnostics and fault resistant architectures. 

Top 25 Advanced Safety PLC MCQs for Instrumentation and Functional Safety Engineers

Automation specialists need to understand SIL verification, IEC 61511 lifecycle requirements, proof testing, voting logic, redundancy, and fail safe engineering. The advanced quiz is designed to test instrumentation and automation experts with real-world industrial scenarios, troubleshooting ideas and functional safety engineering techniques that are commonly employed in modern industrial automation projects.


1 / 25

During functional safety audits, what is commonly verified?

2 / 25

Which issue commonly causes nuisance trips in SIS applications?


3 / 25

What is the major advantage of redundant communication in Safety PLC systems?


4 / 25

What is the primary role of final elements in a Safety Instrumented Function?

5 / 25

Which engineering activity typically follows HAZOP in functional safety projects?


6 / 25

Why are separate power supplies often used for redundant Safety PLC channels?


7 / 25

What is the biggest risk of bypassing a Safety Instrumented Function without management approval?


8 / 25

Which testing activity confirms trip logic execution during commissioning?


9 / 25

A transmitter used in SIL 2 service has automatic diagnostics. What benefit does this provide?


10 / 25

What is the primary purpose of a HIPPS system in process industries?


11 / 25

Why are certified Safety PLCs preferred over standard PLCs in SIS applications?


12 / 25

Which factor significantly affects proof test interval selection?


13 / 25

In an ESD application, what is the preferred valve failure position during instrument air loss?


14 / 25

Which lifecycle phase verifies installed SIS performance against design intent?


15 / 25

What is the primary advantage of diagnostic coverage in Safety PLC systems?


16 / 25

Which field device failure mode is considered dangerous undetected?


17 / 25

Why must SIS remain independent from BPCS according to IEC 61511?

18 / 25

What is the major concern of common cause failure in redundant SIS architecture?


19 / 25

Which communication protocol is commonly accepted for safety related communication with certified integrity mechanisms?


20 / 25

What is the primary purpose of HAZOP in functional safety engineering?


21 / 25

A Safety PLC processor detects a mismatch between redundant CPUs. What should happen in a properly designed fail safe system?


22 / 25

Which document defines the functional requirements and integrity targets for a Safety Instrumented Function?


23 / 25

During proof testing of a Safety Instrumented Function, what is the main objective?


24 / 25

Why is 2oo3 voting logic commonly used in critical shutdown applications?


25 / 25

Which parameter primarily determines the SIL capability of a Safety Instrumented Function during low demand operation?


Your score is

The average score is 82%

0%

Access 1000+ MCQs tailored for instrumentation engineers: Instrumentation and Process Control Quiz Hub – 1000+ MCQs for Engineers

#AdvancedSafetyPLC #SafetyPLC #FunctionalSafety #SIS #SIL #IEC61511 #ProcessSafety #IndustrialAutomation #InstrumentationEngineering #AutomationEngineering #SafetyInstrumentedSystem #ShutdownSystem #ESDSystem #HIPPS #PLCProgramming #IndustrialSafety #ProcessControl #Instrumentation #ControlSystems #AutomationProfessionals #EngineeringQuiz #PLCQuiz #FunctionalSafetyEngineering #IndustrialEngineering #SafetyEngineering #InstrumentationQuiz #SILVerification #ProofTesting #ProcessIndustry #AutomationQuiz 

PROFIBUS vs PROFINET: Complete Industrial Network Comparison

0
PROFIBUS vs PROFINET: Complete Industrial Network Comparison
Table of Contents

Most engineers think PROFINET replaced PROFIBUS. Real plants tell a very different story.

That line is true in more control rooms than many people admit. In real industrial automation work, PROFIBUS and PROFINET are not just two protocols to compare on paper. They are two layers of plant reality, two generations of engineering practice, and in many sites, two systems that must work together every single day.

For instrumentation engineers, PLC and DCS engineers, commissioning teams, maintenance crews, and OT IT integration specialists, understanding PROFIBUS vs PROFINET is not optional. It is part of doing the job properly. The plants that run smoothly usually have one thing in common. Their engineers understand legacy systems, modern Ethernet architecture, troubleshooting discipline, and migration planning all at once.

At its core, PROFIBUS uses a structured master and device communication model. The controller polls field devices in a controlled cycle, which gives the network predictable timing. That predictability is one reason so many engineers still trust it.

PROFIBUS DP is widely used for fast communication with:

  • Remote I O
  • VFDs
  • Valve manifolds
  • Motor starters
  • Distributed field devices
  • Packaging equipment
  • Legacy Siemens automation systems

It is built for speed and control in industrial environments where cyclic exchange is enough for the process.

PROFIBUS PA is designed more for process instruments. It is common in chemical plants, refineries, oil and gas facilities, and other continuous process industries. It supports devices such as:

PA is valued because it fits the process industry mindset. Stability matters more than flashy speed. A reliable loop matters more than fancy features.

PROFINET is the Ethernet based evolution of industrial communication. It brings industrial automation into the Ethernet era while keeping the determinism and reliability that plants need.

Where PROFIBUS behaves like a disciplined polling system, PROFINET behaves more like a coordinated industrial network with better visibility, better flexibility, and far stronger integration with modern systems.

PROFINET supports:

  • High speed data exchange
  • Flexible network topologies
  • Advanced diagnostics
  • Device naming and easier configuration
  • Real time communication
  • Integration with SCADA
  • MES connectivity
  • IIoT and smart manufacturing
  • Motion control and robotics

It is especially strong in environments where plants need more than simple cyclic process data. If you need data sharing, diagnostics, transparency, and future ready architecture, PROFINET is usually the better fit.

Speed up PLC performance with proven optimization tactics: How to Increase PLC Speed: 7 Optimization Tips + Advanced Programming Guide

PROFINET RT means real time communication for standard industrial automation tasks. It is fast and efficient enough for many control applications.

PROFINET IRT means isochronous real time communication. It is used where precise timing is critical, especially in motion control and high performance applications.

That is one of the main reasons PROFINET has become such an important platform in Siemens PROFINET based systems, robotics, machine automation, and smart factories.

Unlock safer networking with this FISCO field guide: Fieldbus Intrinsically Safe Concept (FISCO) Model for Foundation Fieldbus H1 and Profibus PA

Below is a more detailed side by side table based on your content.

ParameterPROFIBUSPROFINETPractical engineering view
Communication modelUses a master device polling system with cyclic exchange. The controller asks each device in turn, which keeps the traffic organized and predictable.Uses a provider consumer model over Industrial Ethernet. Devices exchange data in a more flexible and modern way, with better visibility for control and diagnostics.PROFIBUS feels more rigid but very stable. PROFINET feels more open and scalable. In modern plants, that flexibility becomes a major advantage.
Physical layerPROFIBUS DP commonly uses RS 485. PROFIBUS PA uses a MBP style physical layer suited for process instrumentation.PROFINET runs on Industrial Ethernet over copper or fiber. It can use standard industrial network infrastructure with proper plant grade components.PROFIBUS is often simpler in older field segments. PROFINET gives better design freedom, especially for larger and more connected systems.
SpeedWorks well for many classical automation tasks, but the bandwidth is limited compared with Ethernet networks.Offers much higher data throughput and supports more demanding communication loads.For simple field communication, PROFIBUS is enough. For high data volume, advanced diagnostics, or modern integration, PROFINET is stronger.
TopologyMostly bus based with strict segment rules. The network structure must be carefully planned.Supports star, line, tree, ring, and mixed network structures.PROFIBUS is less flexible physically. PROFINET gives engineers more freedom in layout and expansion.
DeterminismVery deterministic in cyclic communication because the access method is controlled and predictable.Deterministic through real time design, traffic prioritization, and managed switching.Both can be deterministic when designed correctly, but PROFINET depends more on good network design discipline.
DiagnosticsProvides Provides diagnostics, but generally has more limited visibility and may require more physical testing to troubleshoot.Provides robust diagnostics, device naming, alarm handling, port status and switch level visibility.This is one of the greatest strengths of PROFINET. It speeds up problem-finding and decreases engineers’ downtime.
DistanceSegment length is limited and repeaters may be needed in larger systems. Cable quality and termination matter a lot.Longer distances are easier with fiber and suitable ethernet design.For large plants or extensive networks, PROFINET is usually easier to scale. PROFIBUS still functions well if the section is appropriately regulated.
RedundancyRedundancy is possible, but the options are generally less flexible and more dependent on the overall system design.Better redundancy options through ring design, managed switches, and redundant architectures.PROFINET gives more modern redundancy strategies and fits better with high availability plant design.
Motion controlSuitable for many conventional applications and some drive communication tasks.Better for advanced motion control and synchronized performance.PROFIBUS is still adequate for simple drive control. PROFINET is the preferred choice for precision mobility and advanced industrial automation.
ConfigurationMore manual in older plants. Addressing, termination and segment planning requires careful engineering.
Facilitation of engineering flow in current tool chains with more obvious device identification and network set up.PROFIBUS needs more field discipline. PROFINET shifts more work into engineering software and network design.
Maintenance complexitySimple once the team knows it, but physical layer problems can be difficult to isolate.Easier diagnostics, but network design, switch settings, and addressing discipline matter more.PROFIBUS problems often show up at the cable or segment level. PROFINET problems often show up in configuration or network infrastructure.
Cybersecurity considerationsMore isolated by nature, but that isolation also limits modern integration and visibility.Better for plant integration, but must be protected with proper cybersecurity controls.PROFINET is more connected, so cybersecurity planning becomes essential. PROFIBUS is less exposed, but also less adaptable to modern digital systems.
ScalabilityStrong for legacy field segments and established plant architectures.Much better for large, growing, and evolving systems.If the plant will expand, PROFINET gives a much better long term path.
IT integrationLimited integration with IT systems and modern digital platforms.Strong fit for OT IT convergence, data exchange, and digital manufacturing systems.PROFINET is the better choice when plant data must move into SCADA, MES, analytics, and higher level systems.
CostOften cheaper to maintain in existing plants because the infrastructure is already installed and understood.Better long term value in modern architectures, especially for new builds and expansions.PROFIBUS may win on immediate maintenance cost in brownfield plants. PROFINET often wins on lifecycle value.
TroubleshootingFocuses on cable condition, termination, shielding, address setting, and bus quality.Focuses on IP addressing, device naming, switch configuration, network load, and diagnostics.PROFIBUS troubleshooting is more physical. PROFINET troubleshooting is more network aware and software assisted.
Typical applicationsRemote I O, VFDs, valve positioners, process transmitters, legacy Siemens systems, and stable plant segments.Robotics, motion systems, smart machines, SCADA, MES integration, IIoT, and modern automation networks.PROFIBUS is excellent in older and process heavy environments. PROFINET is better for future ready automation.

PROFIBUS is still an excellent choice in many legacy and process environments where stability, known hardware, and proven plant performance matter most. PROFINET is usually the better choice when the goal is future growth, stronger diagnostics, easier integration, and modern industrial networking. The smartest plants today often use both.

Crack these advanced PROFIBUS MCQs before interviews: PROFIBUS Quiz: Top 25 Advanced Interview MCQs with Answers for Automation Professionals

Think of PROFIBUS as a disciplined classroom.

The PLC is the teacher.
The devices are the students.
Only one side speaks at a time in an orderly cycle.
Everyone knows when it is their turn.

That is why PROFIBUS feels stable. It is controlled, predictable, and easy to understand once the segment is properly designed.

In a real plant, this works well for:

The weakness is not the idea. The weakness is the physical segment. Bad termination, poor grounding, damaged shielding, address conflicts, or reflections can turn a reliable network into a nightmare.

Ace your next PROFIBUS interview with confidence today: Profibus Interview Questions and Answers

Think of PROFINET as a smart collaborative network.

Devices do not wait in a slow line.
They exchange data in parallel through Ethernet infrastructure.
Switches guide traffic.

Diagnostics travel with the communication.
The network becomes more transparent to the engineer.

That is why PROFINET feels modern.

It is a better fit for:

  • Robotics
  • Motion systems
  • Smart machines
  • Skids and packaged units
  • SCADA integration
  • MES connectivity
  • Industry 4.0 applications
  • Plants that want diagnostics, not just communication

PROFINET gives engineers more visibility into the health of the system. That means faster fault finding, better maintainability, and stronger integration with future systems.

Know exactly where Profibus still delivers real value: What is Profibus and what is its application in Instrumentation?

This is the part many articles miss.

Most plants do not get to replace everything overnight. They have installed devices, shutdown windows, budget limits, spare part constraints, and production pressure. A full migration is rarely a single project. It is usually a journey.

That is why hybrid industrial networks are so common.

A plant may use:

  • PROFINET backbone
  • PROFIBUS field segments
  • PN PB couplers
  • Gateways
  • Legacy PLC integration
  • Mixed generations of instrumentation

This is not bad engineering. In many cases, it is smart engineering.

Know which communicator gives technicians the edge: SmartBlue vs Read your HART device signals before trouble grows: HART Communicator: Which Is Better for Instrumentation Engineers?

Oil and gas plants often have long lived field devices that still perform well.
Refineries need stability and careful shutdown planning.
Power plants may have legacy control zones that cannot be touched casually.
Water treatment sites often run mixed generations of panels and instruments.
Pharmaceutical and chemical plants may upgrade in phases to protect validation and uptime.

The best engineers do not force technology for ego. They design for plant reality.

Choose the better field network without costly mistakes: Difference between profibus and foundation field bus

A good PROFIBUS migration plan is phased, not emotional.

  • Start with what already exists.
  • Check bus health
  • Test cable condition
  • Review device lifecycle
  • Identify spare parts availability
  • Check segment loading
  • Review shutdown windows
  • This stage tells you whether you are dealing with a healthy legacy system or a network that is already weak.
  • Add the Ethernet foundation first.
  • Install industrial Ethernet switches
  • Introduce PROFINET controllers
  • Add PN PB couplers where needed
  • Prepare the control system architecture
  • This creates the path forward without forcing every field device to change immediately.

Get installation right and avoid expensive Fieldbus failures: HART Transmitter Diagnostics: What Your Field Device is Telling You

  • Replace the most vulnerable devices first.
  • Upgrade failed hardware
  • Migrate remote I O
  • Replace older drives
  • Move critical segments one by one
  • This is usually the safest way to reduce risk during live plant operation.
  • Once the backbone is stable, move toward:
  • SCADA integration
  • MES connectivityAd
  • vanced diagnostics
  • OT IT integration
  • Condition monitoring
  • Better asset visibility
  • That is where PROFINET really starts to pay back the investment.

Avoid migration headaches with this Siemens S7 300 roadmap: Siemens S7 300 PLC Discontinued Migration Guide for Engineers

The most common problems with PROFIBUS are:

  • Termination problems
  • Shield grounding mistakes
  • Address conflicts
  • Signal reflections
  • Cable damage
  • Segment overload
  • Bus communication failures

When troubleshooting PROFIBUS, it’s generally best to start with the basics.  Engineers often inspect the cable condition, verify correct termination at both ends of the segment, confirm device addresses, and look for grounding or shielding errors. Because PROFIBUS is a bus system, even a small wiring issue can affect the entire segment.

In real plant situations, many PROFIBUS faults are not software problems at all. They are usually caused by installation errors, poor cable practices, loose connections, or segment design issues. That is why PROFIBUS troubleshooting demands a strong understanding of field wiring and signal integrity.

Test your Profinet knowledge with tougher questions now: Advanced Profinet Protocol Quiz for Automation Engineers

Typical PROFINET issues include:

  • IP conflicts
  • Incorrect device naming
  • Switch configuration problems
  • Network load issues
  • Jitter
  • VLAN mistakes
  • Faulty managed switch settings
  • Broken patch leads or poor Ethernet terminations

The good news is that PROFINET usually provides much better diagnostic detail. This makes fault finding faster, especially when the network is designed properly and managed switches are configured correctly.

PROFINET troubleshooting is often more about network configuration, addressing and infrastructure health as opposed to PROFIBUS. Engineers may need to check device names, IP settings, switch ports, Ethernet cabling, and traffic load across the network. In many cases, the diagnostics available in PROFINET help narrow down the problem much faster than in older fieldbus systems.

This is one of the reasons PROFINET in modern engineering discussions is often centered on visibility, diagnostics, and maintainability, not just speed. A well-designed PROFINET network can make troubleshooting much more efficient and reduce downtime in the plant.

Pick the faster protocol before your network slows: Modbus TCP/IP vs Profinet: Which Protocol Suits your Industrial Network Best?

Use PROFIBUS when:

  • The plant already has a strong installed base
  • The process is stable and the network is proven
  • You are dealing with legacy Siemens systems
  • The field devices are mostly classical process instruments
  • Shutdown time is limited
  • A full migration would be too costly or too risky

In many brownfield plants, PROFIBUS is still the right engineering answer.

Protect performance with the right termination choice: Why 75 Ohm Termination Resistor is Used in ControlNet?

Use PROFINET when:

  • You are building a new plant or major expansion
  • You need strong diagnostics
  • You want better integration with SCADA and MES
  • You have robotics or motion control
  • You want future ready industrial communication systems
  • You are planning long term OT IT convergence
  • You need better scalability and maintainability

For new projects, PROFINET is often the better strategic choice.

Select the ideal HMI before costly downtime hits: How to Choose the Right HMI Display for Industrial Automation

One of the biggest mistakes is thinking PROFINET automatically fixes poor design. It does not.

Other common mistakes include:

  • Ignoring industrial switch quality
  • Using unmanaged switches everywhere
  • Mixing IT and OT traffic carelessly
  • Poor grounding and shielding
  • Overloading the network
  • Copying office Ethernet habits into plant systems
  • Improper PROFIBUS termination
  • Ignoring cable standards and installation discipline
  • A modern protocol cannot save a bad network philosophy.

Cut wiring confusion with this Ethernet APL breakdown: Ethernet-APL (Advanced Physical Layer): Practical Guide for EPC Instrumentation & Process Automation Engineers

  • Industrial Ethernet is clearly moving to the front. PROFINET, TSN, IIoT, cloud integration, predictive maintenance, and smart diagnostics are shaping the next generation of automation.
  • But there is one important reality.
  • PROFIBUS is not disappearing tomorrow.
  • The smart path is coexistence, not fantasy.
  • The future belongs to engineers who can connect old systems and new systems without breaking production.

Fix SCADA communication failures before they spread: SCADA Communication Problems and How to Fix Them

The best automation engineers are not the ones who only understand the newest technology. They are the ones who know how to connect the old world and the new world together.

That is the real lesson behind PROFIBUS vs PROFINET.

One is not simply better than the other in every case. The real skill is knowing which one fits the plant, the budget, the shutdown window, the maintenance team, and the long term strategy.

That is what separates a protocol user from a true automation engineer.

PROFIBUS is the trusted legacy workhorse. PROFINET is the future ready industrial Ethernet platform. Most real plants need both, and the best engineers know how to design, troubleshoot, and migrate between them without stopping production.

Compare Fieldbus and HART before choosing wrong: Difference Between Fieldbus and HART Communication Protocols: Complete Comparison Guide for Process Automation Engineers

PROFIBUS is a fieldbus designed for deterministic cyclic communication in industrial automation.
PROFINET is an Ethernet based industrial network with stronger diagnostics, flexibility, and scalability.

PROFINET is generally the best choice for new systems and for new plant integration.

PROFIBUS is still very useful in existing plants where stability and legacy compatibility are important.

PROFIBUS is reliable, well understood, and deeply installed in many legacy automation systems.
It continues to perform well in process plants where proven infrastructure is still working properly.

PROFINET RT stands for real time communication used in standard industrial automation tasks.
It provides fast and reliable data exchange for many control applications.

PROFINET IRT means isochronous real time communication for highly synchronized applications.
It is mainly used in motion control and precision machine automation.

PROFIBUS DP is the fast decentralized peripheral version of PROFIBUS.
It is commonly used for drives, remote I O, and field devices.

PROFIBUS PA finds its main application in process instrumentation for industries like oil & gas, chemical and refining.

 It is developed for stable communication with field sensors in process plants. 

Yes, there are several plants that use hybrid architectures with a PROFINET backbone and PROFIBUS field level segments.

This enables old and new systems to coexist without a full replacement.

Decide between PLC and DCS with real clarity: PLC vs DCS – Which One Should you Choose for your Automation System?

A PN PB coupler connects PROFINET and PROFIBUS segments so both networks can communicate.
It is useful in hybrid plants where migration is being done in phases.

Typical problems with PROFIBUS are termination failures, ground problems, address conflicts, cable breakage, and reflections of the signal.

Most troubleshooting starts at the physical layer, because wiring failures are relatively common.

Common PROFINET problems are IP conflicts, device name problems, switch errors, network load, jitter and VLAN errors.

Diagnostics are usually more powerful and errors can be located faster.

Yes, PROFINET is well used for motion systems and complex machine control.

Its timing and synchronization capabilities make it an excellent candidate for precision applications.

Yes. PROFINET is increasingly used in process facilities, where diagnostics and integration are vital.

It is very important in today’s facilities that require better network visibility.

The ideal way to do this is a staged migration starting with assessment and network planning.
After that, upgrade the backbone first, then replace devices gradually.

No, PROFIBUS will remain in many plants for years because legacy assets and shutdown limits slow full replacement.
In most real plants, coexistence is more realistic than complete removal.

Loop Checking Field vs Control Room Reading Mismatch Explained

0
Loop Checking Field vs Control Room Reading Mismatch Explained

One of the most common commissioning and troubleshooting headaches in process plants is this simple but dangerous situation.

The field transmitter shows one value. The control room shows another. The loop check team starts questioning the transmitter, the DCS, the cable, the AI card, and even the calibration certificate.

In reality, the problem is often much smaller than it looks, but the impact can be large. A tiny loop current deviation can create a noticeable process value error, especially in wide span applications such as flare flow, custody transfer, and high range level or flow measurement. This is why field vs DCS reading mismatch is one of the most searched and most misunderstood problems in 4 to 20 mA loop troubleshooting.

Most engineers overlook this simple fact: the transmitter display often shows the internal calculated value, while the control room depends on the actual received loop current. That means the transmitter can look healthy even when the loop itself is not perfect.

The result can be wrong flow reporting, false alarms, bad control actions, SIS voting problems, and process instability. During startup, shutdown, migration, transmitter replacement, or loop checking, this mismatch becomes even more visible.

Master Cold and Hot Loop Checking Before Startup Failures: Cold and Hot Loop Checking in Automation: Key Differences and Step-by-Step Procedures

Loop checking is the process of verifying that the complete instrument signal path works correctly from field device to control room indication.

It is much more than simple transmitter calibration.

Calibration verifies the accuracy of the instrument itself. Loop checking verifies the integrity of the entire measurement chain.

A typical industrial loop includes:

  • Field transmitter
  • Junction box
  • Marshalling cabinet
  • IS barriers or isolators
  • Signal cables
  • Analog input cards
  • PLC or DCS scaling
  • Engineering unit conversion
  • HMI display
  • Alarm configuration

During loop checking, engineers verify:

  • Correct wiring
  • Correct polarity
  • Proper loop current
  • Signal integrity
  • Correct scaling
  • Correct engineering units
  • Alarm operation
  • Controller response
  • Interlock actions

Even with modern digital communication systems, 4 to 20 mA loops still dominate process industries because they are simple, reliable, noise-resistant, and easy to troubleshoot.

Pressure Transmitter Loop Checking Method Every Technician Must Know: Method Statement for Loop Checking of Pressure Transmitter Loop

A typical commissioning workflow includes:

  1. Verify instrument installation
  2. Verify cable continuity
  3. Check insulation resistance
  4. Power the loop
  5. Simulate process values
  6. Measure loop current
  7. Verify DCS indication
  8. Check alarms and trips
  9. Validate interlocks
  10. Document loop results

Many engineers wrongly assume that if the transmitter display is correct, the DCS reading must also be correct. In reality, the control room only sees the current arriving at the analog input card.

Motor Operated Valve Loop Checking Without Missing Critical Faults: How to do loop checking of Motor operated valve?

Why Field and Control Room Readings Differ

Why Field and Control Room Readings Differ - Loop Checking Field vs Control Room Reading Mismatch Explained

This is the core engineering concept most technicians overlook.

  • The transmitter display value comes from the internal processor calculation.
  • The sensor measures pressure, flow, temperature, or level and converts it into a digital process value internally. The transmitter processor then generates the analog output current.
  • The local display often shows the internally calculated value.
  • Minor loop issues may not affect this displayed value.

Improve Signal Quality Fast Using This Powerful SNR Calculator: Signal-to-Noise Ratio (SNR) Calculator for Instrumentation and Control Systems

  • The DCS or PLC does not see the transmitter processor value directly.
  • The analog input card only measures the received loop current.
  • The AI card converts the received current into engineering units using scaling equations.
  • If the current reaching the card changes slightly, the displayed process value changes accordingly.
Why HART Value and Analog Value Can Be Different - Loop Checking Field vs Control Room Reading Mismatch Explained

That means:

  • Transmitter may show correct value
  • HART communicator may show correct value
  • DCS may still show incorrect value

because the analog current reaching the AI card is different.

IS Barrier Earth Fault Calculator That Prevents Dangerous Failures: IS Barrier Earth Fault Current Calculator | Intrinsic Safety Loop Design Tool

Consider a flare flow meter with the following range:

  • LRV = 0 kg/hr
  • URV = 150,000 kg/hr
  • Output = 4 to 20 mA

The field transmitter shows:

  • 6.00 mA
  • 18,750 kg/hr

However, actual measured loop current at the AI card is:

  • 5.99 mA

The DCS calculates the process value using:

Industrial Example of Flare Flow Meter Reading Mismatch

Substituting the values:

Industrial Example of Flare Flow Meter Reading Mismatch 2

Final calculated value: 18,656.25 kg/hr

Difference: 93.75 kg/hr

Actual current deviation: Only 0.01 mA

Percentage error: Approximately 0.06%

This example shocks many engineers because the electrical deviation is extremely small while the process deviation becomes very large.

Wide-span transmitters amplify small loop current errors dramatically.

This is why flare systems, steam metering, LNG transfer, custody transfer, and high-capacity flow loops require extremely careful loop integrity verification.

Live 4-20mA Signal Verification Procedure Every Engineer Needs: Live Signal Verification 4 to 20 mA Loop Standard Operating Procedure (SOP)

Theoretically, current should remain constant throughout a series loop.

But practical industrial conditions create measurable deviations.

Real plants introduce many non-ideal conditions:

  • Cable resistance
  • Long cable runs
  • Loose terminals
  • Rusted connections
  • Moisture ingress
  • Poor crimping
  • Ground loops
  • Shielding problems
  • Electromagnetic interference
  • Barrier loading
  • Analog card burden
  • Voltage drops
  • Shared grounding systems

Convert 4-20mA Signals to PLC Counts Without Calculation Errors: Calculator for 4-20mA Signal to 1- 5Volt and PLC 16-bit Raw Count Values

Even though the current loop principle is robust, these field realities affect the actual current reaching the AI card.

This becomes especially visible during:

  • Plant startup
  • Brownfield modifications
  • Migration projects
  • Shutdown revamps
  • Aging facilities
  • Offshore platforms
  • High humidity environments

A slightly corroded terminal in a junction box may create enough additional resistance to alter signal integrity.

  • An overloaded IS barrier may reduce available loop voltage.
  • Poor shield termination may introduce electrical noise.
  • Shared commons may create fluctuating offsets.
  • Improper grounding can create unstable readings that appear random.

Most engineers focus only on the transmitter while the real issue exists somewhere in the signal path.

Most Common Causes of Field vs DCS Reading Mismatch - Loop Checking Field vs Control Room Reading Mismatch Explained

There are several reasons why the transmitter value in the field and the value in the control room do not match exactly. In many cases, the loop is still working, but one small issue is enough to create a visible difference in the displayed process value.

If the transmitter is configured with the wrong Lower Range Value or Upper Range Value, the output current will not represent the actual process correctly. Even if the sensor is healthy, the transmitter will send the wrong signal range, which leads to mismatch in the control room.

Sometimes the transmitter is correct, but the analog input scaling in the DCS or PLC is wrong. If the input channel is not mapped properly, the control system will convert the received current into the wrong engineering value. This is one of the most common reasons for false mismatch during loop checking.

A reading can appear wrong simply because different systems are using different units. For example, the transmitter may be configured in bar, while the DCS is showing psi or kPa. In these circumstances the values could be valid but seem to be mismatched because the units aren’t in sync.

The analog input card itself can deviate from its original calibration over time. This means that the card may not read the loop current correctly even when the field transmitter is giving the proper value. A small drift in the card can cause a large inaccuracy in the reading shown.

Unwanted grounding channels can interfere with the signal and lead to unstable or wrong readings. Ground loops are a particular problem in noisy industrial situations, where several return pathways can corrupt the signal and cause the control room value to drift or vary.

Why 4-20mA Signals Still Dominate Industrial Automation Systems: Why not use 0-20mA & 0-15psi instead of 4-20mA & 3-15psi?

Resistance can be introduced into the loop by long cable runs, broken conductors or poor cable quality. This can lower the available voltage and impact the current that reaches the AI card. In applications with a large span, even a little voltage loss might lead to a noticeable process fault.

If the cable shield is not terminated properly, the loop may pick up electrical noise from neighboring equipment, power cables or VFDs. This typically gives readings that are unstable, jitter or minor variations that make the value look questionable.

HART multidrop mode allows numerous devices to communicate on the same loop via digital signals. The analog current interpretation can be problematic if the system is not setup correctly. This can cause strange readings or apparent discrepancy between the field device and the control room.

Signal isolators can safeguard and isolate loops, but if not adjusted appropriately might change the signal or impair accuracy. they can alter the signal or reduce accuracy. Wrong input or output settings can create mismatch even though the transmitter itself is functioning properly.

Intrinsic Safety Barrier Burden Issues - Loop Checking Field vs Control Room Reading Mismatch Explained

Intrinsic safety barriers add resistance and load to the loop. If the burden is too high, the transmitter may not have enough voltage headroom to drive the signal correctly. This could result in a low reading or weak signal on the AI card.

If terminals are loose, rusted, or not well crimped, the signal route may be interrupted. The loop may still look alive, but the current may not flow cleanly. This sometimes results in intermittent mismatch, unstable readings or rapid value shifts.

If the loop supply is poor, unstable or set wrong, the transmitter may not work at the needed range. This can influence loop current and make the displayed value incorrect or inconsistent.

Generate Accurate 4-20mA Signals Without Calibration Mistakes: How to simulate 4-20ma signal with Loop Calibrator ?

Signal loop interference can be caused by electrical noise from neighboring motors, drives, transformers or power lines. This may not completely fail the loop, but it can cause small fluctuations, drift, or unstable displayed values.

Incorrect wiring inside the marshalling cabinet can easily create mismatch. A crossed wire, loose connection, or wrong terminal landing may allow the loop to work partially, but not accurately. This is why marshalling verification is always important during commissioning.

Some AI cards use shared common terminals. If wiring is not done properly, one channel can affect another. This may create subtle reading errors, channel interaction, or unexpected offsets in the control room value.

Not all analog input cards behave the same way. Using the wrong type of card for the application may lead to scaling, burden or compatibility difficulties. The transmitter may output correctly, but the card may not interpret the signal as expected.

If the analog input module has low resolution, small changes in current may not be represented accurately. This becomes a bigger problem in wide span applications where tiny current differences can produce visible engineering value errors.

Sometimes the transmitter itself has an internal output problem. The device may be indicating one value , but sending a little different current to the loop . This might be a bad output stage , or digital to analog conversion problem . This causes confusion since the local display looks okay, but the reading in the control room is wrong.

Many of these faults do not stop the loop completely. Instead, they only disturb the signal enough to create mismatch, drift, unstable readings, or small but important process value errors.

Loop Check vs Functional Test Mistakes Destroying Commissioning Quality: Loop Check vs Functional Test in Instrumentation Commissioning

Step by Step Troubleshooting Workflow:  Field vs Control Room Reading Mismatch
  • Check what the transmitter itself is showing.
  • Expected result: Transmitter PV and output current must be within the range set.
  • If not, likely fault: transmitter setting, trouble with sensor, or problem with internal circuitry.
  • Corrective action: Check transmitter configuration, spans, and health of the sensor.
  • Measure the current at the AI input in series using a calibrated multimeter or loop calibrator.
  • Expected result: Current to be within tolerance of transmitter output.
  • If not, unlikely to be at fault: cable loss, barrier load, terminal problem or power supply deficit.
  • Corrective action: check full current path, measure point to point.
  • Read transmitter with HART communicator.
  • HART value should equal transmitter display.
  • If not, probably fault: transmitter setting or sensor mismatch.
  • Corrective action: check sensor calibration and device parameters.
  • Check LRV, URV and engineering unit conversion in DCS/PLC.
  • DCS should take the current received and calculate PV appropriately.
  • If not: probable fault, improper scaling or wrong channel setting.
  • Corrective Action: Correct input range, raw count to engineering unit mapping.

4-20mA to PV Scaling Calculator for Precise Engineering Values: 4-20mA to PV scaling calculator

  • Look at the raw input counts in the control systems.
  • Expected result: Raw counts should follow closely the measured current.
  • If not, possible fault: AI card calibration issue, channel fault.
  • Corrective action: Check against a recognized current source and recalibrate if necessary.
  • Measure total resistance of loop.
  • Expected result: resistance should be in the limits of the transmitter and barrier.
  • Excess cable length, broken conductors, poor connections. If not, likely a defect.
  • Corrective action: Reduce burden, repair wire or enhance termination quality.
  • Check intrinsic safety barriers, isolators, and wiring.
  • Expected outcome proper device type, correct polarity and acceptable burden.
  • Wrong choice of barrier. Or wrong installation. If not, probable fault.
  • Corrective Action: Verify panel drawings and install correct device if applicable.
  • Make sure that grounding is done according to the plant philosophy.
  • The expected result is a steady signal, without undesired ground pathways.
  • If not, probable culprit: ground loop or floating shield.
  • Corrective action: Modify grounding mechanism and eliminate parallel return pathways.
  • Ensure shields are terminated at the correct end only.
  • no unintentional contact of shield with signal conductors.
  • Probable fault if not: noise pickup and unstable current.
  • Corrective action: re terminate the shield according to the standard.
  • Inject a known signal into the AI card.
  • Expected result: DCS should show the exact expected value.
  • Probable fault if not: DCS scaling or AI card issue.
  • Corrective action: isolate whether the fault is in the field loop or the control system.
  • Simulate current and compare field and room readings.
  • Expected result: full loop response should track the input.
  • Probable fault if not: wiring, barrier, or AI channel problem.
  • Corrective action: troubleshoot from field device to control room in sequence.
  • Make sure everyone is looking at the same units.
  • Expected result: kg per hour should not be confused with percent, lb per hour, or raw current.
  • Probable fault if not: unit conversion error.
  • Corrective action: align transmitter, DCS, and historian units.

Control Valve DCS Loop Troubleshooting Checklist That Actually Works: Checklist for Troubleshooting Control Valve in DCS Loop

This is one of the biggest sources of confusion during commissioning.

The HART value comes digitally from the transmitter processor. The analog output current is what the DCS actually sees.

That means the HART communicator may show a healthy reading while the DCS shows an error, because the analog loop current has a problem somewhere between the transmitter and the AI card.

This matters during FAT, SAT, shutdown work, startup, migration, and loop checking because engineers often trust the digital value and ignore the analog path.

That is a mistake.

If the DCS sees 5.99 mA, it does not care that the HART value looks perfect. It will calculate the PV from the current it receives.

Safely Measure Instrument Loop Current Without Damaging Equipment: How to Safely Check the mA Current of an Instrument Loop Using a Multimeter

A slightly loose junction box terminal caused fluctuating milliamp readings. Operators suspected thermocouple instability for two days before discovering the loose terminal.

A pressure transmitter was repeatedly recalibrated because the DCS reading was wrong. Root cause was incorrect AI scaling inside the PLC.

A small current drift occurred in a custody transfer flowmeter. The flow span was very large therefore the financial reporting inaccuracies were material.

The IS barrier replacement added further voltage load. The transmitter output current fell away a little, indicating a steady low flow.

Multiple shield grounding points introduced unstable level transmitter signals during rainy season humidity conditions.

These are not textbook examples. These are common industrial realities.

Simulate 4-20mA Signals Correctly Using Loop Calibrator Techniques: How to simulate 4-20ma signal with Loop Calibrator ?

  • Use proper loop design from the start.
  • Select quality cable with correct shielding.
  • Follow one clear shield grounding philosophy.
  • Size barriers and isolators correctly.
  • Verify all AI card settings before loop checking.
  • Use good ferrules and proper crimping.
  • Measure total loop resistance.
  • Keep marshalling clean and documented.
  • Don’t just check the transmitter, check the whole loop.
  • A good loop calibrator should be used.
  • Maintain grounding integrity across the entire system.
  • Calibrate the complete loop during commissioning.

4-20mA Loop Troubleshooting Techniques Every Technician Should Master: How to do troubleshooting of a 4-20mA loop?

Loop Current Drop vs Process Value Error Table - Loop Checking Field vs Control Room Reading Mismatch Explained
Current at AICurrent Drop from 6.00 mAApproximate PV Error on 0 to 150000 kg per hour span
6.00 mA0.00 mA0 kg per hour
5.99 mA0.01 mA93.75 kg per hour
5.98 mA0.02 mA187.50 kg per hour
5.95 mA0.05 mA468.75 kg per hour

This table shows why small loop current drops can create visible process errors on large spans.

Loop Diagram Interpretation Skills Every Instrument Engineer Must Learn: What is a loop diagram and how to interpret it?

  • Tiny current drop equals large process impact.
  •  Absolute error increases with span.
  •  DCS sees actual current, not the transmitter processor value.
    Loop integrity matters.
  •  Loop checking is not just calibration.
  •  Wide range transmitters need extra attention.

PLC Analog Scaling Mistakes That Cause Serious Process Errors: Scaling Analog Values in Industrial Automation (PLC)

The transmitter display shows the internally calculated process value, while the DCS calculates the value from the actual received loop current. Small current differences in the loop can therefore create visible mismatch in the control room.

Wrong scaling, ground issues, resistance in the loop, barrier overload, loose terminals and AI card configuration errors are the most common culprits. Even a good transmitter can be ugly if there are little interruptions in the signal path.

Calibration makes sure that the instrument itself is correct . Loop checking makes sure the complete signal flow from the field device to the control room is correct . A healthy loop is not always a successful calibration.

HART communication reads the transmitter digitally from its processor, but the DCS depends on the analog current reaching the AI card. A problem in the analog loop can therefore affect the DCS even when HART looks perfect.

Yes, especially in wide span applications such as flare flow or custody transfer when small current variances can cause huge inaccuracies in engineering values. The percent inaccuracy seems little but the effect on the process can still be large.

Check the transmitter display, the real loop current, DCS scaling and AI raw counts These tests immediately show whether the problem is in the transmitter, wiring or control system.

Turbine Flow Meter Scaling Calculator for Accurate Process Measurements: Turbine Flow Meter Coefficient and Scaling Factor Calculator

Yes.  Intrinsic safety barriers or isolators might add strain in the loop and lower the amount of available voltage headroom. This could hinder the transmitter from providing the right current to the AI card.

Common causes of unreliable readings are loose terminals, grounding problems, insufficient shielding, moisture intrusion, electrical noise and poor crimping. These flaws may not kill the loop, but they can introduce drift and volatility.

The DCS calculates the displayed process value by using the current received at the analog input card, not the transmitter display. Thus, any signal problem from the field to the control room can influence the precision of the procedure.

Use good loop design, check scaling, maintain strong grounding and shielding techniques, and do full loop checks during commissioning. Checking the entire signal path prevents hidden loops from appearing later.


What Causes 80% of Instrument Failures in Industry? Top 10 Causes and Prevention Methods

0
What Causes 80 Percent of Instrument Failures in Industry
Table of Contents

Instrumentation is one of the most important parts of any process plant, yet it is also one of the most misunderstood. When an instrument fails, many people immediately blame the device itself. In reality, most problems begin much earlier, often during installation, selection, commissioning, or maintenance. A transmitter, valve, sensor, or analyzer may be perfectly capable of doing its job, but if the surrounding conditions are wrong, the final result will still be poor.

This is why industrial instrumentation troubleshooting matters so much. The goal is not only to replace a failed device. The real goal is to understand why it failed, remove the root cause, and stop the same problem from happening again.

A single bad transmitter can create a false reading that disrupts a control loop. A blocked impulse line can create a false level indication. A drifting temperature sensor can affect product quality. A noisy loop can confuse the control system. In a plant, these issues do not stay small for long. They can spread into downtime, waste, unsafe operation, and expensive maintenance work.

Many plants treat instrument failure as an unpredictable event. That mindset is costly. In most cases, the same patterns repeat again and again. A device fails in one location because vibration is high. Another fails because moisture enters the enclosure. Another drifts because the service is severe and the calibration interval is too long. When these patterns are tracked properly, failure prevention becomes much easier.

Test Your Skills on Bently Nevada 3500 Troubleshooting: Troubleshooting Bently Nevada 3500 Series Vibration Monitoring System Quiz for Process Industries

What Causes 80 Percent of Instrument Failures in Industry - Improper Instrument Installation

A large number of field problems begin with installation errors. Even a high quality instrument can give poor performance if it is mounted in the wrong way or connected poorly. Wrong orientation, poor routing, unsupported tubing, and bad tapping points can all lead to unstable readings and early failure.

Some of the most common issues include excessive vibration at the mounting point, impulse lines with high points or low points that trap gas or liquid, poor cable glanding, missing supports, no drain or vent arrangement, and poor access for calibration and maintenance. These may look small during commissioning, but over time they become serious reliability problems.

Field teams often blame the instrument because the symptoms appear at the device. But the actual cause is often the surrounding installation. For example, a differential pressure transmitter on a steam line may drift because condensate is trapped in the impulse tubing. The transmitter is not the true problem. The installation is.

What Causes 80 Percent of Instrument Failures in Industry - Harsh Environmental Conditions

The environment can destroy reliability faster than almost any other factor. Instruments exposed to high temperature, humidity, chemical vapors, dust, ultraviolet light, and water ingress will age much faster than expected. Seals break down, terminals corrode, enclosures weaken, and electronic parts begin to fail.

An enclosure that works fine in a clean panel room may fail completely outdoors or in a washdown area. This is why the protection level must match the real site condition. The enclosure rating should not be chosen only from the datasheet. It must suit the actual environment.

Common signs include corroded terminals, intermittent open circuits, eroded cable insulation, display failure, moisture inside the enclosure, and unstable sensor readings. In rainy seasons, these problems often become more visible because weak sealing and poor gland fitting allow water to enter.

Use the correct enclosure type, proper glands, and breathers where needed. Seal unused entries. Inspect covers, door gaskets, and terminal areas regularly. Apply anti corrosion protection when required. Keep panels dry and shaded if possible. These are not expensive actions, but they protect a large amount of plant value.

Fix PID Control Valve Hunting Before Process Stability Fails: Control Valve Hunting Due to PID Controller: Causes, Effects, Root Analysis and Complete Troubleshooting

What Causes 80 Percent of Instrument Failures in Industry - Vibration and Mechanical Stress

Rotating equipment such as pumps, compressors, and blowers can transfer vibration into nearby instruments, tubing, junction boxes, and cables. Over time, this mechanical stress creates fatigue. That fatigue can cause loose fittings, cracked tubing, failed brackets, and unstable readings.

Pressure gauges, pressure transmitters, flow meters, local indicators, junction boxes, and cable terminations often suffer when vibration is high. A gauge near a reciprocating pump may begin to shake, then fail early. A transmitter mounted too close to a vibrating machine may show repeated faults even after replacement.

When the same instrument keeps failing in the same place, the machine or structure should be inspected, not only the device. Vibration, pulsation, and mechanical stress often explain why the same asset fails again and again. The root cause may be poor mounting, weak support, or high process pulsation.

Use vibration resistant mounting where necessary. Install dampers or snubbers when service requires it. Avoid placing instruments near rotating equipment if feasible. Use adequate clamps, flex supports. Check for tubing fatigue, bracket rigidity during maintenance. A stable mounting arrangement can extend instrument life significantly.

Identify PLC Analog Signal Faults Using Real Plant Scenarios: Troubleshooting Analog Output Signals in PLC Loops – Advanced Scenario-Based Quiz for Process Industries

What Causes 80 Percent of Instrument Failures in Industry - Calibration Drift

Not all instrument failures happen suddenly. Some develop slowly over time. The instrument may still work, but it no longer tells the truth. That is calibration drift. It is one of the most important hidden problems in industrial instrumentation.

Drift can come from sensor aging, thermal cycling, electronics degradation, mechanical wear, or long term exposure to difficult process conditions. Some instruments drift slowly for months before the issue becomes noticeable in the plant.

A drifting instrument can look normal while quietly affecting production quality, batching accuracy, safety margins, and control performance. If the reading is wrong but still believable, operators may not notice the problem until the impact becomes significant.

What Causes 80 Percent of Instrument Failures in Industry - Electrical Problems

Many field issues are not mechanical at all. They are electrical. Ground loops, EMI, RFI, poor shielding, loose terminals, poor earthing, power fluctuations, and bad cable routing can create noise that distorts the signal.

A transmitter output may fluctuate even when the process is stable. A communication signal may fail intermittently. A DCS input may show spikes or random alarms. These symptoms often point to wiring, grounding, or shielding issues rather than a bad transmitter.

Before replacing a device, the loop should be checked properly. Signal and power cables should be separated where required. Shield termination should follow good practice. Terminal tightness should be verified during preventive maintenance. Loop voltage and load resistance should also be checked. In many cases, the transmitter is innocent and the wiring is guilty.

Use single point grounding practices where appropriate. Keep signal wiring away from power circuits. Maintain clean terminations. Verify continuity during troubleshooting. A stable electrical foundation protects every device in the loop.

Unlock Predictive Maintenance Using Advanced Heartbeat Technology Diagnostics: Heartbeat Technology in Process Instrumentation – Complete Working, Diagnostics, Verification & Predictive Maintenance Guide

In some services, the process itself becomes the enemy. Plugging, scaling, fouling, corrosion, overpressure, cavitation, steam hammer, and blocked impulse lines can make a healthy instrument appear faulty.

When the process contains sludge, solids, or scaling material, normal instrument service becomes difficult. A level transmitter may read incorrectly because the impulse line is blocked. A flow meter may become unstable because buildup affects measurement. A pressure device may respond slowly because the service is not clean enough for the chosen arrangement.

In dirty or slurry service, maintenance access should be planned from the beginning. Flush, purge, or seal arrangements may be needed. Material selection should match the process chemistry. Manifolds and impulse lines should be easy to inspect. A service that looks manageable on paper can become a serious reliability issue if access is poor.

Choose the correct instrument for the service. Review material compatibility carefully. Watch for buildup, scaling, and corrosion. Improve maintenance intervals where needed. The plant should be designed for the real process, not the ideal one.

Strengthen Smart Plant Reliability with Cyber-Secure Maintenance Practices: Advanced Integrated Field Instrument Reliability & Cyber-Secure Maintenance Checklist for Smart Process Plants

Even the best installation cannot save an instrument that was chosen for the wrong duty. If the wetted material is wrong, the pressure range is wrong, the temperature rating is wrong, or the hazardous area classification is not suitable, failure will come early.

Plants sometimes choose the wrong wetted material, the wrong accuracy class, the wrong enclosure, or the wrong pressure and temperature range. A transmitter installed in corrosive service with unsuitable wetted parts may work for a short time and then fail repeatedly. The problem is not poor luck. The problem is selection.

The cheapest instrument is often the most expensive one over the lifecycle. A slightly better selection can reduce replacement work, avoid repeat faults, and improve reliability for years. The purchase price is only one part of the total cost.

Review process chemistry carefully. Check material compatibility. Confirm hazardous area requirements. Match range and accuracy to the real process need. Think about maintenance, spares, and long term reliability, not only initial cost.

Avoid Foundation Fieldbus Installation Errors in Critical Process Plants: Foundation Fieldbus Installation and Best Practices – Complete Guide for EPC and Maintenance Engineers

Many plants do not have one major instrument problem. They have repeated small maintenance mistakes that slowly damage reliability. Skipped calibration, dirty junction boxes, poor documentation, missing spares, and temporary bypasses left in service all create risk.

Maintenance should do more than make the instrument work again. It should restore the full reliability of the loop. If a problem returns after every shutdown, the real issue is not being solved. Cleaning a device without fixing the fundamental cause is just postponing the next problem.

Build a preventive maintenance plan based on criticality. Keep good records. Replace broken seals, glands & terminals. Maintain spare inventory for critical loops. Review recurring faults in root cause analysis meetings. Good maintenance is disciplined, not reactive.

Instantly Calculate Instrument Failure Rates for Better Maintenance Planning: Failure Rate (λ) Calculator for Process Instrumentation and Industrial Maintenance

Wrong wiring, wrong scaling, wrong configuration, and wrong commissioning actions often look like equipment faults. A bad parameter entry can create a reading that seems impossible. A reversed wire can look like a dead transmitter. A wrong range setup can mislead operators and start a long troubleshooting effort.

Typical mistakes include wrong input scaling in the DCS, incorrect range setup in the transmitter, reversed wires, bad parameter entry, and missed checks during FAT or SAT. These are preventable errors, but they happen often when time pressure is high.

Loop checking confirms wiring, scaling, polarity, and signal integrity before startup. It is one of the simplest ways to prevent commissioning errors. Every parameter change should be treated carefully because small configuration mistakes can create serious process confusion.

Reduce PLC I/O Failures with Proven Maintenance Strategies: Proactive Maintenance Strategies for PLC I/O Modules: Reduce Downtime & Improve Reliability

InstrumentCommon FailureMain CauseTypical SymptomPrevention
Pressure transmitterDrift / false readingInstallation, vibration, impulse issuesUnstable pressure valueCorrect mounting, regular checks
Temperature transmitterSensor drift / open circuitHeat stress, aging, wiring faultErratic or frozen PVCorrect sensor selection, PM
Control valveHunting / stictionWrong tuning, wear, air supply issuesFluctuating outputProper tuning and actuator maintenance
Radar level transmitterFalse echo / signal lossFoam, buildup, installation errorWrong level indicationCorrect nozzle setup and cleaning
Flow meterBad measurementGrounding, fouling, improper straight runUnstable flow readingFollow installation rules
Solenoid valveCoil failure / stickingMoisture, dirt, voltage issueValve not switchingDry, clean, proper supply
AnalyzerSample system faultPlugging, contaminationWrong analysis resultSample conditioning PM
PLC I/OChannel failure / noiseWiring, grounding, power issueInput/output mismatchCheck wiring and shielding
PositionerCalibration / air leakAir quality, wearSlow valve responseAir prep and periodic tuning
Limit switchMechanical failureMisalignment, corrosionNo status feedbackInspection and alignment

Improve Equipment Reliability Using Accurate MTBF Calculation Methods: Mean Time Between Failures (MTBF) Calculator for Process Instrumentation Maintenance

What Causes 80 Percent of Instrument Failures in Industry -Real Industrial Failure Case Studies

A tank level kept reading high even though the actual tank level was normal. At first, the operator team suspected a transmitter fault, but the real issue was a blocked impulse line caused by sludge buildup. The blockage prevented the pressure from reaching the instrument correctly, so the reading stayed misleading. After the line was cleaned and the flush arrangement was improved, the problem reduced significantly. This kind of case is very common in dirty service, and it shows that false level often starts with plugging, not with electronics. In many plants, the instrument is only the messenger. The real fault is in the process connection or installation method.

Troubleshoot Guided Wave Radar Transmitters Before Production Problems Escalate:Guided Wave Radar Level Transmitters: Complete Troubleshooting & Maintenance Guide

A flow transmitter started giving noisy and unstable readings even though the process itself was steady. The measurements were jumping about . The operators thought the transmitter was going bad . The actual cause was revealed to be inadequate grounding practice after analyzing the loop continuity, cable routing, shield termination and grounding points. The signal was stable again once the shield and grounding were fixed. This is a good example of how electrical issues can look like process problems. Before replacing a transmitter, the loop should always be checked carefully because noise in the wiring can create the same symptoms as a bad instrument.

A process line began to oscillate repeatedly, and the control valve kept opening and closing in an unstable manner. At first, the controller was blamed, but the real issue was a combination of aggressive PID tuning and a valve that was already sticking. The control was overly aggressive and the valve was not moving smoothly enough to give solid control. After the loop was retuned and the valve internals were serviced, the process became much more stable. This case shows that control problems are usually system problems, not controller problems alone. A valve, actuator, positioner, and controller all work together, so one weak point can disturb the entire loop.

Download Powerful Maintenance Checklist to Avoid Unexpected Plant Failures: Maintenance Checklist

During the rainy season, one area of the plant experienced repeated trips and intermittent signal loss. At first, the fault appeared to be random because it came and went with the weather. Upon opening the junction box, it was found to have dampness, corrosion and unsecured terminals. The cable glands were not sealing correctly and water had been getting into the enclosure over time. The problem was remedied with the replacement of the glands and the improvement of the enclosure protection. This example demonstrates that a little sealing failure can result in a huge dependability problem. A junction box may look fine from the outside, but once moisture reaches the terminals, the whole loop can become unstable.

A pressure gauge installed near a reciprocating pump failed much earlier than expected. Before it failed completely, the needle became unstable and difficult to read. Subsequently, the bourdon tube fractured under constant pulsation and mechanical stress. The gauge itself wasn’t the problem. The real issue was the severe pulsation from the pump and the location of the installation. After a snubber was added and the gauge was repositioned, the failure rate dropped. This case is a strong reminder that mechanical stress can shorten instrument life very quickly. In high vibration or pulsation service, the installation method matters as much as the instrument quality.

Perform Marshalling Cabinet Shutdown Maintenance Without Missing Critical Steps: Shutdown Maintenance Procedure for Marshalling Cabinets in Process Plant

Good installation removes many future problems before they ever begin. If the instrument is mounted properly, connected properly, and supported properly, the chance of failure drops a lot. Proper routing, correct orientation, clean wiring practice, and good accessibility all matter from the beginning. A plant can save a huge amount of troubleshooting time later by doing the installation work correctly during construction or commissioning.

As found records, calibration results, and repeated fault patterns tell a lot about the health of an instrument. If one transmitter keeps drifting faster than the others, that is a warning sign. If the same loop keeps failing after every shutdown, the underlying cause needs to be reviewed. Failure history helps the plant identify weak assets before they create major trouble. This is one of the simplest and most effective ways to improve reliability over time.

Protect Instruments From Environment and Vibration

Heat, moisture, dust, and corrosion can slowly destroy field instruments. This is why enclosure selection, gland sealing, panel protection, and regular inspection are so important. Instruments exposed to sunlight, rain, chemical vapors, or washdown conditions need the right protection from the start. A small investment in environmental protection can prevent many repeated failures later.

Electrical discipline is essential in instrumentation. Poor grounding and shielding can create noise, unstable readings, communication errors, and false alarms. Many plants spend time replacing devices when the real problem is in the cable or earthing practice. Good grounding, clean shield termination, and proper separation of signal and power wiring help prevent a large number of hidden faults.

If the source of vibration is not controlled, repeat failure is very likely. Instruments mounted near pumps, compressors, and other rotating equipment need special attention. Snubbers, dampers, better support, and improved location can all help reduce mechanical stress. When vibration is ignored, even high quality devices can fail again and again in the same place.

The best instrument is not the one with the lowest price. It is the one that matches the process, environment, and duty correctly. Material compatibility, pressure range, temperature rating, accuracy, enclosure type, and hazardous area certification all matter. A well selected instrument usually gives better performance, lower maintenance effort, and longer life. Selection mistakes are expensive because they create repeat problems for years.

If the same failure happens twice, it is no longer random. It is a process issue that needs attention. Root cause analysis helps the plant move beyond the symptom and find the real reason for failure. Whether the issue is plugging, vibration, moisture, wiring, or operator error, the lesson is the same. Fixing the device without fixing the cause only delays the next breakdown. Root cause analysis is one of the most valuable habits in instrumentation reliability.

Download : Advanced Instrumentation Failure Prevention Checklist for Process Plants

Improve reliability, reduce downtime, and identify hidden field problems using this advanced Excel checklist designed for instrumentation maintenance, calibration, troubleshooting, inspection, commissioning, grounding, vibration analysis and root cause investigation.

Prevent Expensive Control Valve Breakdowns Using Proven Inspection Steps: Control Valve Preventive Maintenance Checklist and Inspection Procedure

Pressure transmitters fail because of vibration, impulse line blockage, penetration, corrosion and improper installation procedures. Good reliability requires correct installation and maintenance.

The calibration drift is due to sensor aging, heat cycling, harsh process conditions, and degradation of the electronics. The device slowly loses its accuracy in measurement.

Vibration causes mechanical stress on fittings, destroys tubing, breaks brackets, and impairs stability of signals. Instruments near whirling machines are extremely susceptible.

The most typical failures include pressure transmitters, control valves, impulse lines and electrical signal difficulties. Most failures relate to installation and maintenance.

Poor grounding causes electrical noise to the loop, which results in unstable readings, erratic spikes, and communication mistakes. Proper earthing and shielding are required.

Impulse lines get obstructed due to sludge, scaling, condensate build-up, dirt and improper routing procedures. Blocked lines might give erroneous pressure and level measurements.

Failures typical to the rainy season include water entry, humidity, condensation and corroded terminals. Failure of poor cable gland sealing increases the likelihood of signal loss.

Wrong material selection, wrong pressure range and wrong enclosure ratings lead to recurring failures. An appropriately chosen tool has a longer life and works better.

Loop check is used to verify wiring , scaling , polarity , and signal integrity before startup . It helps to avoid mistakes during commissioning and wrong readings of instruments.

If not maintained properly, the same problems  dirty terminals, skipped calibration, damaged seals  keep happening over and over again, resulting in failures. Preventive maintenance increases reliability.

Stiction, air leaks or tuning difficulties in a control valve can produce oscillation, unstable flow and poor process control. Valve condition directly affects loop performance.

Plants reduce failures by improving installation quality, grounding, calibration discipline, vibration control, and preventive maintenance practices. Root cause analysis is also critical.

Flow meters give unstable readings due to grounding problems, air bubbles, fouling, wrong straight run and vibration. Proper installation enhances measurement accuracy.

Generally, false level indication is caused by clogged impulse lines, foam, scaling, moisture or wrong transmitter installation. Regular inspections are a check against errors.

Electrical noise disrupts low level signals and causes unreliable readings, communication failures and false alarms. The proper cable routing and shielding helps prevent interference.

Control valve hunting can be caused by excessive PID tuning, sticky valve internals, insufficient air supply or large valves. Stable tuning enhances process control.

Water infiltration might be due to defective gaskets, insufficient gland sealing, cracked enclosures or incorrect installation. Inside the box, water creates corrosion and signal difficulties.

Pressure gauges fail near pumps because pulsation and vibration damage the bourdon tube and internal mechanism. Snubbers and proper mounting reduce failure rates.

Symptoms include steady yet inaccurate readings, frequent offset during calibration, and progressive drift over time. Drift impacts accuracy and quality of processes.

Preventative maintenance detects wear, corrosion, loose terminals and drift before failure. It saves downtime and increases the reliability of the plant.

Improper cable arrangement will expose signal cables to electrical interference and mechanical damage. This can cause readings to become unreliable and problems with communication.

Repeated transmitter failure usually points to vibration, heat, moisture, or installation problems in that area. The environment must be checked, not only the device.

Unstable DCS values are generally the result of noisy signals, grounding difficulties, vibration, poor tuning, or bad field wiring. Always verify signal quality first.

Root cause analysis discovers the true reason of the problem so failures do not occur again. It means more reliability and no unneeded replacement work.

Access Complete Preventive Maintenance Procedures for Instrumentation Systems: Collection of Preventive Maintenance (PM) Procedures for Instrumentation and Control Systems 

Most instrument failures are not mysterious. They are the result of repeated field conditions that can be understood and controlled. Poor installation, harsh environments, vibration, calibration drift, electrical noise, process plugging, wrong selection, weak maintenance, and human error all play a major role in plant reliability.

For instrumentation professionals, the lesson is simple. Do not stop at the symptom. Look for the root cause, study the service condition, and fix the real problem. When plants do that consistently, they protect uptime, reduce waste, improve safety, and extend the life of every instrument in the field.

If you would like, I can also turn this into a full blog post with an SEO title, meta description, FAQ schema style section, and a clean WordPress ready format.

Impulse Line Freezing Risk and Heat Tracing Calculator for Instrumentation Engineers

0
Impulse Line Freezing Risk and Heat Tracing Calculator for Instrumentation Engineers
Table of Contents

Impulse lines may look like a small part of an instrumentation system, but every engineer who has worked in cold weather service knows how important they are. These small bore tubes connect the process to pressure transmitters, differential pressure transmitters, and level measurement systems. When the line is healthy, the measurement is stable and reliable. When the line freezes, the signal can become wrong, delayed, blocked, or completely lost.

This is why impulse line freezing is a serious issue in process industries. A frozen line can lead to false readings, plugged sensing paths, transmitter errors, nuisance alarms, process trips, and unwanted shutdowns. In oil and gas plants, LNG facilities, refineries, chemical plants, power plants, and water treatment stations, this is not just a seasonal inconvenience. It is a real reliability problem that affects plant operation and maintenance.

The Impulse Line Freezing Risk and Heat Tracing Calculator is designed to help instrumentation professionals evaluate heat loss, insulation effectiveness, freezing risk, required heat tracing power, and time to freeze. It gives engineers a practical way to assess transmitter freeze protection before a problem reaches the field. The calculator is useful during design review, commissioning, maintenance planning, and winterization studies. It also helps teams compare tubing material, fluid properties, ambient conditions, insulation options, and heat tracing methods in one place.

Impulse Line Heat Tracing Calculator | automationforum.co

⚡ Impulse Line Heat Tracing Calculator

Industrial Thermodynamic Simulation for Instrument Impulse Line Winterization

Powered by automationforum.co | Your Trusted Source for Automation Tools

Tubing Details

Process Fluid Properties

Ambient Conditions

Insulation Parameters

Heat Tracing Configuration

Actions

automationforum.co
Impulse Line Freezing Risk and Heat Tracing Calculator for Instrumentation Engineers - Why Impulse Line Freezing Matters in Process Plants

A transmitter may be calibrated correctly and still give the wrong output if the impulse line is frozen. That is the hidden danger. The failure does not always begin in the transmitter itself. Often, the problem begins in the sensing line. Once the line blocks or cools too far, the measurement no longer reflects the true process condition.

Size Cable Trays with Confidence: Cable Tray Sizing Calculator: Complete Engineering Guide for IEC 61537 and NEC 392 Compliance

Impulse Line Freezing Risk and Heat Tracing Calculator for Instrumentation Engineers - How frozen impulse lines cause false readings and shutdown risks

That is why winterization of instrumentation should always be part of good engineering practice. Insulation, electrical heat tracing, steam tracing, and proper routing all help protect the measurement system. The calculator supports that work by making freeze protection more measurable and more practical.

Master Impulse Line Installation Now: Advanced Quiz on Impulse Line Installation in Process Industries 

The tubing details section includes outer diameter, wall thickness, tubing length, and tubing material. These factors matter because they affect how fast heat is lost from the line. A longer line loses more heat. A thin wall has reduced thermal resistance. The higher the thermal conductivity of a material , the faster it will conduct heat .

This is why stainless steel tubing and copper tubing do not behave the same way in cold service. Stainless steel is much more common in instrumentation work, but copper has very different thermal behavior. The calculator helps the engineer compare these differences in a simple and practical way.

Inspect DP Transmitters Step By Step: Impulse Line Inspection Step By Step Procedure For DP Transmitters 

The process fluid section includes freezing point, density, specific heat, initial process temperature, and operating condition. These inputs are important because the same ambient temperature does not affect every fluid in the same way. Water, condensate, steam condensate, hydrocarbons, and glycol all behave differently.

Stagnant fluid freezes faster than flowing fluid because there is no movement to replace cooled fluid with warmer fluid from the process. This is a key point in impulse line freezing risk. The calculator reflects that reality by letting the engineer define the operating condition.

Pick the Perfect Impulse Tube Size: How to Select the Right Impulse Tube Size for Pressure Measurement Systems

Ambient temperature is the most obvious freeze factor, but wind speed is often just as important. Wind increases convective heat loss and can reduce the available thermal margin very quickly. That is why a line that looks safe on a calm day may become risky during windy weather.

Humidity and elevation also help define the local environment more accurately. In practical field work, the freezing problem usually comes from the combination of ambient temperature, exposure, and wind, not from one factor alone.

Insulation is one of the strongest defenses against freeze damage. The calculator allows the engineer to choose insulation material and thickness so the impact on heat loss can be compared. Mineral wool, polyurethane, calcium silicate, aerogel, and fiberglass all have different thermal characteristics.

Good insulation can increase time to freeze and reduce the load on the heat tracing system. Poor insulation, or insulation with gaps and moisture ingress, can do the opposite. That is why insulation selection and installation are both important.

Follow These Impulse Tubing Best Practices: Best Practices for Impulse Tubing Installation 

Impulse Line Freezing Risk and Heat Tracing Calculator for Instrumentation Engineers - Heat Tracing Configuration for Instrumentation Lines

The heat tracing section supports electrical self regulating cable, constant wattage cable, steam tracing, and no heat tracing. It also includes trace rating, number of parallel traces, and supply voltage. These inputs help the engineer estimate whether the available heat input is enough to offset the heat loss from the impulse line.

Self regulating cable is often preferred in instrumentation applications because it can adjust output with temperature. Steam tracing can also work well in certain facilities, but it requires good maintenance and process discipline. The calculator gives engineers a way to review the options in a practical freeze protection context.

Get the Top Impulse Line Answers: Instrument Impulse Line: Most Common Questions and answers

Impulse Line Freezing Risk and Heat Tracing Calculator for Instrumentation Engineers - Engineering Calculation Logic Behind the Calculator

The calculator uses radial heat transfer logic to estimate heat loss from the impulse line. Heat loss rises when the temperature difference between the line and the surroundings increases. It also rises when the tube is longer or the material allows heat to move out more easily.

This is the basic reason impulse lines freeze. The line loses more heat than the process can replace. Once that happens, the fluid temperature drops and freeze risk begins to rise.

Insulation works by adding thermal resistance between the tube and the environment. Higher resistance means lower heat loss. In field terms, a better insulation layer gives the impulse line more time before it reaches freezing conditions.

That extra time matters. It gives the operator more margin, the maintenance team more response time, and the transmitter a better chance of staying reliable during cold weather.

Fix Impulse Line Problems Fast: What are Impulse lines? – Impulse line problems and solutions

Wind can change the result very quickly because it strips heat away from the tubing and insulation surface. The calculator includes a wind correction factor so outdoor installations are evaluated more realistically.

This is especially useful for pipe racks, open structures, exposed transmitter stands, and other locations where the line is not sheltered from the weather.

Time to freeze is one of the most useful outputs in the calculator. It tells the engineer how long the line can remain above freezing before thermal energy is exhausted. This gives a practical measure of how urgent the freeze protection problem is.

If the time to freeze is short, the line needs stronger protection or faster intervention. If the time is long, the current design may be acceptable. For plant reliability work, this is a very useful number.

The calculator compares required heat trace power with available trace power and applies a safety margin. This is a simple but important step because freeze protection must cover not only the calculated heat loss, but also real field variation, installation tolerance, and aging effects.

In practice, engineers should never design a heat tracing system with zero margin. A proper margin gives more reliable operation during severe weather and protects the line if conditions become worse than expected.

Know Filled Versus Purged Impulse Lines: Difference between filled impulse line and purged impulse line

Freeze Risk Classification Results

Safe means the line has enough thermal protection and enough time before freezing becomes a concern. This is the preferred operating condition for a winterized instrumentation system.

Moderate means the design is workable, but the safety margin is limited. In this circumstance the engineer should check insulation thickness, trace power and exposure conditions.

Warning indicates a substantial risk of freezing. The line may still work for now, but the protection system is close to its limit and should be reviewed quickly.

Detect Plugged Impulse Lines Quickly: Plugged Impulse Line Detection Impulse-line Purging & Close Coupling

Critical means immediate action is required. The line may freeze very quickly or the heat tracing may be too weak to provide reliable protection. This is the most dangerous condition because the measurement can fail with little warning.

Frozen impulse lines can create pressure transmitter plugging, false low level trips, frozen condensate, hydrocarbon waxing, blocked pressure sensing, steam condensate freezing, cracked tubing, and instrument shutdowns. In many plants, these problems are first seen during night shifts, cold starts, or troubleshooting after an unexpected alarm.

The real issue is not only the freeze itself. The larger issue is the loss of measurement trust. Once a sensing line becomes unreliable, operators may hesitate, control loops may drift, and shutdowns may follow. This is why impulse line insulation and heat tracing are such important parts of process instrumentation maintenance.

Crack EPC Interview Questions Today: Instrumentation Designer Interview Questions and Answers for EPC Projects 

Impulse Line Freezing Risk and Heat Tracing Calculator for Instrumentation Engineers -  Best Practices for EPC, Maintenance and Commissioning Teams

Impulse lines should be routed with proper slope and minimal dead legs. If the routing is poor, fluids can become trapped and be more likely to freeze. And good routing increases drainage too, and access for maintenance.

Insulation must be kept dry to perform effectively. Sealed joints and waterproofing, especially appropriate jacketing, are important. Wet insulation loses effectiveness and can shorten the life of the freeze protection system.

Heat trace continuity testing and megger testing should be part of commissioning and routine maintenance. If the trace cable fails, the line may freeze even though the installation looks correct from the outside.

Know the DCS FAT Procedure: Factory Acceptance Test Procedure for Distributed Control System DCS

Impulse Line Freezing Risk and Heat Tracing Calculator for Instrumentation Engineers - Thermographic inspection for cold spots

Thermography is a useful field tool because it helps identify cold spots, failed sections, or uneven heating. It is one of the easiest ways to verify that the freeze protection system is working properly.

If steam tracing is used, steam trap inspection is critical. A failed trap can reduce heating performance and create a false sense of protection. Regular maintenance matters here.

Inspect Analyzer Systems the Right Way: Running Inspection Procedure for Analyzer and Sampling System in Process Industries

This calculator helps reduce uncertainty. Instead of guessing, the engineer can enter real values for tubing size, material, fluid behavior, ambient conditions, wind speed, insulation thickness, and heat tracing power. That makes the result much more useful for design review and maintenance planning.

It is especially helpful during EPC design review, winterization studies, commissioning verification, shutdown prevention, energy optimization, and predictive maintenance. It also gives different teams a common engineering reference, which makes decisions easier and faster.

Install and Remove DP Transmitters Safely: Step-by-Step Guide: Installing & Removing a DP Transmitter with a 5-Way Valve Manifold

This calculator is useful for instrumentation engineers, process engineers, maintenance teams, reliability engineers, EPC contractors, commissioning teams, plant operators and engineering students. It is useful for those working in transmitter freeze protection, impulse line insulation or process instrumentation maintenance.

Commission DP Transmitters Without Mistakes: Safe Commissioning & Removal of DP Transmitters with a 3-Way Valve Manifold

Impulse Line Freezing Risk and Heat Tracing Calculator for Instrumentation Engineers -  Real World Use Case Study

On a frigid morning shift, a refinery maintenance crew was troubleshooting an unreliable differential pressure transmitter on a process vessel. The transmitter was utilized for level indication and the reading had started to drift lower than normal. The operators originally suspected an issue with the transmitter but the instrument check proved that the transmitter itself was healthy. The actual problem was traced to the impulse line.

The sensing line was installed outdoors with limited insulation, and the route had a small low point where condensate collected. Overnight ambient temperature dropped below freezing, and wind exposure increased the heat loss from the tubing. The line sat still, and the liquids inside it cooled quickly. The outcome was partial freezing in the impulse line, which blocked the pressure signal and gave a misleading low-level reading.

The maintenance team reviewed the conditions of the line with the impulse line freezing risk and heat tracing calculator. They entered the tube size, wall thickness, length of the line, parameters of the fluid, ambient temperature, wind speed, insulation thickness and heat trace rating. The calculator indicated that the heat loss was greater than anticipated and the available heat tracing power was borderline for the weather circumstances. It also showed a short time to freeze, which was what the plant was observing in the field.

The corrective actions were simple and pragmatic. The crew increased the insulation, rectified the slope of the tubing, removed the low point and checked the continuity of the heat trace. After the work, the transmitter response became stable again and the freeze risk moved back into the safe range. This case showed that a transmitter problem is often actually a winterization problem.

Zero DP Transmitters the Safe Way: How to Safely Zero a DP Transmitter with 3-Way Valve and 5-Way Valve Manifolds.

The engineering team assessed the installation and determined that the line had sufficient heat tracing on paper, but insufficient practical freeze protection in the field. They used the calculator to compare heat loss with and without insulation and to estimate the time to freeze under the actual ambient conditions. The result showed that the line needed additional freeze protection margin. The team then upgraded insulation, improved weather sealing, and increased attention to trace cable verification during commissioning.

This kind of situation is very common in process instrumentation maintenance. The line may look fine during inspection, but if moisture, wind, and low ambient temperature combine, the thermal margin disappears quickly. The calculator is useful because it helps engineers see that risk before the plant experiences a measurement failure.

Choose the Right Pressure Manifold Fast: Key Considerations for Pressure Transmitter Manifold Selection

A frozen impulse line often shows up as one or more of these symptoms:

A transmitter reading that suddenly drifts or stays fixed even though the process is changing.

A differential pressure signal that appears too low, too high, or unstable.

A level indication that does not match the actual vessel condition.

Slow response of the transmitter after a chilly night

Alarms or trip circumstances that occur frequently but clear up as the line thaws.

These symptoms usually point to a freeze protection issue rather than a bad transmitter. In many cases, the instrument is only reporting what the blocked line allows it to see.

Understand Instrumentation Manifolds Clearly: What is manifold and types of manifolds and application of manifolds in Instrumentation?

It connects the process tapping point to the instrument and transmits pressure safely and accurately.
It also helps isolate, stabilize, and protect the transmitter from direct process conditions.

Impulse lines are small bore tubes used in instrumentation to carry process pressure from the plant line to a pressure instrument.
They are commonly used with pressure transmitters, DP transmitters, and level measurement systems.

In a flow meter, the impulse line carries pressure from the process or from upstream and downstream tapping points to the differential pressure transmitter.
It allows the transmitter to measure pressure difference and calculate flow.

Impulse tubing is normally installed with a proper slope to prevent air pockets, liquid traps, and condensate buildup.
The exact slope depends on the service, but it should always allow drainage and stable measurement.

Impulse lines freeze because they lose heat to the environment, and stagnant fluid inside the line cools faster than the process can replace it.

The best method depends on the service, but self regulating electrical heat tracing is often used because it is practical and easy to apply.

It depends on ambient temperature, wind speed, type of fluid, line length and the degree of freeze protection required.

The reading can be inaccurate, delayed, obstructed or unstable. This may compromise control and safety operation.

The wind enhances convective heat loss and accelerates the heat loss from the tubing surface.

Yes, but it must be designed and maintained carefully to stay effective.

Time to freeze is how long the line can stay above freezing before protection is needed.

Because it has no warmer fluid from the process to replace it.

Best insulation relies on application, temperature range, cost and maintenance expectations.

Since field circumstances are seldom perfect and the system needs more capacity for reliability.

Use Valve Manifolds Correctly: What are the uses of Valve manifolds?

Impulse line freezing is a real engineering problem, not a minor seasonal issue. A short length of tubing can affect measurement accuracy, process stability, and plant safety. That is why winterization of instrumentation should always include insulation, heat tracing, and a proper freeze protection review.

This calculator gives instrumentation professionals a practical way to evaluate heat loss, insulation effectiveness, time to freeze, and trace sizing before the problem reaches the field. It is a useful tool for design, commissioning, maintenance, and troubleshooting, and it supports better decisions for reliable process operation in cold weather service.

Advanced Guided Wave Radar Level Transmitter Commissioning Quiz for Process Industries

0
Advanced Guided Wave Radar Level Transmitter Commissioning Quiz for Process Industries

Guided wave radar level transmitters are essential components for accurate level measurement, plant safety and reliable plant operation. They are widely used in sectors like oil and gas, chemical, electricity, water treatment, food processing and pharmaceuticals. 

Proper commissioning gets rid of measurement inaccuracies caused by improper installation, false echoes, foam, moisture, dielectric change, grounding difficulties and configuration errors. Instrumentation engineers and maintenance workers must be familiar with calibration methods, diagnostics, probe selection, loop testing, and troubleshooting strategies to achieve stable and accurate performance. This difficult quiz will help to assess practical field knowledge and improve commissioning skills in real industrial situations.

Advanced Guided Wave Radar Level Transmitter Commissioning Quiz for Process Industries

Accurate measurement of levels is closely related to safety, production reliability and process efficiency and the commissioning of guided wave radar level transmitters is a crucial operation in modern process industries. Proper configuration, calibration, diagnostics and installation verification allow engineers to minimize false echoes, instability, communication failure and measurement inaccuracy during startup and operating performance testing of industrial facilities.

1 / 25

What is the final critical step after successful commissioning of a guided wave radar transmitter?

2 / 25

What is the most suitable action when buildup occurs on the probe surface?


3 / 25

During commissioning, why is probe length verification important?


4 / 25

Which process condition particularly favors guided wave radar technology?


5 / 25

What is the likely cause if the transmitter continuously indicates full level?


6 / 25

 Which diagnostic feature helps engineers analyze reflected signal quality?


7 / 25

Why should installation nozzles be minimized in height?

8 / 25

What commissioning problem may occur if shielding is grounded at both ends?


9 / 25

What is the major advantage of guided wave radar in high pressure vessels?


10 / 25

Which instrument is commonly used to configure guided wave radar transmitters during commissioning?


11 / 25

Which issue is commonly caused by excessive foam during commissioning?

12 / 25

What is the function of the blocking distance parameter?


13 / 25

Why is probe centering important inside stilling wells or chambers?


14 / 25

What is the primary purpose of damping configuration during commissioning?


15 / 25

Which probe type is commonly preferred for long measurement ranges?


16 / 25

What is the most likely cause of fluctuating level readings in heavy vapor applications?

17 / 25

Which commissioning activity verifies transmitter communication with the control system?


18 / 25

 Why should guided wave radar probes avoid incoming product streams?


19 / 25

What commissioning check is mandatory before energizing the transmitter?


20 / 25

What is the main advantage of guided wave radar compared to ultrasonic level transmitters?


21 / 25

During calibration verification, what output current should represent the configured zero level?


22 / 25

Why is proper grounding essential during commissioning?


23 / 25

Which parameter is most important for guided wave radar performance in low dielectric liquids?


24 / 25

What is the most common commissioning issue when the probe touches the tank wall?


25 / 25

During commissioning, what is the primary reason for performing false echo mapping in a guided wave radar level transmitter?


Your score is

The average score is 78%

0%

Access 1000+ MCQs tailored for instrumentation engineers: Instrumentation and Process Control Quiz Hub – 1000+ MCQs for Engineers 

#GuidedWaveRadar #GuidedWaveRadarLevelTransmitter #RadarLevelTransmitter #LevelMeasurement #LevelTransmitter #Instrumentation #InstrumentationEngineering #IndustrialAutomation #ProcessIndustries #ProcessAutomation #Commissioning #Calibration #InstrumentationCalibration #LevelMeasurementSystem #ProcessControl #IndustrialInstrumentation #PlantMaintenance #FieldInstrumentation #HARTCommunication #IndustrialEngineering #ProcessIndustry #InstrumentationTools #ControlEngineering #AutomationEngineering #IndustrialProcess #Troubleshooting #IndustrialSafety #EngineeringQuiz #TechnicalQuiz #RadarLevelMeasurement

Split Range Calculator for Control Valves in PLC and DCS Systems

0
Split Range Calculator for Control Valves in PLC and DCS Systems
Split Range Calculator
AUTOMATIONFORUM.CO · Your Trusted Source for Automation Power Tools & Solutions

Split Range Calculator

A practical engineering calculator for split range control, valve sequencing, overlap, gap, direct acting and reverse acting behavior, and controller output allocation used in PLC and DCS applications.

2-valve / 3-valve logic Engineering workflow Excel export Responsive interface

Controller Configuration

Choose mode and enter the controller output range
0%Live test point100%

Valve Sequencing

Define split points, overlap, gap, and valve action

Actions

Calculate, sample, reset, and export

Validation Messages

Shows invalid settings, gaps, and overlap warnings

Calculated Output

Active valve(s), split points, and control status

Sequencing Map

Controller output regions
0% 50% 100%

Valve Status

Opening, allocation, and active state

Full Range Sequence Table

Bands across the complete controller output

Engineering Interpretation

Useful for design review and troubleshooting
Formula explanation
Direct acting valve opening:
((CO - Start) / (Stop - Start)) × 100

Reverse acting valve opening:
((Stop - CO) / (Stop - Start)) × 100

Overlap:
previous stop − next start

Gap:
next start − previous stop

Application Note

Typical industrial use cases
Split range control is used when one controller output must drive more than one final control element. It is common in temperature control with steam and cooling valves, pressure letdown and bypass service, reactor utility control, and flow control where one valve handles fine control and another provides capacity. Overlap creates smooth handoff between valves, while a gap creates a dead zone that may be intentional or may indicate poor tuning or incorrect sequencing.

Split range control is one of the most common control techniques used in industrial automation and process industries. It is utilized when one controller output has to control several control valves or final control elements in a controlled sequence. In many industrial processes, a single valve cannot offer reliable and efficient control over the whole operating range. So for this reason engineers split the controller output into distinct areas, so that each valve works in a certain part of the output signal. This method is called split range control.

The attached Split Range Calculator is designed to help instrumentation engineers, PLC programmers, DCS engineers, process control specialists, commissioning engineers, and industrial maintenance professionals easily configure and analyze split range valve sequencing logic. The calculator supports two valve and three valve split range configurations, direct acting and reverse acting valves, overlap detection, gap detection, valve opening calculations, sequence mapping, engineering interpretation, and Excel export functionality.

In real process plants, split range control is used in temperature control systems, pressure control loops, boiler combustion systems, reactor utility systems, flow control applications, HVAC automation systems, fuel gas systems, and many other industrial applications.

A properly designed split range system improves:

  • Process stability
  • Valve handover smoothness
  • Energy efficiency
  • PID loop performance
  • Control accuracy
  • Operational reliability

A poorly designed split range system can create serious problems such as:

  • Valve hunting
  • Process oscillation
  • Dead zones
  • Poor valve handover
  • Unstable PID response
  • Excessive valve wear
  • Slow process response

This is why a practical engineering calculator becomes extremely useful during design, commissioning, testing, troubleshooting, and optimization.

Stop Valve Confusion with This Smart Automation Strategy: Why Split Range Control is Used in Industrial Automation

Split range control is a control strategy where one controller output is divided into multiple output regions to operate different valves or actuators.

Instead of sending the full output signal to one valve, the controller distributes the output across multiple valves according to predefined operating bands.

For example:

  • Valve 1 may operate from 0 to 50 percent controller output
  • Valve 2 may operate from 50 to 100 percent controller output
Importance of Split Range Control in PLC and DCS Systems

In some applications:

  • The ranges overlap
  • A dead zone or gap is intentionally created
  • Multiple valves operate together in a shared region

This type of logic is very common in PLC and DCS based automation systems.

Split range control is used because many industrial processes cannot be controlled efficiently using only one valve.

Different valves may be required for:

  • Low load operation
  • High load operation
  • Heating and cooling
  • Fine and coarse control
  • Makeup and venting
  • Utility balancing
  • Energy optimization

Using multiple valves allows engineers to:

  • Improve control precision
  • Extend operating range
  • Reduce valve wear
  • Improve process stability
  • Achieve smoother control transitions

Calculate Split Ranges Without Trial-and-Error Mistakes: Split Range Calculator – Control system

A Split Range Calculator is an engineering tool used to configure and analyze valve sequencing logic.

The attached calculator helps engineers determine:

  • Which valve becomes active at a particular controller output
  • Valve opening percentage
  • Overlap regions
  • Gap or dead band regions
  • Valve sequencing behavior
  • Direct acting and reverse acting response
  • Output allocation between valves

The calculator also helps engineers validate whether the sequencing logic is correct before implementation in a PLC or DCS system.

This is extremely valuable because many split range problems are discovered only during commissioning or startup.

The calculator reduces engineering errors and improves confidence before the actual process goes live.

Unlock Better Valve Sequencing in Real Plant Systems: Split Range Control in Control Valve Applications

Instrumentation engineers use this calculator during:

  • Control valve design
  • Loop configuration
  • Valve sequencing review
  • Commissioning
  • Troubleshooting

They use it to validate valve bands, overlap settings, and output allocation.

PLC programmers use split range calculators while developing:

Ratio Control That Keeps Process Balance Rock Solid: What is Ratio Control in Process Industries and How it Works

DCS engineers use the calculator to configure:

  • Split range controller blocks
  • Valve characterization
  • Output mapping
  • Function block logic
  • Sequence control

Commissioning teams use the calculator during:

  • FAT
  • SAT
  • Startup testing
  • Loop checks
  • Stroke testing
  • Performance verification

Process engineers use split range calculations to improve:

  • Process stability
  • Energy efficiency
  • Temperature control
  • Pressure control
  • Utility balancing

Maintenance teams use it during troubleshooting of:

  • Valve hunting
  • Oscillation
  • Sticky valves
  • Poor handover
  • Dead zones
  • Incorrect valve action

Master Valve Behavior Across Split-Range Control Modes: Understanding Control Valve Functions in Complementary, Exclusive and Progressive Split-Range Control Systems

This calculator is useful during multiple engineering stages.

Used for:

Override Logic That Protects Plants from Bad Upsets: Override Control in Process Industries for Industrial Safety

Used for:

  • Testing valve movement
  • Verifying split points
  • Checking valve handover
  • Confirming overlap behavior
  • Troubleshooting oscillation

Used when:

  • Process instability occurs
  • Valve sequencing becomes abnormal
  • PID loops become unstable
  • Valve overlap creates issues
  • Dead zones appear

Choose the Right Valve Sizing Numbers Every Time: Understanding Rangeability vs Turndown Ratio in Control Valve Sizing

Split range control is used in many industries including:

  • Oil and gas
  • Chemical plants
  • Refineries
  • Power plants
  • Food processing industries
  • Pharmaceutical industries
  • Water treatment plants
  • HVAC systems
  • Boiler systems
  • Utility systems

Decode Cascade Diagrams Before Troubleshooting Gets Messy: How to Read a DCS Cascade Control Loop Diagram: A Complete Guide with Example

Importance of Split Range Control in PLC and DCS Systems

The principle of operation is simple.

The controller output is separated in independent operating bands.

Each valve responds only within its assigned output range.

Example:

Controller OutputValve Action
0 to 50 percentValve 1 active
50 to 100 percentValve 2 active

In overlap configurations:

Controller OutputValve Action
45 to 55 percentBoth valves active

In gap configurations:

Controller OutputValve Action
48 to 52 percentNo valve active


Must-Have Valve Hardware for Stable Process Performance: Essential Control Valve Accessories for Reliable Process Control

A direct acting valve opens as the controller output increases.

Example:

  • 0 percent output = fully closed
  • 100 percent output = fully open

A reverse acting valve behaves in the opposite direction.

Example:

  • 0 percent output = fully open
  • 100 percent output = fully closed

The calculator supports both logic types, making it suitable for real industrial applications.

Tools Every Process Engineer Uses to Save Time: Essential Engineering Calculators for Process and Instrumentation Engineers

Overlap means two valves operate together within a shared region.

Example:

  • Valve 1 operates from 0 to 55 percent
  • Valve 2 operates from 45 to 100 percent

Result:

  • 45 to 55 percent becomes overlap region

Overlap helps:

  • Improve handover smoothness
  • Reduce process disturbance
  • Avoid sudden control jumps
  • Improve PID stability

Gap means there is a region where no valve is active.

Example:

  • Valve 1 stops at 45 percent
  • Valve 2 starts at 55 percent

Result:

  • 45 to 55 percent becomes dead zone

Intentional dead band may be used to:

  • Prevent both valves from operating together
  • Reduce unnecessary valve movement
  • Avoid interaction between utilities

However, excessive dead band can create instability.

PLC Signal Calculations That Cut Commissioning Errors: Collection of PLC Digital Signal Calculators for Industrial Automation

The attached calculator contains several advanced features designed specifically for automation engineers.

Useful for:

  • Heating and cooling systems
  • Low and high capacity control
  • Basic utility control

Useful for:

  • Advanced sequencing
  • Multi stage utility systems
  • Complex process control

Allows users to define:

Engineers can define:

  • Valve activation start point
  • Valve stop point
  • Valve sequencing bands

Direct Acting and Reverse Acting Logic: Supports both valve action philosophies.

The slider allows engineers to test:

  • Active valves
  • Valve opening
  • Sequence response

Automatically identifies overlap regions between valves.

Identifies dead zones between operating ranges.

Displays warnings for:

  • Invalid ranges
  • Excessive overlap
  • Dead zones
  • Incorrect settings

Shows the actual opening percentage for each valve.

Provides visual representation of:

  • Valve regions
  • Overlap areas
  • Gap areas

Shows:

  • Active valves
  • Inactive valves
  • Current operating condition

Displays full operating behavior across the controller output range.

Helps engineers understand the engineering calculations behind the logic.

Useful for:

Replace a Bad Positioner Without Wasting a Shift: Faulty Control Valve Positioner Replacement Procedure with Checklist

Industrial Applications of Split Range Control

One valve controls steam for heating.

Another valve controls cooling water.

The controller decides which utility should operate based on temperature demand.

Used with:

  • Vent valves
  • Makeup valves
  • Relief systems

Allows smooth pressure balancing.

Used in:

  • Fuel sequencing
  • Air control
  • Load balancing

Allows smooth switching between:

  • Heating utilities
  • Cooling utilities

A small valve handles precision control.

A larger valve handles bulk capacity.

Used for:

  • Low flow dosing
  • High flow addition
  • Accurate chemical control

Used for:

  • Pressure balancing
  • Safe venting
  • Utility coordination

Used in:

  • Chilled water systems
  • Hot water systems
  • Air handling systems

Big Instrumentation Calculator Collection for Daily Engineering Work: 100+ Online Instrumentation Calculators and Engineering Tools

Valve Opening = ((CO minus Start) divided by (Stop minus Start)) multiplied by 100

This formula determines how much the valve opens based on controller output.

Reverse Valve Opening = ((Stop minus CO) divided by (Stop minus Start)) multiplied by 100

Used when valve response is reversed.

Overlap = Previous Stop minus Next Start

Positive value means overlap exists.

Gap = Next Start minus Previous Stop

Positive value means dead zone exists.

APC Basics That Improve Plant Stability Fast: Advanced Process Control (APC): Working Principle, Components, Benefits, Applications and DCS Integration

More accurate engineering calculations Reduced manual calculations.

Reduced Commissioning Errors – Assists in checking settings before to commencement.

Enhanced valve sequencing: Ensures a more seamless handover.

Improved PID Response. Improves loop stability.

Simplified PLC and DCS Configuration: Easier to Implement.

Easier Troubleshooting Identify:

  • Wrong split points
  • Overlap issues
  • Dead zones
  • Incorrect valve action

Improved Process Stability: Enhances overall control performance.

Three-Element Control Made Easy for Operators: Three Element Control

Real Engineering Challenges in Split Range Control
  • Sticky Valves: Sticky valves lead to bad handover and unstable control.
  • Valve Hunting: Happens when the overlap or tune is wrong.
  • Bad Valve Handover : Split point drifting may induce sudden process disruptions.
  • Unstable process response may be caused by excess dead band.
  • Wrong Reverse Acting Configuration: Wrong action configuration causes wrong process behavior.
  • Bad PID Tuning: Even solid split range logic might fail if tuning is bad.

Tune PID Loops for Faster, Cleaner Response: PID controller tuning

Best Practices for Split Range Control

Choose Correct Overlap Too much interaction overlap Little overlap means awkward handover.

Don’t Use Too Much Dead Band: Too much dead band makes it more difficult to run the system in a stable manner.

Always check for Valve Action during commissioning:

  • Direct acting
  • Reverse acting

Use Proper Valve Sizing Proper valve sizing is critical to split range performance.

Always test during commissioning:

  • Valve movement
  • Handover
  • Overlap
  • Gap behavior

Use Smart Positioners: Increases the accuracy and reactivity of the valve.

Tune PID Properly: Before tuning, check sequencing logic.

Follow Fail Safe Philosophy to make sure suitable fail action in:

  • Air failure
  • Signal failure
  • Power loss

Find and Fix Offset Before It Hurts Production: What is offset in Process control?

How This Split Range Calculator Helps Engineers

Split range control is a control approach in which one controller output controls several control valves over different output ranges. It is frequently used in PLC and DCS systems for temperature, pressure and flow control applications.

A split range calculator is an engineering tool to compute valve sequencing, overlap, gap and controller output distribution among several valves. This lets engineers verify split range logic before commissioning and startup.

Overlap is utilized for seamless transfer between valves and to prevent unexpected process interruptions during valve transition. It also enhances PID stability and minimizes oscillation around split points.

Dead band is a region where no control valve is active between two operating ranges in a split range system. It is sometimes used intentionally to avoid simultaneous valve operation.

The reverse acting valve functions contrary to the controller output. That is, the valve shuts as the output increases or vice versa. It is utilized widely in split range heating and cooling applications.

Use Feedback and Feedforward to Control Faster: What are feedback and feedforward control?

Split range logic in PLC systems separates the controller output into different operating ranges for several valves/actuators. The PLC performs scaling and sequencing logic to open the appropriate valve within its programmed range.

DCS systems utilize split range control blocks or output characterization functions to divide one controller output to numerous control valves. This enables seamless sequencing and automatic valve handover.

Valve hunting is frequently caused by bad PID tuning, too much overlap, sticky valves or wrong split range setup. Oscillations can also be caused by improper valve sizing and inappropriate hand-over settings.

Valve overlap is the difference between the following valve start point and the prior valve stop point. If the value is positive, both valves have an active operating region.

Split range PID loops are tuned by checking valve sequencing first, then tuning the proportional, integral and derivative parameters to provide a stable response. Proper selection of overlap and valve sizing is also vital for smooth control.

Common applications of split range control include chemical plants, refineries, HVAC systems, boilers, reactors, and pressure control. This is especially important when one controller has to operate more than one valve.

Split range control enhances process stability increases operational range minimizes valve wear and enables smoother control transitions. It also provides better energy optimization and improved process efficiency.

Split range valves are designed by defining the distinct controller output ranges for each valve and defining direct or reverse action behavior . Then the overlap or dead band setting is changed according to the process need.

Valve handover is critical as faulty valve transitions can result in oscillation, instability and unexpected process upsets. Smooth handover enhances PID response and control performance.

Overlap is when two valves are in common control of the output range of a controller, in overlap there is a dead zone where no valve is operating. Both conditions have a high impact on the process stability and control behaviour.

Alarm Management Rules That Reduce Plant Chaos: Guide to Industrial Process Alarms in Control Systems: Types, Classifications, and Management Methods

Split range control is one of the most practical and valuable control strategies used in industrial automation. It allows one controller output to efficiently manipulate many control valves throughout a range of operational circumstances.

When designed properly, split range control improves:

  • Process stability
  • Valve handover
  • Energy efficiency
  • PID loop response
  • Operational reliability

The attached Split Range Calculator is a highly practical engineering tool for instrumentation engineers, PLC programmers, DCS engineers, process control specialists, commissioning teams, and maintenance engineers. It simplifies complex valve sequencing calculations and helps engineers visualize overlap, gap, direct acting behavior, reverse acting behavior, and valve allocation logic before actual implementation.

Siemens S7 300 PLC Discontinued Migration Guide for Engineers

0
Siemens S7 300 PLC Discontinued Migration Guide for Engineers
Table of Contents

For more than two decades, the Siemens S7 300 PLC dominated industrial automation across manufacturing plants, water treatment facilities, power stations, pharmaceutical plants, oil and gas installations, food factories, OEM machinery, and process industries.

From small standalone machine control to large distributed automation systems, the S7 300 platform became the engineering standard for thousands of industrial facilities worldwide.

Many engineers built entire careers around:

  • STEP7 V5.x programming
  • PROFIBUS DP networks
  • ET200M remote I/O systems
  • WinCC Flexible HMIs
  • STL and AWL programming
  • PID loop control
  • Modular distributed architectures

Even today, many factories continue running 15 to 20 year old S7 300 systems without major issues.

That is exactly why the current situation is becoming critical.

Plants are now facing:

  • Legacy system risk
  • Spare parts shortages
  • Unsupported engineering software
  • Aging PROFIBUS infrastructure
  • Cybersecurity exposure
  • Increasing downtime probability
  • Limited hardware availability
  • Difficulty finding experienced STEP7 engineers

For many industrial facilities, the biggest danger is not PLC failure.

The biggest danger is unexpected production shutdown with no recovery strategy.

Modernization is no longer optional.

It is becoming a plant survival requirement.

Stop Using Old PLCs Before These Failures Hit: Siemens LOGO! 9 Explained: Features, Benefits and Comparison with Older Siemens Controllers

Siemens S7 300 PLC Discontinued Migration Guide for Engineers

The phrase “Siemens S7 300 discontinued” often creates confusion among engineers and maintenance teams.

The reality is more nuanced.

Siemens introduced lifecycle management phases for automation products long before complete discontinuation. The S7 300 platform went through many lifetime stages, such as active sales, phase-out, spare-part support, and repair availability.

Siemens’ migration guidelines and lifecycle planning materials highly encourage moving to contemporary platforms like the S7 1500 for future sustainability.

Lifecycle PhaseMeaning
Active ProductFully supported and actively sold
Phase OutGradual reduction in sales and availability
Spare Part PhaseLimited availability mainly for maintenance
ObsoleteProduct no longer supported

Many engineers misunderstand the difference between discontinued and obsolete.

A discontinued PLC may still function perfectly for years.

However, risks increase rapidly when:

  • Spare CPUs become expensive
  • PROFIBUS cards disappear from stock
  • MMC cards fail
  • Legacy HMIs become unsupported
  • STEP7 compatibility issues appear on modern Windows systems

This is why modernization planning matters now instead of waiting for a plant emergency.

Master Siemens TIA Counters Before Your Next Project: How to use Siemens TIA Portal to create Different Counter blocks in PLC?

Many S7 300 CPUs and communication cards now cost significantly more in secondary markets than they did when originally released.

Critical modules such as:

  • CP343 communication processors
  • FM modules
  • PROFIBUS cards
  • ET200M interfaces
  • Analog input cards

are becoming difficult to source.

In some plants, maintenance teams already purchase used modules from third party suppliers just to maintain operations.

That creates major reliability concerns.

Many facilities still rely on:

  • STEP7 V5.5
  • WinCC Flexible 2008
  • Windows XP engineering stations

This creates severe operational problems including:

  • Hardware driver incompatibility
  • USB adapter failures
  • Licensing problems
  • Virtual machine dependency
  • Cybersecurity exposure

Modern IT departments increasingly reject unsupported operating systems on industrial networks.

PROFIBUS networks still work reliably in many factories.

However, aging connectors, grounding issues, cable degradation, and network loading problems are becoming more common every year.

Many troubleshooting engineers report intermittent communication faults that only appear during production peaks.

These issues become extremely difficult to diagnose in legacy systems.

One hidden industrial risk is engineering knowledge loss.

Younger automation engineers are increasingly trained on:

  • TIA Portal
  • S7 1500
  • PROFINET
  • OPC UA
  • Unified HMI
  • Industrial Ethernet

Very few engineers now specialize deeply in:

That creates long term maintenance risk.

Hidden Reason Behind 75 Ohm ControlNet Resistors: Why 75 Ohm Termination Resistor is Used in ControlNet?

Most existing plants follow a familiar architecture.

  • S7 300 CPU
  • ET200M remote I/O
  • PROFIBUS DP backbone
  • WinCC Flexible panels
  • MCC communication
  • VFD integration
  • Third party Modbus gateways
  • SCADA communication
  • Batch systems
  • PID control loops

A water treatment plant may contain:

  • CPU315 2DP
  • Multiple ET200M panels
  • PROFIBUS connected VFDs
  • SCADA interface
  • Remote pumping stations
  • GSM telemetry
  • Analog instrumentation
  • Hardwired interlocks

A pharmaceutical plant may additionally include:

  • Batch control
  • Recipe handling
  • Audit trail requirements
  • Redundant servers
  • Safety interlocks
  • Validation documentation

Migration complexity increases significantly depending on these integrations.

Why ControlLogix 5590 Is Dominating Smart Manufacturing: ControlLogix 5590 Explained: Next-Gen PLC for Smart Manufacturing

Choosing the right migration target is not just about replacing hardware. It is about matching the new controller to the plant structure, the network architecture, the future maintenance model, and the amount of downtime the plant can tolerate. Siemens’ migration guide makes the same point clearly: migration planning should consider the whole plant, not only the PLC rack, because the final system may require changes in hardware, software, communication, HMI, and service strategy.

  • The S7 1200 is the better target for smaller applications where the control task is relatively compact and the architecture is not heavily distributed. 
  • It is a good fit for small standalone machines, OEM equipment, and systems with limited I/O, limited networking, and straightforward logic. 
  • In other words, it is ideal when the machine needs a modern controller, but does not need the scale or engineering depth of a larger plant platform. 
  • Siemens positions the S7 1200 as the basic controller class, while the S7 1500 is the advanced controller class.
  • The S7 1500 is the preferred migration target for most industrial plants because it is built for higher performance, stronger diagnostics, modern communication, and long term modernization. 
  • Siemens highlights features such as Ethernet communication, PROFIBUS and PROFINET communication, integrated web server, integrated technology, integrated system diagnostics, industrial security functions, and safety versions for the CPU family. 
  • It also supports motion control and provides an integrated display for local diagnostics and operator support.
  • For migration projects, this matters because the S7 1500 is not just a newer CPU. It changes the maintenance experience. 
  • Symbolic programming, optimized blocks, larger memory, built in diagnostics, and stronger security features make the plant easier to support over time. 
  • Siemens also notes that the S7 1500 offers much larger memory capacity and modern software handling compared with S7 300 and S7 400 systems.
  • ET200SP is a strong choice when the plant needs a compact, modular distributed I O system with modern PROFINET based communication. Siemens describes ET200SP as a control cabinet solution with IP20 protection and fine modular construction. It supports both PROFIBUS and PROFINET, and it is integrated in TIA Portal. That makes it especially useful for compact cabinets, machine sections, and modern distributed installations where space, wiring simplicity, and diagnostics matter.
  • ET200MP is the right option when you want to modernize a traditional S7 300 style rack architecture without losing the feel of a centralized cabinet design. 
  • Siemens lists ET200MP as a control cabinet, IP20, multi channel distributed I O platform, and it can connect via PROFIBUS or PROFINET while remaining integrated in TIA Portal. 
  • That makes it a practical replacement where the original plant structure is rack based, but you still want a cleaner route into the S7 1500 ecosystem.

A simple way to choose is this:

  • choose S7 1200 for small and self contained machine control
  • choose S7 1500 for most plant modernization projects
  • choose ET200SP for compact distributed stations
  • choose ET200MP for rack like centralized modernization with better future support

Siemens also recommends planning migration by evaluating the whole installed base, communication dependencies, third party systems, and the final plant target, not by looking only at one controller in isolation.

PLC Documentation Mistakes That Cause Dangerous Plant Trips: PLC Alarm and Trip Documentation Procedure – EPC PLC Automation Engineer Guide

FeatureS7 300S7 1500
Engineering PlatformSTEP 7 ClassicTIA Portal
CommunicationPROFIBUS focusedPROFIBUS and PROFINET native
DiagnosticsLimitedIntegrated system diagnostics
Web ServerExternal or not available in the same wayIntegrated web server
SecurityBasicIntegrated industrial security functions
MemoryLower capacityMuch larger memory and bigger block support
Motion ControlUsually external or separateIntegrated technology and motion functions
OPC UALimitedNative ready for modern integration scenarios
PerformanceModerateHigher system performance
DisplayNoneIntegrated local display on many CPUs
Programming StyleHeavy absolute addressing and legacy patternsSymbolic, optimized, more maintainable
Future SupportDeclining lifecycleDesigned for long term modernization
Industry 4.0 ReadinessLimitedStrong fit for connected plants
Siemens S7 300 PLC Discontinued Migration Guide for Engineers - Why S7 1500 Is Better for Industry 4.0 Integration

The technical gap is larger than it first appears. Siemens explains that S7 1500 uses optimized blocks, symbolic addressing, much larger data blocks, new data types, integrated diagnostics, versioned libraries, access protection, and modern online functions such as trace and complete uploads.

The biggest practical difference is this: S7 300 is usually maintained as a legacy platform, while S7 1500 is engineered to become the future operating standard. That is why the S7 1500 architecture provides major engineering advantages beyond simple hardware replacement.

PLC Resolution Secrets Every Automation Engineer Must Learn: Resolution in PLCs – The Complete Guide for Automation & Instrumentation Engineers

Siemens S7 300 PLC Discontinued Migration Guide for Engineers - Complete Siemens S7 300 Migration Strategy

Start with a full plant audit before touching hardware or software. This is where many migration projects succeed or fail.

Document every connected item, including:

  • PLC hardware and CPU type
  • Firmware versions
  • Signal modules and communication modules
  • Network topology
  • HMI panels and operator stations
  • Third party devices and gateways
  • Analog instruments
  • Drives and motor starters
  • Safety components
  • Remote I/O stations
  • Existing cabinets, marshalling, and field wiring

A proper audit is not just a list of parts. It is a map of how the plant really works. Siemens specifically recommends identifying the status quo of the plant and analyzing all components, including third party systems and communication dependencies.

Scaling Analog Signals Correctly in PLC Automation Systems: Scaling Analog Values in Industrial Automation (PLC)

Before any migration, create complete and verified backups of everything that may be needed for recovery.

Backup items should include:

  • STEP 7 project files
  • CPU uploads
  • MMC card contents
  • HMI projects
  • SCADA project archives
  • Drive parameter files
  • Communication settings
  • Recipe and batch data
  • Alarm archives and historical data

Do not rely on a single backup copy. Keep one local, one external, and one archived version.

Many migration failures happen because the plant has an old project, but not a verified project. There is a big difference between having a file and having a backup that can actually restore the system after a fault.

Best practice:
Test the backup before migration day. A backup that has never been opened or restored is only a hope, not a recovery plan.

The network is often where hidden migration problems appear first.

Check the following:

  • PROFIBUS loading and bus health
  • Cable shielding and grounding
  • Connector condition
  • Repeaters and segment limits
  • Switches and managed Ethernet devices
  • IP address planning
  • Device naming rules
  • Communication watchdogs and timeout settings

Legacy PROFIBUS systems may look stable, but once the new PLC is installed, timing and communication behavior can change. That is why the network must be checked before hardware mapping begins.

Practical warning:
A plant can have good process equipment and still fail a migration because of weak grounding, bad connectors, or a noisy bus segment.

Once the audit is complete, map every old device to a modern target.

Typical migration paths include:

  • ET200M to ET200SP
  • PROFIBUS to PROFINET
  • WinCC Flexible panels to Comfort Panels
  • Legacy communication modules to integrated Ethernet based options
  • Rack based architectures to modular distributed architectures

This step is more than choosing an equivalent part number. It is about deciding whether the old architecture should be preserved, simplified, or redesigned.

Siemens notes that partial migration, complete migration, or phased migration may all be valid depending on plant complexity, downtime tolerance, and future expansion plans.

Engineering tip:
If the plant still depends on old I/O or old communication structure, a phased migration is often safer than a full cutover.

Simple PLC Motor Starter Logic Engineers Must Understand: PLC Program for Motor Starter with Low-Level Switch Interlock

Software conversion is where many projects become more difficult than expected.

A good migration must include:

  • Code analysis
  • STL and AWL review
  • Addressing review
  • Library restructuring
  • Block naming cleanup
  • PID loop review
  • Sequence logic validation
  • Data block conversion
  • Symbolic programming strategy

Siemens recommends reviewing the project carefully before migration and using the readiness check tool where needed. It also notes that some older structures may need adjustments after conversion, especially when special instructions, options, or unsupported components are used.

Important reality:
Direct conversion is not always the best engineering choice. In many cases, rewriting selected blocks in a cleaner TIA Portal structure gives better long term maintainability than carrying forward every old programming habit.

PLC Data Type Mistakes Destroying Industrial Automation Projects: PLC Data Types Every Automation Engineer Must Know to Avoid Costly Programming Errors

HMI work is often underestimated because it looks smaller than the PLC migration, but in practice it can consume a large part of the project schedule.

HMI migration may include:

  • Alarm mapping
  • Tag remapping
  • Recipe conversion
  • Historical data migration
  • Screen redesign
  • Navigation changes
  • User access updates
  • Language changes
  • Trend and archive conversion

Siemens’ migration guide also points out that older panels are discontinued and recommends moving to more modern HMI families such as Basic or Comfort Panels, with version compatibility requirements for project migration.

Practical problem:
Even when the PLC conversion succeeds, the plant may still stop if the HMI tags, alarms, or recipes do not align with the new controller structure.

Factory Acceptance Testing is the point where the migration is proven before the system reaches the plant floor.

FAT should simulate:

  • All key I/O operations
  • Alarm handling
  • Communication failures
  • Power recovery behavior
  • Startup and shutdown sequences
  • Interlocks and permissives
  • Drive commands
  • Redundancy or fallback logic
  • Operator actions

This is the stage where hidden logic problems are found while there is still time to fix them.

Best practice:
Do not limit FAT to “the machine starts.” Test abnormal conditions too. Many plants only discover logic weaknesses during alarms, power dips, or network drops.

Siemens S7 300 PLC Discontinued Migration Guide for Engineers - Perform Factory Acceptance Testing FAT

Site Acceptance Testing confirms that the migrated system works under real process conditions.

SAT should verify:

  • Actual field signals
  • Real network communication
  • Live instrument values
  • Motor starting sequences
  • Process interlocks
  • Safety responses
  • HMI operation
  • Alarm response time
  • Operator workflow

This is the last major checkpoint before the plant depends on the new system for production.

Practical warning:
SAT should not be treated as a formality. It is where commissioning differences between the test bench and the real plant often become visible.

NO vs NC Contact Confusion Ruining PLC Logic Designs: Understanding NO vs NC Contacts is key for Logic Writing in PLC Programming

Every migration project needs a clear rollback strategy.

That means knowing in advance:

  • What condition triggers rollback
  • How long rollback will take
  • Which backups will be used
  • Which cables or modules must be restored
  • Who authorizes the decision
  • How production restart will be managed

Without rollback planning, the plant is forced into a one way decision during commissioning. That is where downtime risk becomes dangerous.

Siemens’ guidance also emphasizes fallback strategy, sufficient time buffers, detailed planning, and testing before the point of no return.

Simple rule:
If the old system cannot be restored quickly, the cutover plan is incomplete.

Fastest Way to Troubleshoot PLC Permissive Logic Failures: PLC Permissive Logic Troubleshooting Procedure for Instrumentation Engineers

A strong execution order is usually:

  1. Audit the existing plant
  2. Backup every project and device
  3. Analyze communication and dependencies
  4. Map hardware replacements
  5. Convert software in a controlled way
  6. Migrate the HMI separately if needed
  7. Run FAT with failure scenarios included
  8. Execute SAT under real process conditions
  9. Cut over during a controlled shutdown window
  10. Keep rollback capability until stable operation is confirmed

Critical PLC Panel Inspection Checks Engineers Often Ignore: Running Inspection Checklist of PLC Components in Control Panels

Siemens S7 300 PLC Discontinued Migration Guide for Engineers - TIA Portal Migration Process for Siemens S7 300

Migrating from STEP7 Classic to TIA Portal is one of the most critical phases in a Siemens PLC modernization project. On paper, the migration wizard looks simple. In real industrial environments, however, migration becomes a combination of software conversion, architecture redesign, hardware compatibility analysis, and commissioning risk management.

The Siemens migration guide explains that migration involves much more than opening an old project in TIA Portal. It includes project preparation, consistency checking, hardware inclusion, migration logs, compilation analysis, and correction of unsupported components.

For many plants, this is the first time the original PLC program has been deeply reviewed in years.

Why Hot Standby PLC Systems Prevent Costly Downtime: Hot Standby in PLC Systems: Architecture, Working, and Benefits

A structured migration workflow reduces engineering risk and helps avoid commissioning surprises.

A practical migration sequence usually includes:

  • Verify project consistency
  • Run readiness check
  • Open TIA Portal
  • Start migration wizard
  • Import STEP7 project
  • Review migration logs
  • Resolve unsupported components
  • Compile project
  • Correct errors
  • Test communication

The most important part is not the import itself. The most important part is understanding what changed after conversion.

Triconex vs Traditional PLCs: Safety Differences You Must Know: Difference Between Triconex PLC and Other PLCs: A Complete Guide

Before the migration can proceed, the original STEP7 project has to be cleaned and confirmed.

This includes:

  • Block consistency checking
  • Hardware diagnostics review
  • Symbol table validation
  • Communication verification
  • Alarm configuration review
  • Removal of obsolete objects
  • Backup of original archives

The migration method can result in inconsistencies if the original project has problems incomplete or unstable results.

Siemens specifically recommends consistency checking before migration because corrupted or partially modified projects may fail during conversion.

The Readiness Check Tool is one of the most important migration utilities in Siemens modernization projects.

It helps identify:

  • Unsupported hardware
  • Obsolete communication modules
  • Incompatible software blocks
  • Unsupported HMI objects
  • Safety conversion limitations
  • Legacy functions requiring manual correction

This stage often reveals hidden engineering problems that the plant team was unaware of.

A common example is discovering that the plant still depends on:

  • Old CP communication cards
  • Proprietary OPC drivers
  • Legacy WinCC Flexible objects
  • Unsupported GSD files
  • Third party PROFIBUS devices

Without this assessment, migration planning becomes incomplete.

Why Smart PLC Programmers Prefer RTO Over TON: Why is RTO Used in Place of TON Timer in PLC Program?

During migration, TIA Portal attempts to include the original hardware configuration inside the new project environment.

However, not all legacy devices have direct replacements.

This usually requires:

  • CPU replacement selection
  • Communication module replacement
  • Remote I/O migration planning
  • HMI replacement mapping
  • Network redesign

Many plants discover that the hardware migration itself is easier than adapting the communication structure around it.

For example:

  • MPI networks may disappear completely
  • PROFIBUS segments may migrate to PROFINET
  • ET200M may move to ET200SP
  • Old panels may require complete redesign

This is why migration projects should always be treated as system modernization projects rather than simple PLC upgrades.

One of the most overlooked engineering tasks is analyzing migration logs properly.

TIA Portal generates logs that identify:

  • Unsupported instructions
  • Replaced functions
  • Addressing conflicts
  • Missing drivers
  • Obsolete hardware references
  • Failed conversions

Experienced engineers spend significant time reviewing these logs before testing begins.

Ignoring migration warnings is one of the fastest ways to create commissioning problems later.

Dangerous Rockwell PLC Vulnerability Every Engineer Must Address: Critical Flaw in Rockwell ControlLogix CVE-2024-6242 – Trusted Slot Bypass Vulnerability

Same PC Migration

Same PC migration is possible when:

  • STEP7 Classic and TIA Portal coexist
  • Licensing is compatible
  • Required drivers are available
  • Windows compatibility is maintained

This approach is faster in smaller projects.

However, many industrial sites avoid this method because older STEP7 environments often depend on:

  • Windows XP
  • Legacy USB drivers
  • Old MPI interfaces
  • Unsupported licensing systems

Mixing old and new engineering software on the same machine sometimes creates instability.

Different PC Migration

Many engineers prefer using separate engineering systems for migration.

In practice, this usually means:

  • One legacy engineering station for STEP7 Classic
  • One modern engineering station for TIA Portal
  • Separate backup environments
  • Virtual machine support for legacy access

This reduces the risk of damaging the original project environment.

It also gives the engineering team a rollback option if conversion problems occur.

In many real plants, the old engineering laptop becomes a protected recovery system during the entire migration project.

Most migration failures are not caused by hardware replacement.

They are caused by hidden software assumptions inside legacy automation systems.

These issues usually remain invisible until commissioning begins.

Older STEP7 projects often rely heavily on:

  • M memory
  • Absolute DB addressing
  • Pointer based logic
  • Direct byte manipulation

These methods worked well in older architectures but become difficult to maintain in modern symbolic programming environments.

When migrating to S7 1500, symbolic programming becomes extremely important because optimized blocks behave differently from traditional absolute addressing structures.

Common Real World Problem

An old batching system may use:

  • DB100.DBW12
  • M250.0
  • Pointer indirect access

across hundreds of functions.

After migration, troubleshooting becomes extremely difficult because the original memory relationships no longer behave exactly the same way.

Many engineering teams eventually choose partial code rewriting instead of carrying forward legacy addressing structures forever.

Prevent PLC I/O Failures Before They Shut Down Plants: Proactive Maintenance Strategies for PLC I/O Modules: Reduce Downtime & Improve Reliability

Large industrial plants often contain extensive STL or AWL programming developed over decades.

These sections may include:

  • Indirect addressing
  • Jump logic
  • Pointer arithmetic
  • Custom communication handling
  • Complex sequencing

While some STL logic can migrate, maintaining large STL based projects inside modern TIA Portal environments becomes increasingly difficult.

That is why many modernization projects gradually convert critical logic into:

  • SCL
  • Structured modular blocks
  • Library based functions

Why Engineers Move Toward SCL

SCL improves:

  • Readability
  • Diagnostics
  • Scalability
  • Long term maintainability
  • Team collaboration

Younger engineers are also far more comfortable supporting structured code compared with heavily compressed STL logic.

Siemens S7 300 PLC Discontinued Migration Guide for Engineers - PROFIBUS to PROFINET Migration Challenges

This is one of the biggest hidden engineering risks in modernization projects.

At first glance, replacing PROFIBUS with PROFINET seems simple.

In reality, engineers often encounter:

  • Device naming conflicts
  • IP addressing problems
  • Network timing changes
  • Communication latency differences
  • Switch configuration issues
  • VFD communication instability

The behavior of PROFIBUS systems was serial and deterministic. PROFINET introduces Ethernet based communication with different network behavior and infrastructure requirements.

Common Field Failure

A plant may successfully start motors during FAT testing, but experience intermittent communication drops during full production load because switch configuration or network segmentation was not properly designed.

Boost PLC Performance Using These Proven Optimization Techniques: How to Increase PLC Speed: 7 Optimization Tips + Advanced Programming Guide

Older HMIs often depend on communication methods that are no longer standard.

These may include:

  • MPI
  • PROFIBUS
  • Proprietary drivers
  • Old panel firmware

Migration frequently causes:

  • Alarm failures
  • Recipe corruption
  • Screen navigation problems
  • Communication timeout issues
  • Historical data mismatch

Many engineers underestimate how tightly older HMIs are connected to the original PLC memory structure.

Once symbolic addressing changes, the HMI often requires extensive rework.

One hidden problem in S7 1500 migration is CPU execution speed.

S7 1500 processors execute logic much faster than older S7 300 CPUs.

That sounds beneficial, but it can unexpectedly affect:

  • Pulse timing
  • Counter operation
  • PID loop stability
  • Conveyor sequencing
  • Start and stop synchronization

Real Industrial Example

An old machine may rely on scan cycle timing assumptions created 15 years ago.

After migration, outputs react faster and sequencing overlaps begin appearing intermittently.

This creates startup failures that are difficult to reproduce during testing.

Third party systems are often the most dangerous part of a migration project.

Examples include:

  • Modbus gateways
  • Barcode systems
  • OPC servers
  • Energy meters
  • Packaging machines
  • Weighing systems

Many older drivers were written specifically for:

  • STEP7 Classic
  • Windows XP
  • Old communication libraries

During modernization, these systems may fail completely or require expensive replacement.

Most Widely Used PLC Brands in Industrial Automation Today: Which PLC is Mostly used in the Automation Industry?

Yes, some S7 300 repair options and spare parts support may still be available depending on the module type and region.
For industrial automation upgrade planning, engineers should not depend only on repair and should prepare a migration strategy.

Yes, STEP 7 to TIA Portal migration is possible using the migration wizard and readiness check tools.
To migrate smoothly from a Siemens S7 300 to a S7 1500, begin by verifying project consistency and hardware compatibility.

Review or conversion of legacy code is typically necessary due to restricted STL support in S7 1500 compared to STEP7 Classic.

For Siemens TIA Portal migration the translation to symbolic programming and SCL conversion is preferred in general for improved maintainability.

Yes, ET200M can sometimes be re-used during a phased S7 300 migration, depending on the plant design and the CPU target.
For long term ET200M replacement, ET200SP or ET200MP is usually a better choice in PLC modernization projects.

WinCC Flexible support is now limited, and many plants are moving to WinCC migration in TIA Portal.
For long term HMI modernization, Comfort Panels and Unified Panels are the better future proof option.

PLC Ladder Logic Rules Every Programmer Must Follow: Top 6 Important Rules for PLC Ladder Diagram Programming

Yes, existing field wiring can often be reused in a Siemens S7 300 to S7 1500 migration if the cabinet design allows it.
A proper hardware mapping study is needed before ET200M replacement or HMI migration begins.

The biggest PLC migration risk is unexpected downtime due by insufficient testing, missing backups or concealed communication problems.

A good FAT and SAT plan is crucial for safe execution of the industrial automation upgrade.

Migration time is a function of plant size, architecture complexity, scope of safety and amount of HMI or SCADA work needed.

A modest S7 300 transfer might be rapid, but a full TIA Portal migration from PROFIBUS to PROFINET will take significantly longer.

S7 1200 Ideal for tiny stand-alone systems and simple OEM automation applications.

For bigger Siemens PLC upgrade projects, S7 1500 is usually the preferred target because of performance and diagnostics.

S7 1500 is selected for higher performance, enhanced diagnostics, cyber security and good long term support.

It is the greatest solution for future proof automation, Industry 4.0 preparedness and current TIA Portal migration plans.

Migration of a Safety PLC must be approached cautiously, as validation, SIL standards, and safety testing are needed.
Direct conversion is not enough, so every safety system should be tested, documented, and approved before cutover.

Absolutely, every Siemens S7 300 migration should include cybersecurity upgrades as part of PLC lifecycle management.
Modern S7 1500 systems support stronger security, better access control, and safer industrial automation connectivity.

Allen Bradley PLC Datasheet Reading Made Extremely Simple: How to Read the PLC Datasheet: Allen-Bradley 1762 Model Step-by-Step Guide

The Siemens S7 300 platform transformed industrial automation and continues running critical infrastructure worldwide.

But the industrial landscape has changed.

Plants now face:

  • Spare part shortages
  • Cybersecurity pressure
  • Aging networks
  • Unsupported software
  • Rising downtime risk

Migration is no longer just a hardware upgrade.

It is a strategic modernization project that impacts:

  • Reliability
  • Productivity
  • Cybersecurity
  • Maintainability
  • Future scalability

The most successful migration projects are not the fastest projects.

They are the best planned projects.

A properly engineered S7 300 to S7 1500 migration can deliver:

For automation engineers, system integrators, and modernization teams, the time to plan migration is now before the next unexpected failure becomes a production disaster.