AUTOMATIONFORUM.CO
Your Trusted Source for Automation Power Tools & Solutions
Differential Pressure to Flow Calculator
* This calculator is a quick reference, it might have some errors.
📊 Calculating flow based on values of differential pressure
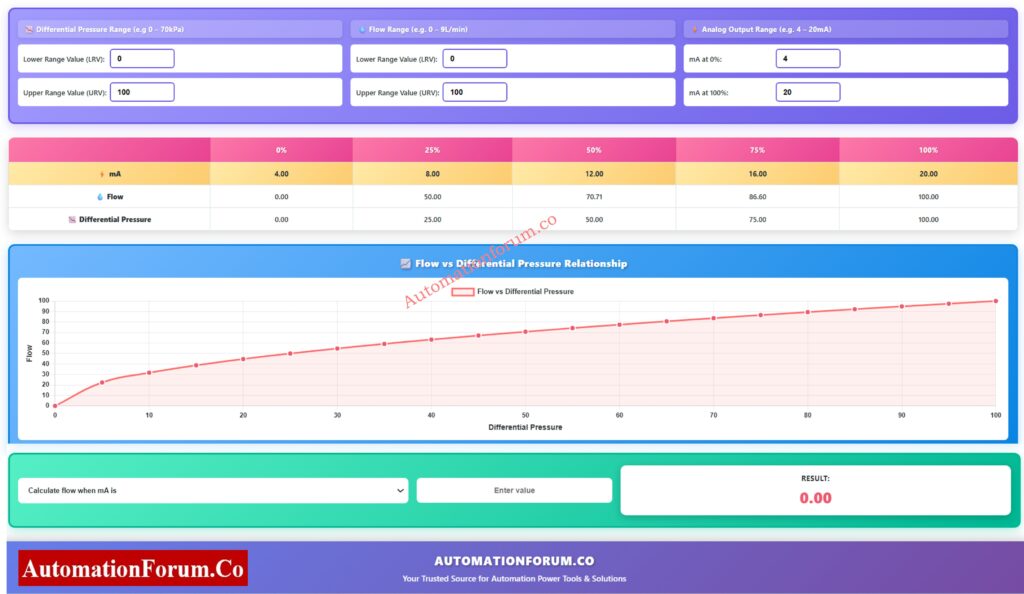
The following calculator assumes that the flow is in linear with the output mA signal and non-linear with differential pressure. The results are in the same units as is your data input in the following fields.
| 0% | 25% | 50% | 75% | 100% | |
|---|---|---|---|---|---|
| ⚡ mA | 4.00 | 8.00 | 12.00 | 16.00 | 20.00 |
| 💧 Flow | 0.00 | 50.00 | 70.71 | 86.60 | 100.00 |
| 📉 Differential Pressure | 0.00 | 25.00 | 50.00 | 75.00 | 100.00 |
📈 Flow vs Differential Pressure Relationship
AUTOMATIONFORUM.CO
Your Trusted Source for Automation Power Tools & Solutions
- Understanding Differential Pressure Flow Measurement
- How the AutomationForum.co DP Flow Calculator Helps
- Intelligent Visualization for Better Understanding
- Comprehensive Output and Conversion Modes
- Six Powerful DP Flow Conversion Options
- Engineering Applications Across Industries
- Why DP Flow Measurement Remains the Industry Standard
- Using the Calculator for Field Troubleshooting
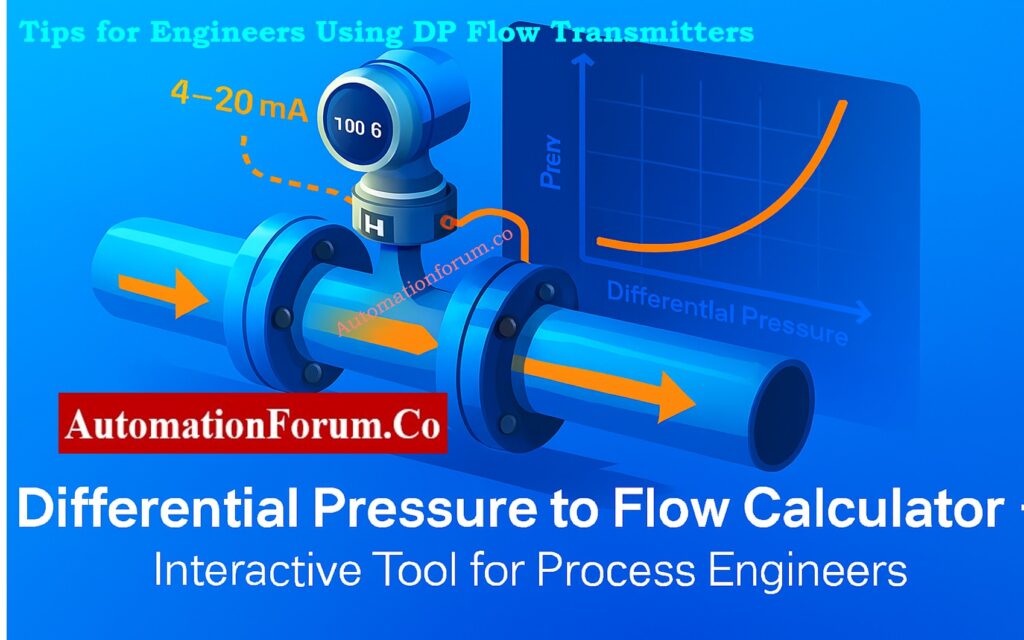
- Tips for Engineers Using DP Flow Transmitters
- Training and Educational Use
- Advantages of Using This Online DP Flow Calculator
- Example: DP Flow Calculation in Practice
- Integrating the Calculator into Instrumentation Workflow
- FAQs on Differential Pressure to Flow Calculator
- Test Your Knowledge of Fluid Dynamics- Orifice Plate Flow Measurement
A basic role in industrial automation is to measure and control flow. Differential Pressure (DP) flow measurement is one of the best technologies since it is simple, reliable, and can be used with almost any type of liquid, gas, or steam.
AutomationForum.co’s Differential Pressure to Flow Calculator is a cutting-edge interactive application that quickly changes DP values into real flow rates. It works with any unit, material, and range, thus it’s a universal tool for instrumentation engineers who are designing, commissioning, or fixing DP transmitters.
Step-by-Step Guide: Commissioning Procedure for Differential Pressure Transmitters in Pressurized Boiler Steam Drums
Understanding Differential Pressure Flow Measurement
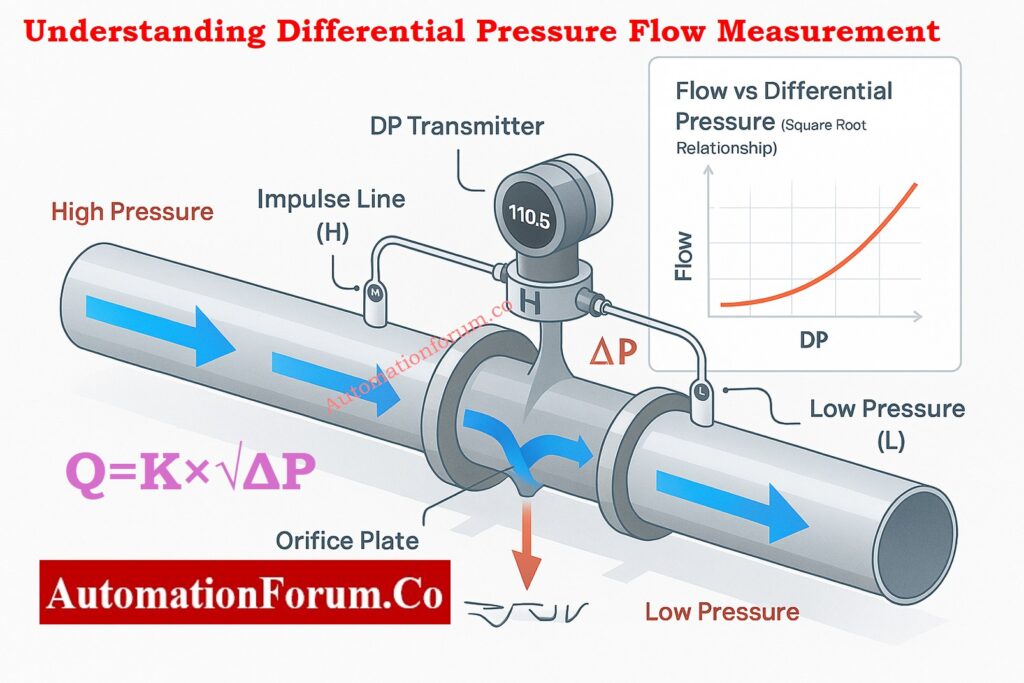
The Bernoulli Principle Behind DP Flow
Bernoulli’s principle says that as a fluid moves faster through a limitation, its static pressure goes down. This is the basis for differential pressure flow measurement. The square of the flow rate is directly connected to the difference in pressure across that limitation (the differential pressure).
The Square-Root Relationship Between Flow and Differential Pressure
Q=K×√ΔP
Where:
- Q = Flow rate (e.g., L/min, m³/h, SCFM)
- ΔP = Differential pressure (e.g., kPa, inH₂O, bar)
- K = Flow coefficient (depends on orifice size, geometry, density, etc.)
The flow rate goes up in a non-linear way as the differential pressure goes up because of this square root relationship. So, a transmitter needs to either have square-root extraction built in or depend on the control system (PLC or DCS) to do it digitally.
Complete Checklist: Differential Pressure Transmitter Commissioning Checklist for Flow Measurement Applications
How the AutomationForum.co DP Flow Calculator Helps
This online calculator uses animated graphics, numbers, and dynamic charts to show how DP-to-flow conversion works in real life. It’s not simply a tool for doing math; it’s also a way for every instrumentation professional to learn, check their work, and find problems.
Input Parameters and Unit Flexibility
You can set three primary groups of parameters:
- Differential Pressure Range (LRV-URV) is the range of pressures that the transmitter can send, such as 0–100 kPa or 0–400 inH₂O. Flow Range (LRV-URV) is the range of flow rates that the process can handle, such as 0–100 m³/h or 0–500 SCFM.
- The range of analog output is normally 4 to 20 mA, although it can be changed for unique circumstances.
You can use the calculator for steam, water, oil, air, or gas systems without changing the algorithm because it works with any engineering unit.
Smart Tool: Interface level calculator from Differential pressure (DP)
Intelligent Visualization for Better Understanding
Live DP Transmitter Animation and Real-Time Display
An animated pipeline system at the top of the calculator shows how flow creates a pressure difference over a limitation.
- You can see the high-pressure (H) and low-pressure (L) sides.
- The DP transmitter in the middle always shows changing differential pressure readings, as well as flow and mA signals that go along with them.
- The speed of the flow animation changes in real time with the DP %.
This visual feedback links what you learn in theory with how field equipment perform, which makes it great for training in the classroom or at internal workshops.
Dynamic Flow vs Differential Pressure Chart
The Chart that is all together.The JavaScript graph shows a real-time curve that shows how the square root of the difference between pressure and flow changes.
The curve clearly shows that flow grows quickly toward the upper range when DP is between 0 and 100%. This helps engineers understand how sensitive a control loop is and how accurate scaling is.
Calibration Steps: Step by Step Calibration Procedure for Differential Pressure Transmitter
Comprehensive Output and Conversion Modes
After you put in the right numbers, the calculator makes a table that shows the calculated results for important percentages (0%, 25%, 50%, 75%, 100%) for
- Differential Pressure (DP)
- Flow Rate
- Analog Signal (mA)
The quick table lets engineers check transmitter calibration, DCS scaling, or control valve characterization in seconds, so they don’t have to do square-root calculations by hand or use spreadsheet templates.
Advanced Insight: How Conditioning Orifice Plates Improve Flow Measurement in Tight Spaces ?
Six Powerful DP Flow Conversion Options
This tool can do six two-way conversions, which is different from most calculators that can only do one.
| Mode | Description |
| Flow from mA | Find the flow rate for any given transmitter output current |
| mA from Flow | Determine the 4 20 mA value for a given flow |
| Flow from DP | Convert differential pressure to flow rate |
| DP from Flow | Calculate expected DP for a given flow |
| mA from DP | Compute current output based on DP reading |
| DP from mA | Estimate DP from analog signal value |
This flexibility is very important for figuring out what’s wrong with loops or checking the output of a transmitter against process indications.
Design Rule Explained: Orifice Beta Ratio: Why It Falls Between 0.3 and 0.7 for Optimal Flow Measurement
Engineering Applications Across Industries
The way the calculator is made makes it useful for almost all process industries that need to quantify flow.
| Industry | Medium / Service | Primary Element | Typical DP Range |
| Power Plants | Boiler feedwater / steam | Orifice or Venturi tube | 0 – 250 kPa |
| Oil & Gas | Natural gas / condensate | Cone meter or Annubar | 0 – 500 mbar |
| Petrochemical | Hydrocarbon liquids | Orifice plate | 0 – 200 kPa |
| Water Treatment | Clean or raw water | Orifice / Flow nozzle | 0 – 100 kPa |
| HVAC & Utilities | Air and chilled water | Pitot tube / Orifice | 0 – 50 mmH₂O |
You can simulate any of these applications and compare the transmitter output to the projected flow performance by adjusting the units and ranges.
Must-Read: Why Drain and Vent Holes are Essential for Efficient Orifice Plate Operation?
Why DP Flow Measurement Remains the Industry Standard
DP flow transmitters are still one of the most extensively used technologies in 2025. Here’s why engineers still believe in them:
- Proven Accuracy: When properly calibrated and installed, DP systems can be accurate to within 1% of the span.
- Works for gas, liquid, or steam at high pressures and temperatures, making it very useful.
- Affordable: Less expensive to buy and keep up than Coriolis or ultrasonic meters.
- Standard 4-20 mA/HART output works well with PLCs, DCS, or SCADA systems.
- How easy it is to keep up: quick to create, quick to recalibrate, and needs very few spare parts.
The AutomationForum.co DP Flow Calculator makes this established technology even better by making the math easier and the visualization better. It’s great for both field engineers and students.
Field Tip: Why Restriction Orifice is Some Distance from Blowdown Valve?
Using the Calculator for Field Troubleshooting
Field technicians can use this tool to quickly find faults in DP-based flow loops:
- Step 1: Use a multimeter or the control panel to measure the transmitter’s mA output.
- Step 2: To find the predicted flow, type that mA number into the calculator.
- Step 3: Check against the DCS or field flow indication.
If the readings don’t match, there could be a problem with the impulse line being blocked, the square root extraction being wrong, or the transmitter calibration drifting.
So, the calculator acts as a digital diagnostic tool to check the functioning of the transmitter on site.
Tips for Engineers Using DP Flow Transmitters
- Keep the impulse lines balanced by making sure that both the high and low sides are the same length. This will help you avoid making mistakes while measuring.
- Don’t use air or condensate traps. Use the right seals and purge valves to get accurate differential pressure measurements.
- Do Zero Checks Often: Before putting pressure on either side, always equalize them.
- Scaling by the square root: Check to see if your DCS or transmitter does square-root extraction to avoid having to fix things twice.
- Simulate Flow Points: You may use this calculator to check loops easily by simulating mA outputs at 25%, 50%, and 75% flow.
This calculator and other digital verification tools make measurements far more reliable when they are properly maintained.
Inspection Ready: Orifice Plate Commissioning Checklist
Training and Educational Use
Engineering schools and instrumentation training centers can use this calculator in their labs to show:
- The mathematical link between flow and DP
- The notion of 4-20 mA linear and nonlinear scaling
- How changes in the range of the transmitter affect the output of the process
The animated DP transmitter part shows in a visual way what textbooks explain mathematically, making it a great interactive teaching tool.
Advantages of Using This Online DP Flow Calculator
Quickly change DP to Flow
A visual example of the square-root principle
Works for any kind of fluid or unit
Simple scaling of 4–20 mA
Great for design, calibration, and fixing problems
You can go to it from any device, including a desktop, tablet, or phone.
The calculator’s simple interface makes it a good alternative to complicated spreadsheets or hand-drawn tables, yet it can provide technical documentation with professional-level accuracy.
Free Tool: Restriction Orifice plate Sizing Excel Tool
Example: DP Flow Calculation in Practice
Let’s take a simple example:
- DP range = 0-100 kPa
- Flow range = 0-200 m³/h
- Output = 4-20 mA
If the transmitter output reads 12 mA, what is the actual flow?
- Convert mA to % of range:
(12−4)/(20−4)=0.5=50 - Flow = QLRV+(QURV−QLRV)×√0.5
→ 0+(200×0.7071)=141.4m3/h
The calculator does this calculation right away, updating both the chart and the animated pipeline to show engineers exactly what that 12 mA implies in terms of flow.
Engineering Resource: Orifice Plate Sizing and Pressure Drop Calculation – Free Excel Tool
Integrating the Calculator into Instrumentation Workflow
- Design Phase: Figure out the DP range you need for the goal flow and make sure your main element is the right size.
- Commissioning: Check that the transmitter scaling and DCS display are in line.
- Use for daily calibration checks and process improvement.
- Training: Show teams how DP, mA, and flow are related in a graphic way.
The program works well with any instrumentation procedure since it combines theoretical and pictorial output.
AutomationForum.co’s Differential Pressure to Flow Calculator is more than simply an online tool; it’s an engineering friend that turns theory into interactive understanding.
This calculator gives you both technical accuracy and visual clarity, whether you’re making a new measurement loop, fixing a transmitter, or teaching the basics of instrumentation.
It can work with any DP range, flow unit, or process medium, making it truly ubiquitous for instrumentation engineers in the oil and gas, power, chemical, or utility industries.
It changes the way professionals see differential pressure measurement by adding real-time animation, charting, and multi-mode calculation.
FAQs on Differential Pressure to Flow Calculator
Can this calculator handle both liquids and gases?
Yes. Differential pressure flow measurement works for both liquids and gases because the flow rate is always the same, no matter what the medium is.
Does it work for different units like psi or bar?
Yes. The flow–DP relationship does not depend on the unit. The answer will still be correct if you choose any consistent units, like kPa, bar, psi, or inH₂O.
What is the formula used in this calculator?
The calculator uses the square root relationship between flow and differential pressure:
Q=K×√ΔP
where Q is the flow rate, K is a constant, and ΔP is the differential pressure.
Can I use it for transmitter calibration?
Yes. It helps check the scaling of transmitters by giving expected DP, flow, or mA values for known situations that are perfect for calibration checks and loop validation.
What makes this calculator unique?
It mixes DP-flow theory with real-time, interactive visualization. You may use any units, process medium, or range with it, so engineers can use it to both learn and do math.
Test Your Knowledge of Fluid Dynamics- Orifice Plate Flow Measurement
Refer the below link to Test Your Knowledge of Fluid Dynamics Orifice Plate Flow Measurement