- Introduction to Instrument Power Supply Load Calculation
- Why Instrument Power Supply Load Calculator is Important
- How Power Supply Load Calculation Works
- Instrument Power Supply Calculator Inputs Explained
- Step-by-Step Guide to Using the Power Supply Load Calculator
- Power Supply Calculator Output Explanation
- Real-World Example of 24VDC Instrument Power Supply Sizing
- Best Practices for Control Panel Power Supply Design
- When to Use Instrument Power Supply Load Calculator
- Who Uses Instrument Power Supply Load Calculator
- Where to Use Instrument Power Supply Load Calculator
- Standards and Compliance for Power Supply Sizing
- Common Mistakes Engineers Make in Power Supply Sizing
- Frequently Asked Questions on Power Supply Sizing
- How to size a 24VDC power supply?
- What is safety factor in power supply sizing?
- How much current does a transmitter consume?
- How much load is in 1 kW?
- How to calculate power supply power?
- How to calculate load formula?
- What is 50% load factor?
- How to calculate load formula?
- How to calculate PLC power supply load?
- What happens if power supply is overloaded?
- Why is efficiency important in control panel power supply sizing?
- Can I use one supply for transmitters and solenoids?
- What is the best way to do loop powered device calculation?
- Conclusion: Choosing the Right 24VDC Power Supply for Reliable Operation
Introduction to Instrument Power Supply Load Calculation
The Instrument Power Supply Load Calculator is essential for accurate 24VDC power supply sizing in industrial automation systems. In plant environments, even a small error in instrument load calculation can create unstable loop voltage, nuisance trips, communication loss, or complete shutdown of a control panel. For instrumentation engineers, control engineers, EPC teams, and plant maintenance professionals, power supply sizing is not a routine task. It is a reliability decision that affects uptime, safety, and operating cost.
When a power supply is undersized, the failure may not appear immediately. A transmitter may reset during peak demand, a relay may chatter, a solenoid valve may fail to actuate, or a PLC rack may drop communication under load. These issues often begin as intermittent faults and later become production losses. That is why the Instrument Power Supply Load Calculator should be used at the design stage, before panel fabrication and before field commissioning.
This calculator helps engineers estimate total current, total power, adjusted operating load, and safe power supply rating with practical engineering margins. It supports reliable panel design power calculation, field instrument current consumption review, and industrial automation power calculation for both new projects and retrofit systems.
⚡ Instrument Power Supply Load Calculator
AutomationForum.co · Free Automation Engineering Calculator
⚙️ Global System Parameters
🔌 Connected Field Devices
| Device | V | mA | Qty |
|---|
PLC Panel FAT Checklist for Success: Factory Acceptance Test (FAT) of a PLC Panel: A Step-by-Step Basic Guide
Why Instrument Power Supply Load Calculator is Important

A control panel is only as reliable as its weakest power source. In practical engineering, a 24VDC bus rarely serves a single device. It usually feeds transmitters, PLC input modules, output cards, relays, loop powered devices, indicator lamps, and solenoids. Each device has a distinct current profile, and the total load is rarely equal to the sum shown on a nameplate.
A supply that is too small generates a number of problems. First, when the current goes up, the voltage drop goes up too, especially when there are a lot of cables and panels. Second, the supply may be in constant overload, which makes things hotter and shortens the life of the parts. Third, PLC and DCS systems become unstable when the supply can’t keep up with demand during startup or peak times. Fourth, efficiency losses increase when a power supply operates near its limit for long periods. These issues are especially critical in process plants, utility skids, machine panels, and distributed I O systems where uptime matters.
The instrument load calculation process helps prevent these failures by translating device currents into a realistic power demand. It also supports better control panel power supply sizing during detailed engineering, procurement, and testing.
Refer the below link for the PLC Power Supply Calculator – Complete Guide for Accurate PLC Power Sizing
How Power Supply Load Calculation Works
The core idea behind power supply sizing is simple, but the engineering detail matters.
Total Current Calculation
Total current is the sum of the current drawn by all connected devices under normal operating conditions. In an instrumentation panel, this may include multiple transmitters, a PLC rack, I O modules, relays, indicators, communication devices, and solenoids. The calculator combines these values to produce base load current.
IS Barrier Earth Fault Current Calculator: IS Barrier Earth Fault Current Calculator | Intrinsic Safety Loop Design Tool
Total Power Calculation
Total power is calculated by multiplying current by voltage. In a 24VDC system, even moderate current can create a significant power demand. A control panel design should always convert current based load into total watts so the engineer can compare it with the power supply rating and thermal limits.
Safety Factor in Power Supply Sizing
A safety factor is not waste. It is engineering margin. It protects the system against device tolerance variation, future additions, ambient temperature changes, and short term load spikes. For most power supply sizing for transmitters and PLC power supply calculation tasks, a realistic safety factor improves reliability without oversizing the panel unnecessarily.

Peak Current Handling
Some devices draw more current during startup than during steady state operation. Solenoid valves, relays, and communication modules can create short duration demand peaks. The peak multiplier accounts for this condition so the supply can handle dynamic loading.
Efficiency Losses in 24VDC Power Supply Sizing
No power supply is perfectly efficient. Some input energy is lost as heat. That heat must be considered in panel design power calculation because it affects temperature rise, ventilation needs, and long term reliability.
Why Redundant Power Supplies Prevent Failures: What is a redundant power supply?
Instrument Power Supply Calculator Inputs Explained
Safety Factor
The safety factor allows the engineer to add design margin to the total connected load. In industrial automation systems, this margin helps cover spare capacity, future expansion, and field variation. A common design practice is to choose a value that is high enough to protect the system but not so high that it creates unnecessary cost or footprint. For instrument power supply load calculator use, the safety factor is one of the most important engineering inputs.
Panel Door Earth Bonding for Safety: Panel Door Earth Bonding Procedure: Ensuring Safety and Reliability
Nominal Voltage
Nominal voltage is the design voltage of the DC system, often 24VDC in control panels. This value is used to convert current into power and to estimate whether the supply can maintain stable output under actual load conditions.
Efficiency
Efficiency represents how much of the input power becomes usable output power. A higher efficiency means lower heat generation and better energy performance. In practical control panel power supply sizing, this affects cabinet temperature and reduces derating stress.
Peak Multiplier
Peak multiplier allows the engineer to model short term load spikes. This is especially important when solenoids, relays, or multiple transmitters energize at the same time. In real installations, peak demand can be the difference between stable operation and a nuisance fault.
Check Instrument Loop mA Safely Today: How to Safely Check the mA Current of an Instrument Loop Using a Multimeter
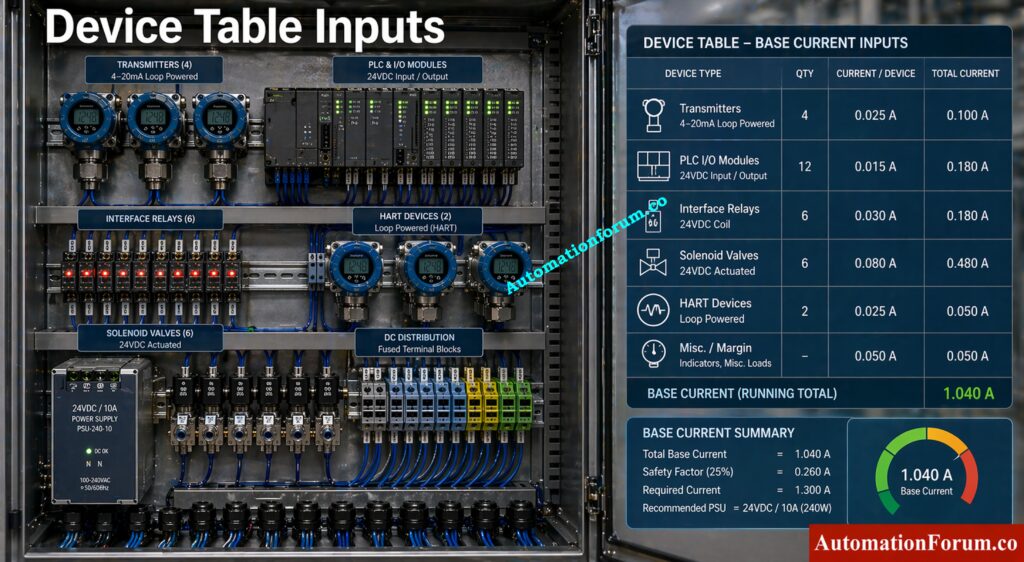
Device Table
The device table is where you enter individual load values.
- A transmitter typically has a low continuous current but may be critical because it supports process measurement and control.
- A PLC IO module may consume more current than expected when multiple channels are active.
- A relay draws coil current and may introduce switching peaks.
- A solenoid valve can have a relatively higher energizing demand and should always be counted carefully.
- A HART device may seem little on paper, but it nevertheless helps with loop-powered device calculations and the overall bus burden.
When you can, always utilize real datasheet figures instead of making assumptions when you want to know how much current field instruments require.
Fire Alarm Battery Calculator for Backup Sizing: Fire Alarm Battery Size Calculator – Professional Tool for Accurate Backup Power Sizing
Step-by-Step Guide to Using the Power Supply Load Calculator
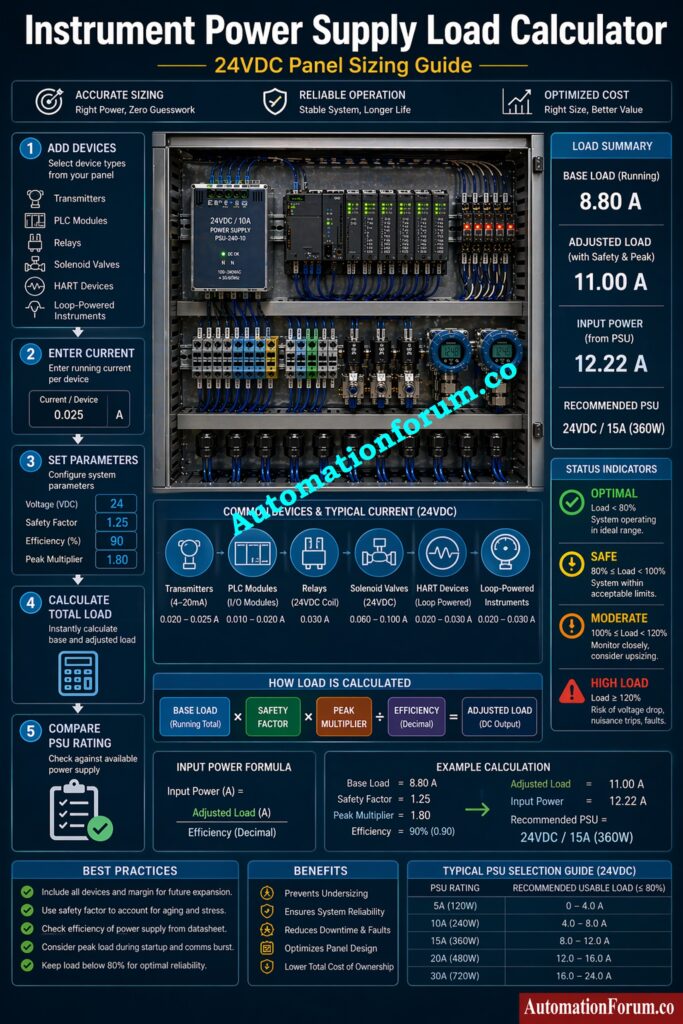
Step 1: Add All Connected Devices
First, add all the devices that will get power from the same DC supply. Include any other 24VDC loads, such as transmitters, PLC modules, relays, and solenoids.
Step 2: Enter Current Values for Each Device
Second, enter the current value for each device. Use the real operating current wherever possible. For engineering estimate work, use vendor data sheets or proven project standards.
Step 3: Set Voltage, Safety Factor, Efficiency and Peak Multiplier
Third, make that the nominal voltage, safety factor, efficiency, and peak multiplier are all configured to meet the design requirements for the panel.
Step 4: Calculate the Total Load
Fourth, click “Calculate” and go over the results. The tool will add up the base load, add an engineering margin, guess the ultimate power supply rating, and let you know if the chosen supply is safe.
Step 5: Compare the Result with PSU Rating
Fifth, if necessary, compare the result to the actual catalog rating and choose the next size that fits. In panel design, it is always better to choose a supply with proper margin than to run a unit at the edge of its limit.
This workflow is practical for panel design engineers, instrument engineers, and EPC reviewers who need fast and repeatable calculations.
Power Supply Calculator Output Explanation
Global Parameters
This section confirms the engineering assumptions used in the calculation. It usually includes nominal voltage, safety factor, efficiency, and peak multiplier. These values should be reviewed first because they define the whole sizing basis.
Wellhead Control Panel Explained for Operators: Wellhead Control Panel
Base Load
Base load is the sum of all connected device currents before any margin is added. It shows the actual demand of the system in normal conditions.
Adjusted Load
Adjusted load includes the selected safety factor and peak demand consideration. This is the value that better represents real operating stress on the supply.

PSU Rating
PSU rating is the recommended power supply size after margins and losses are applied. This is the number the engineer should compare against available products.
PLC Remote I O Card Failure Causes: Root Cause Analysis of PLC Remote I/O Panel (Point I/O Panel) Cards Failure Issues
Input Power
Input power reflects what the supply must draw from the source to deliver the required DC output. This is useful for heat management, feeder sizing, and cabinet thermal study.
Status Indicators
The status indicator may show categories such as Optimal, Safe, Moderate, or High Load.
Optimal usually means the supply is operating with comfortable spare capacity.
Safe indicates the design is acceptable and within normal limits.
Moderate means the margin is lower and the engineer should review expansion plans.
High Load means the power supply is close to its limit and should be upsized or the circuit load should be reduced.
Understanding these categories helps prevent control panel overload and improves long term reliability.
Refer the below link for the Instrument Power Consumption Calculation Guide – Complete Reference with Excel Download
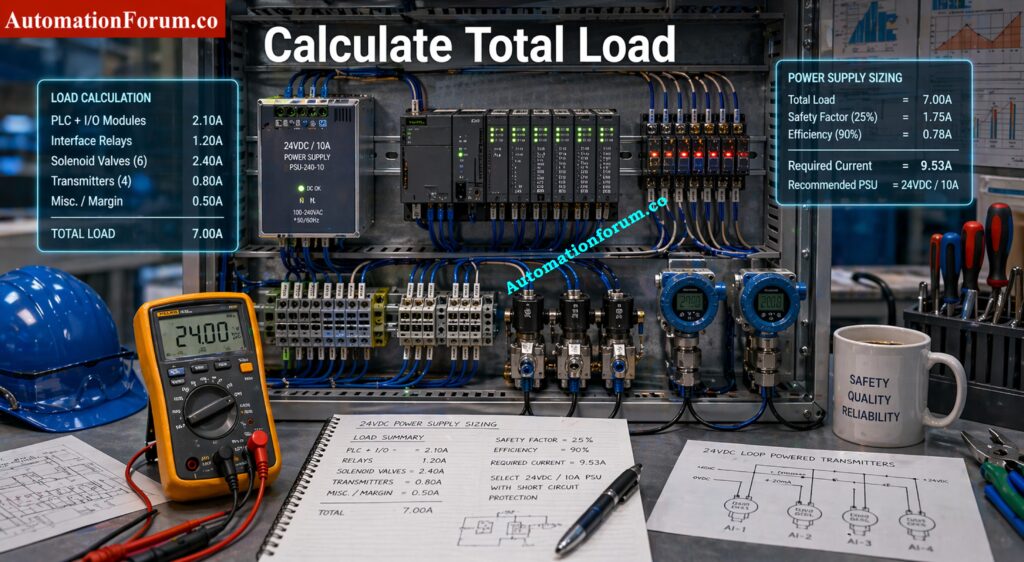
Real-World Example of 24VDC Instrument Power Supply Sizing
Consider a 24VDC instrumentation panel serving one process skid.
The panel includes 10 transmitters at 25 mA each, 5 solenoid valves at 250 mA each during energization, and 1 PLC rack with I O modules drawing 800 mA. The base current becomes 10 times 25 mA plus 5 times 250 mA plus 800 mA, which gives a practical total load for the calculator.
Now add a safety factor of 25 percent because the skid may later include more field devices. Use 85 percent efficiency because no supply is perfect, and apply a peak multiplier of 1.2 because multiple outputs may energize together.
The engineering decision here is not just to pick a supply that barely matches the current. The correct action is to choose a PSU size that keeps the system stable during startup, high ambient temperature, and future loop additions. In many plant projects, this means selecting the next higher standard rating instead of the absolute minimum.
This kind of industrial automation power calculation prevents nuisance faults, supports better commissioning, and reduces maintenance callouts.
Why Cable Shields Ground at One End: Why the Cable Shield is Grounded Only at the PLC or Control Panel Side
Best Practices for Control Panel Power Supply Design

- Always keep spare capacity in the power supply design. Control panels often grow after the first commissioning cycle.
- Consider temperature derating. A supply that works well at 25 degree Celsius may deliver less usable output inside a hot enclosure.
- Think on how to grow in the future. The first calculation should take into account spare I O, extra transmitters, and further retrofits.
- Use redundancy where uptime is critical. In some process units, dual supplies or redundant feed arrangements are worth the additional cost.
- Check panel ventilation. Heat is one of the most overlooked causes of poor power supply performance.
These practices are especially important in power supply sizing for transmitters, PLC panels, and field mounted automation skids.
PLC Control Panel Inspection Checklist Complete: Running Inspection Checklist of PLC Components in Control Panels
When to Use Instrument Power Supply Load Calculator
- During the early design phase of industrial automation projects to ensure the correct sizing of 24VDC power supplies
- Before making the control panel to check the instrument load calculation
- During thorough engineering to finish sizing the power supply for the control panel
- Before commissioning to avoid problems with overload and voltage drop
- When adding more field sensors or making PLC systems bigger
- When adding to or changing existing panels
- To make sure that industrial automation power computation is safe and accurate.
Instrumentation Panel Heat Load Calculator Guide: Instrumentation Panel Heat Load Calculator – Complete Engineering Guide for Panel Cooling Design
Who Uses Instrument Power Supply Load Calculator
- Instrumentation engineers for analyzing how much current field instruments use
- Control system engineers figure out how much electricity a PLC needs
- Electrical design professionals who figure out how much electricity a panel needs
- EPC engineers work on the design and validation stages of a project.
- Panel builders and system integrators for sizing the power supply for control panels
- Engineers who fix problems with power and other systems
- Plant technicians who fix problems and make changes in the field
- Consultants and project reviewers make sure that the design is correct and follows the rules.
Where to Use Instrument Power Supply Load Calculator
- In control panel design offices throughout the engineering phase
- In EPC engineering centers to check the design of a project
- In factories that use automated production systems
- In industries that use processes, such as chemical, oil and gas, and power plants
- In PLC panels and DCS marshalling cabinets
- In junction boxes in the field and remote IO panels
- In packaged units and skid-mounted automation systems
- During retrofit projects to check the capability of the current power supply
- Wherever you need to calculate the load of a loop-powered device or an instrument
Instrument Cable Voltage Drop Calculation Guide: How to do the voltage drop calculation of instrument cable?
Standards and Compliance for Power Supply Sizing
- When thinking about how PLC inputs work, the boundaries of electrical interfaces, and how reliable control systems are, IEC 61131 2 is important.
- UL 508 matters for industrial control panel equipment selection, marking, and safe application in North American style panels.
- NEC guidance is important for wiring, feeder protection, conductor sizing, and general installation safety.
These standards do not replace engineering judgment. They support it. For practical control panel power supply sizing, compliance should always be matched with real load calculation.
Bently Nevada GAP Voltage Explained Clearly: GAP voltage of Bently Nevada Vibration Probe
Common Mistakes Engineers Make in Power Supply Sizing
- One common mistake is ignoring peak current.
- Another is assuming efficiency is higher than the actual catalog value.
- A third mistake is failing to reserve spare capacity for future field devices.
- A fourth mistake is selecting a power supply only by output current and not by thermal behavior, cabinet arrangement, and duty cycle.
- Many panel problems begin because the engineer used a rough estimate instead of a true instrument load calculation.
Accurate LVDT Voltage Calculator Online: Linear Variable Differential Transformer (LVDT) Output Voltage Calculator
Frequently Asked Questions on Power Supply Sizing
How to size a 24VDC power supply?
Add all device currents, apply a safety factor, account for efficiency losses, and choose a PSU with enough headroom for peak demand and future expansion.
What is safety factor in power supply sizing?
Safety factor is the engineering margin added to the calculated load to improve reliability and reduce overload risk.
How much current does a transmitter consume?
A normal transmitter may use a minimal amount of current, but the exact amount depends on the type of device, the loop arrangement, and the manufacturer’s specifications.
How much load is in 1 kW?
One kilowatt (kW) is equal to 1000 watts of electrical load, which means that devices that use 1000 watts together make up a 1 kW load.
It shows how much power all the electrical devices that are linked to a circuit use.
How to calculate power supply power?
The formula for figuring out how much power a power supply has is: Power (W) = Voltage (V) x Current (A).
For AC systems, add the power factor: P = V × I × PF to get the right answer.
How to calculate load formula?
You may figure out the electrical load by using this formula: Load (W) = Voltage × Current × Power Factor.
The total load is the sum of all the loads from the devices that are connected to the system.
What is 50% load factor?
When the load factor is 50%, it signifies that the average load is half of the maximum load for a certain time.
It shows that the electrical system’s capacity is being used moderately.
How to calculate load formula?
Total load (kW) = Σ (V × I × PF) ÷ 1000 for all connected devices.
This converts total power consumption from watts into kilowatts for system sizing.
How to calculate PLC power supply load?
PLC Panel Installation Checklist You Need: Comprehensive PLC Panel Installation and Commissioning Checklist (Downloadable)
What happens if power supply is overloaded?
The supply may overheat, lose regulation, shut down, or cause connected instruments and PLCs to fail or reset.
Why is efficiency important in control panel power supply sizing?
Efficiency affects heat, energy loss, and usable output capacity inside the cabinet.
Can I use one supply for transmitters and solenoids?
Yes, but only if the total load, peak demand, and noise sensitivity are properly evaluated.
What is the best way to do loop powered device calculation?
Use actual loop current data, add all loops on the same supply, and include margin for future devices.
Reduce PLC Wiring Voltage Drop Fast: How to Calculate and Minimize Voltage Drop in PLC Wiring?
Conclusion: Choosing the Right 24VDC Power Supply for Reliable Operation
The Instrument Power Supply Load Calculator gives engineers a practical way to perform control panel power supply sizing with real industrial discipline. It supports 24VDC power supply sizing, PLC power supply calculation, panel design power calculation, and field instrument current consumption analysis in one place. Use it during design review, procurement, and commissioning to reduce risk and improve uptime. Bookmark this page, use the calculator for every new panel, and check our other PLC calculators and explore instrumentation design tools on AutomationForum.co.
Refer the below link for the Why 4-20 mA Current Signal is Preferred Over Voltage Signal in Instrumentation?