- Running Inspection Procedure for Analyzer and Sampling System
- What Is an Analyzer and Sampling System?
- Common Types of Online Process Analyzers
- Importance of Analyzer Sampling System Inspection
- Safety Precautions Before Analyzer Inspection
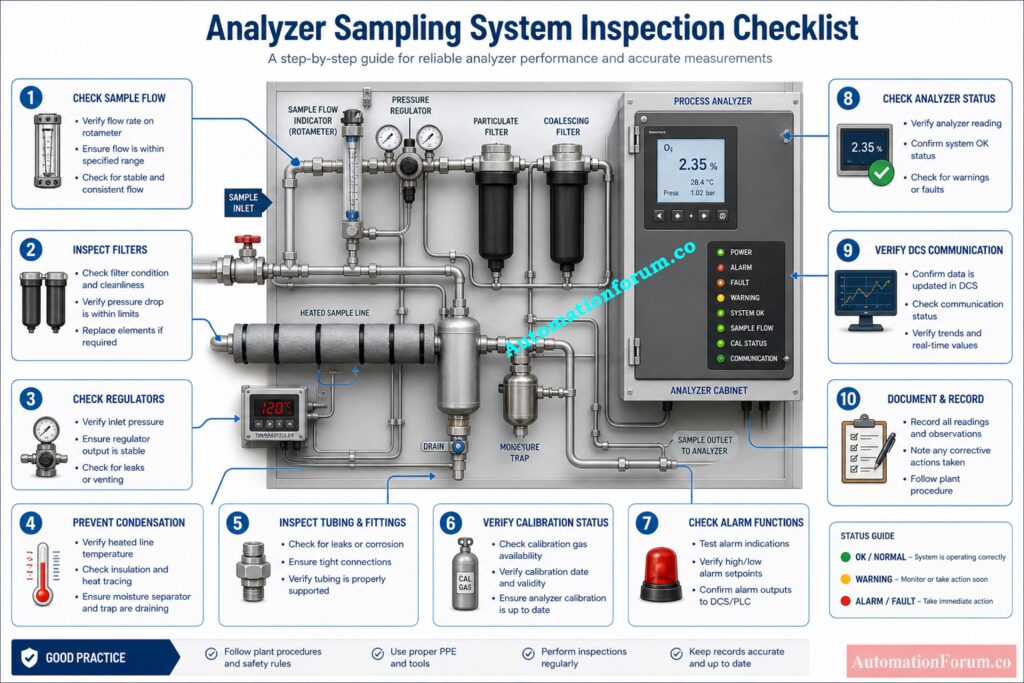
- Step by Step Analyzer Running Inspection Procedure
- Step 1 Verify Analyzer Power and Health Status
- Step 2: Check Sample Flow Rate
- Step 3: Inspect Filters and Regulators
- Step 4: Verify No Condensation or Moisture
- Step 5: Confirm Analyzer Reading Stabilization
- Step 6: Inspect Tubing and Connections
- Step 7: Verify Calibration Status
- Step 8: Check Alarm and Interlock Functions
- Common Sample Flow Problems in Analyzer Systems
- Troubleshooting Guide for Analyzer Sampling System Problems
- Failure Impact Analysis in Analyzer Systems
- Analyzer and Sampling System Inspection Checklist
- Best Practices for Reliable Analyzer Operation
- Advanced Diagnostics and Predictive Monitoring for Analyzer Systems
- Running Inspection Checklist for Analyzer and Sampling System in Process Industries Excel Sheet
- Conclusion: Key Takeaways for Analyzer Reliability
- Frequently Asked Questions on Running Inspection Procedure for Analyzer and Sampling System
Running Inspection Procedure for Analyzer and Sampling System
Why Running Inspection Is Important
In today’s process industries, online analyzer systems are quite important. Refineries, petrochemical plants, chemical industries, power plants, pharmaceutical facilities, and oil and gas installations all rely on analyzers to keep an eye on process conditions, product quality, environmental compliance, and safety at work.
What Problems Can Be Detected During Inspection
A process analyzer can only give accurate readings if both the analyzer and the sampling mechanism are working properly. Blocked filters, low sample flow, condensation inside tubing, pressure instability, leaking fittings, contaminated sample lines, and inappropriate temperature conditioning are all problems that might cause the analyzer to give false readings and data that aren’t stable. If the analyzer data is wrong, it could lead to bad decisions about process control, lost production, goods that don’t meet specifications, safety issues, and unplanned shutdowns.
How Running Inspection Improves Analyzer Reliability
Regular running inspections help find these faults before they get worse. Checking the sample flow, filters, regulators, heat tracing, moisture removal systems, tubing connections, analyzer alarms, and calibration status properly makes sure that process monitoring is accurate and that analyzers are more reliable.
The running inspection approach below is a useful guide for instrumentation engineers, analyzer technicians, maintenance workers, and commissioning engineers that work in industrial process plants.
What Is an Analyzer and Sampling System?
Definition of a Process Analyzer
A process analyzer is a tool that is used to measure the chemical composition or physical parameters of an industrial process stream continuously live. These analyzers give operators and control systems real-time data that helps keep the process stable and the quality of the product high.
Common Types of Online Process Analyzers
Common analyzers used in process industries include:
- Oxygen analyzers
- Gas chromatographs
- Moisture analyzers
- pH analyzers
- Conductivity analyzers
- Hydrogen sulfide analyzers
- Infrared analyzers
- Carbon monoxide analyzers
- Sulfur analyzers
- Dew point analyzers
Most analyzers can’t work with raw process conditions directly. Process fluids can have high pressure, high temperature, dust particles, liquid droplets, corrosive chemicals, or other things that can hurt analyzer parts or give wrong data.
Purpose of the Sampling and Sample Conditioning System
To get around these problems, a system for sampling and conditioning samples is put in place between the process line and the analyzer.
The sample handling system does a lot of critical things, such as:
- Sample extraction from the process line
- Safe sample transport to the analyzer
- Pressure reduction
- Filtration of contaminants
- Flow regulation
- Moisture removal
- Temperature conditioning
- Safe delivery of representative samples
The major goal of the sample handling system is to make sure that the analyzer gets a clean, representative, stable, and conditioned sample that is good for accurate measurement.
A well-designed sample system makes the analyzer more accurate, faster to respond, and more reliable in its operations.
Calculate Probe Resistance Before Your Readings Fail: Conductivity Liquid Analyzer Probe Resistance Calculator – Complete Guide for Instrumentation Engineers
Importance of Analyzer Sampling System Inspection
While the analyzer system is running under typical plant conditions, running inspection procedures are carried out.
The main goals of a routine running examination are:
- Prevent false analyzer readings
- Avoid unexpected analyzer downtime
- Detect sample system problems at an early stage
- Maintain stable sample flow
- Prevent moisture accumulation and condensation
- Improve analyzer response time
- Ensure stable process control
- Protect analyzer components from contamination
- Verify analyzer health and communication
- Ensure safe analyzer operation
Regular checks and preventative maintenance make analyzers much more reliable and plants much more efficient. Maintenance personnel can find problems before they impair process operations by constantly checking the conditions under which samples are handled.
Crush Your Liquid Analyzer Interview With These Questions: Top 25 Essential MCQ for Liquid Analyzer Instrument Technician Interview in Process Industries
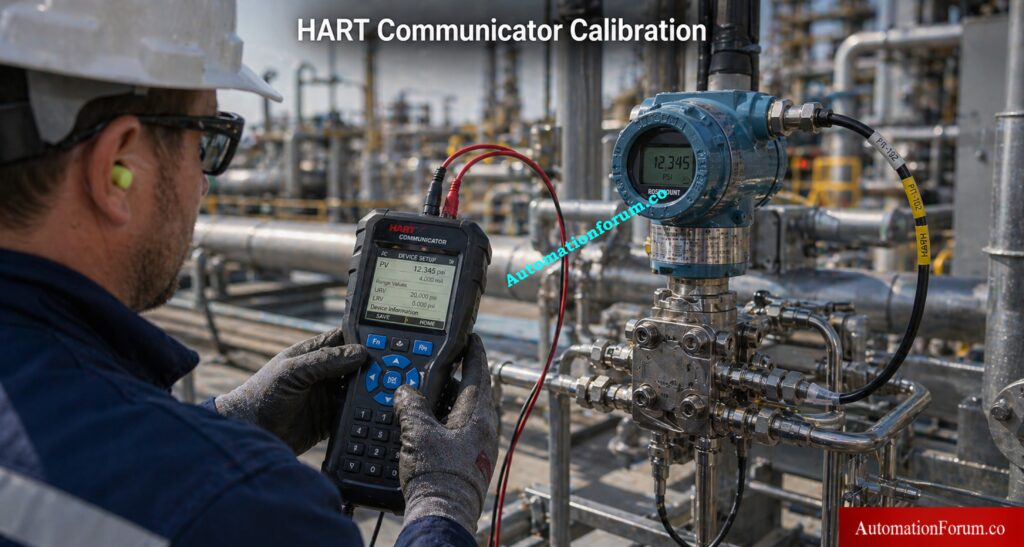
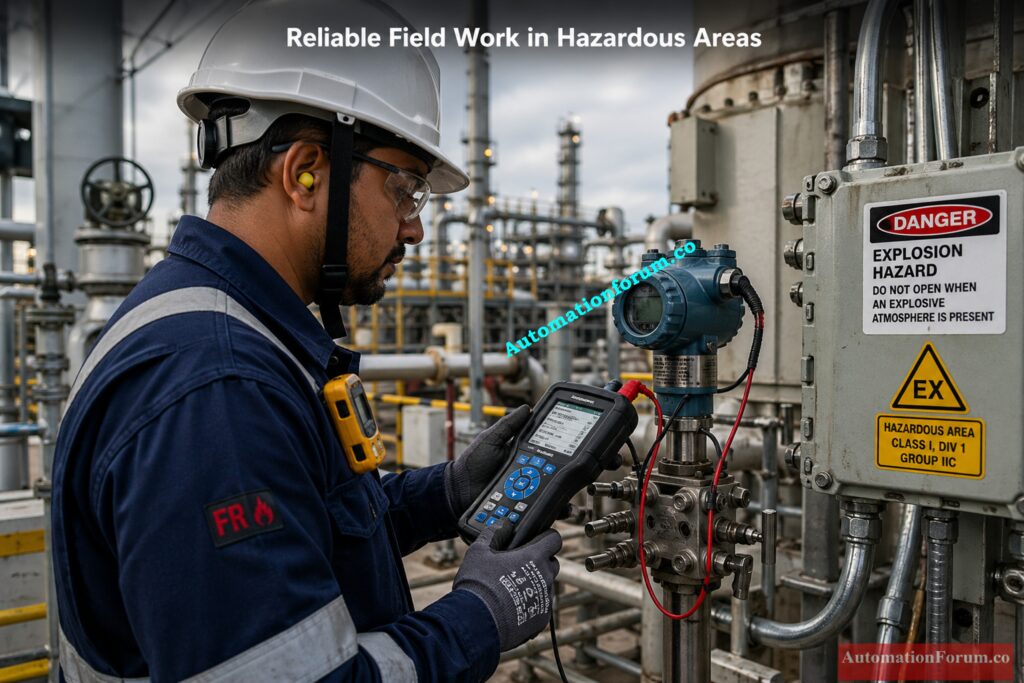
Safety Precautions Before Analyzer Inspection
It is very vital to remain safe when inspecting analyzers because they often deal with dangerous, flammable, corrosive, or toxic process gases.
Before starting the inspection, you must take the following steps:
- If plant rules say you need one, get a work permit.
- Put on the right PPE, like gloves, goggles, flame-resistant clothes, and a safety helmet.
- Check to see if the analyzer shelter’s ventilation system is working.
- If you need to do maintenance work, follow the lockout and tagout rules.
- Check the sample line pressure before you detach the tubing or filters.
- Use instruments that are safe by design in dangerous places.
- Stay away from direct contact with harmful process gasses.
- Make sure that the calibration gas cylinders are safely stored.
- Check that the exhaust and vent lines are working properly.
Analyzer shelters must always have good ventilation since gasses that leak from the operation can make the air dangerous or even explode.
Get Accurate Nernst mV Output in Minutes: Zirconia Oxygen Analyzer Nernst mV Output Online Calculator – Free Excel Tool
Step by Step Analyzer Running Inspection Procedure
Step 1 Verify Analyzer Power and Health Status
The first thing to do is examine the analyzer’s overall health.
Check the following things very carefully:
- Main power supply availability
- Analyzer display condition
- Status indications
- Diagnostic messages
- Alarm conditions
- Internal fault indications
- Communication with DCS or PLC
- Analyzer warm up condition
Make sure that the analyzer display is working properly and not showing any strange error messages.
Check to see if the analyzer and control system are able to talk to each other. If communication is lost, it could disrupt process monitoring and alert generating.
You should carefully look over diagnostic warnings because they often show early symptoms of problems with the analyzer, like detector faults, poor sample flow, low temperature, or calibration failure.
Dominate Gas Analyzer Interviews With These MCQs: Top 25 Essential MCQ for Gas Analyzer Instrument Technician Interview
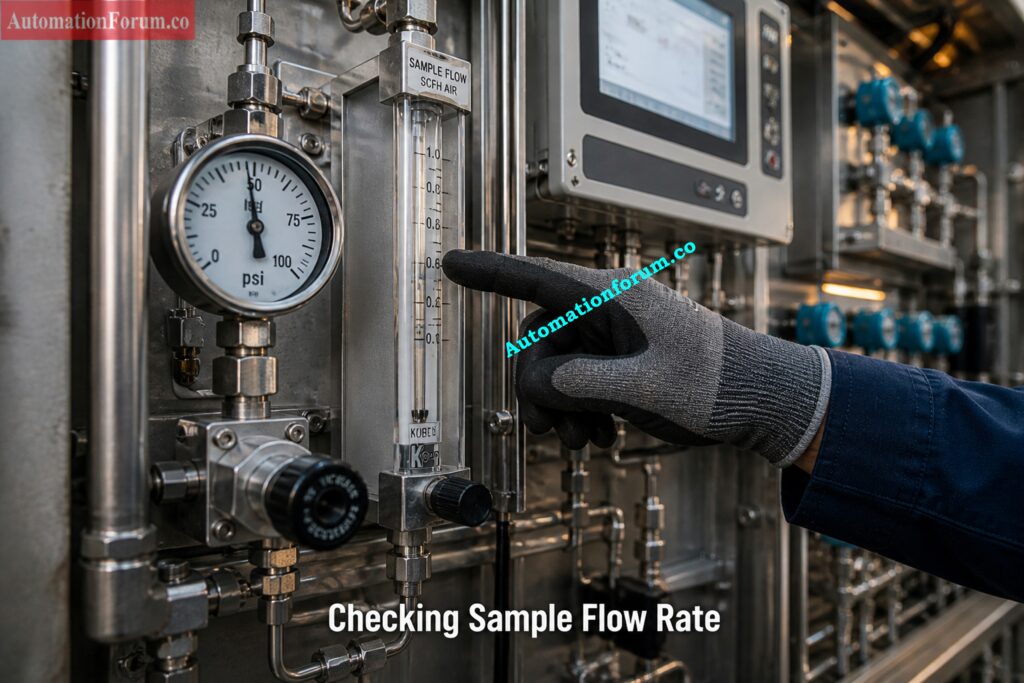
Step 2: Check Sample Flow Rate
One of the most critical components of checking an analyzer is checking the sample flow.
Check the rotameter or flow indicator to make sure that the sample flow is in the range that is recommended for operation.
During inspection:
- Verify proper sample flow indication
- Check for low flow condition
- Check for excessive flow
- Inspect bypass flow operation
- Look for pulsating flow
- Verify sample return or vent flow
- Check for blocked tubing or restrictions
If the sample flow is low, the analyzer may take longer to respond and give readings that are not steady.
Too much sample flow could overload the analyzer sensor and make the measurements less accurate.
Abnormal sample flow conditions are commonly caused by blocked tubing, unclean filters, frozen lines, or broken regulators.
In gas analyzer systems, flow instability is a common sign of difficulties with pressure regulation or filters that are only partially blocked.
Know Oxygen Analyzer Types Before Choosing Wrong: Types of Oxygen Analyzers: Applications and Measurement Methods
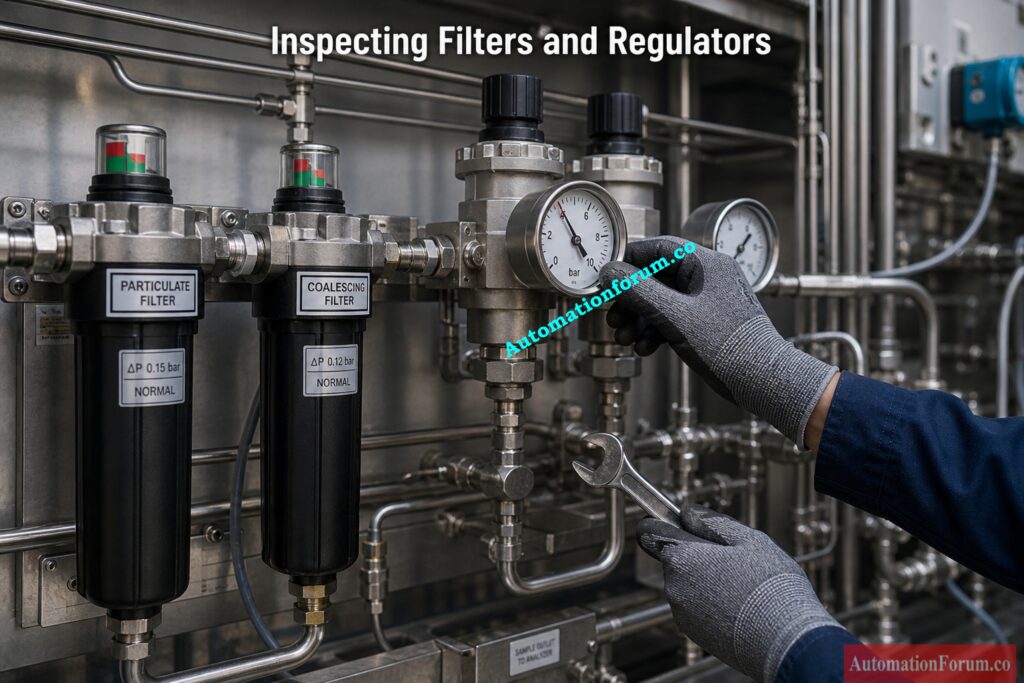
Step 3: Inspect Filters and Regulators
Filters and pressure regulators are two important parts of systems that condition samples.
Carefully look at the following parts:
- Particulate filters
- Coalescing filters
- Moisture separators
- Pressure regulators
- Differential pressure indicators
- Filter drain systems
Look for dirt, discolouration, moisture buildup, or a loss in pressure in the filters.
Dirty filters cause too much pressure loss and make the sample flow unsteady. This makes the analyzer respond slowly and gives wrong readings.
Check the stability of the regulator outlet pressure. When the pressure in the regulator changes, it can make the analyzer measurements unstable and cause problems with process control.
Whenever the differential pressure goes above the recommended levels, replace the filter components that are dirty.
Inspect Zirconia Oxygen Analyzers Before They Fail: Step by Step Preventive Maintenance Procedure for Zirconia Type Oxygen Analyzer with Checklist
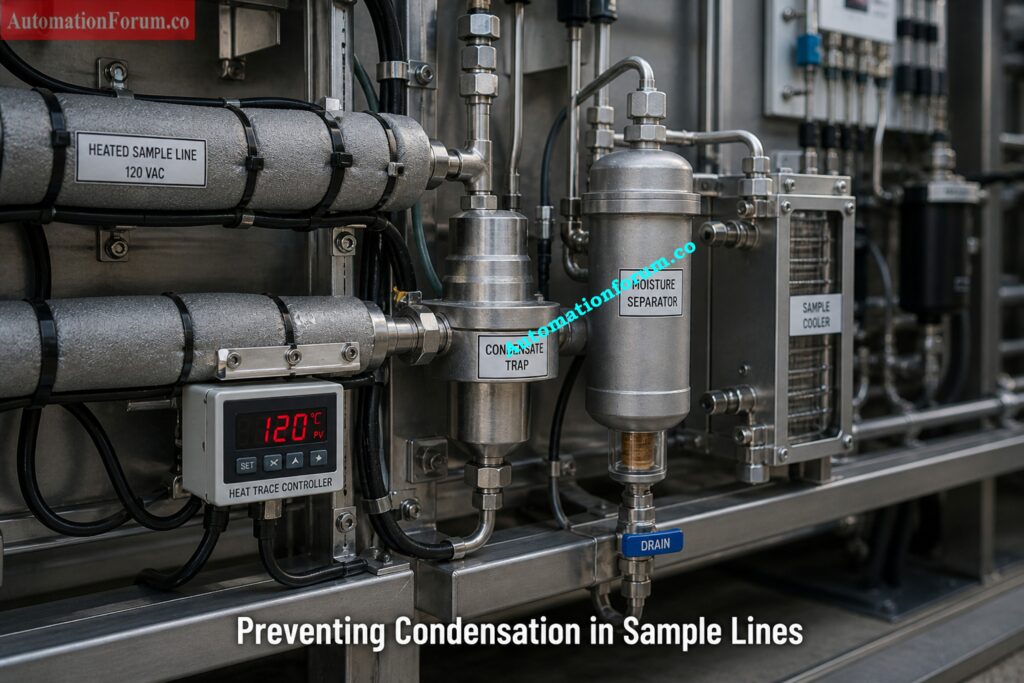
Step 4: Verify No Condensation or Moisture
One of the major concerns with analyzer sample systems is condensation.
Moisture inside tubing can dissolve process gases, damage sensors, rust parts, and make analyzers give wrong readings.
Inspect the following items:
- Condensate pots
- Moisture traps
- Heat traced sample lines
- Drain systems
- Sample coolers
- Heated enclosures
- Insulated tubing
Look for water that is clearly building up inside the tubing or filter bowls.
Check that heat tracing systems are working correctly because not enough heat can cause vapor to condense inside sample lines.
Check the drain systems to make sure that the condensate removal is working well.
Problems with condensation are very important for gas analyzers, like oxygen analyzers, moisture analyzers, and infrared analyzers.
Refer the below link to Unlock Zirconia Oxygen Analyzer Secrets for Industry: Exploring Zirconia Oxygen Analyzers in Industrial Applications
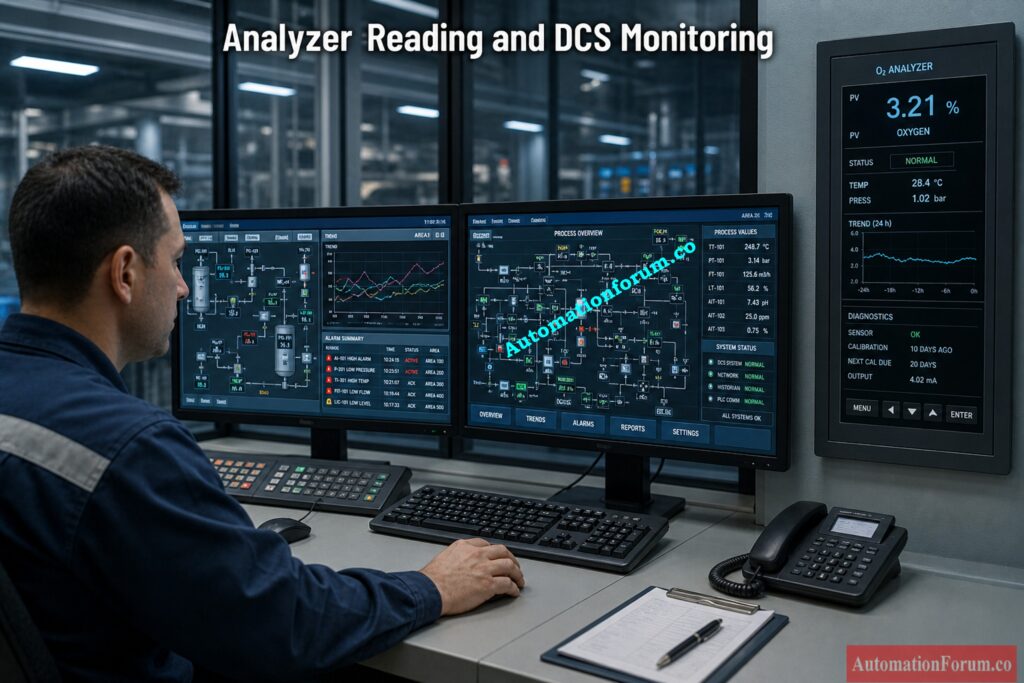
Step 5: Confirm Analyzer Reading Stabilization
Stable values from the analyzer show that the analyzer and sample system are working properly.
During inspection:
- Observe analyzer reading stability
- Check for abnormal fluctuations
- Compare readings with process conditions
- Verify DCS trending
- Compare against laboratory results if available
- Confirm analyzer warm up completion
Unstable readings may indicate:
- Flow instability
- Sample contamination
- Sensor degradation
- Condensation
- Pressure fluctuations
- Calibration drift
- Electronic faults
In the DCS, trending analysis is quite helpful for finding analyzer faults that are taking a long time to develop.
Understand ORP Analyzer Principles Before Problems Start: Understanding ORP Analyzer: Principles, Measurement, and Applications in Industry
Step 6: Inspect Tubing and Connections
To keep samples that are representative, the integrity of the sample tubing is very important.
Look at the following:
- Tube fittings
- Compression fittings
- Flexible hoses
- Valves
- Tubing supports
- Corrosion condition
- Mechanical damage
- Vibration impact
Use approved leak detection methods to look for leaks.
Sample leaks might let air into the analyzer system or let dangerous gases into the air.
Loose fittings also make it harder for the analyzer to get accurate readings and keep the sample pressure stable.
Make sure that the tubing is appropriately supported and protected from damage caused by vibration.
Prevent Conductivity Analyzer Failures With This Guide: Conductivity Transmitter / Analyzer Preventive Maintenance Guide & Checklist
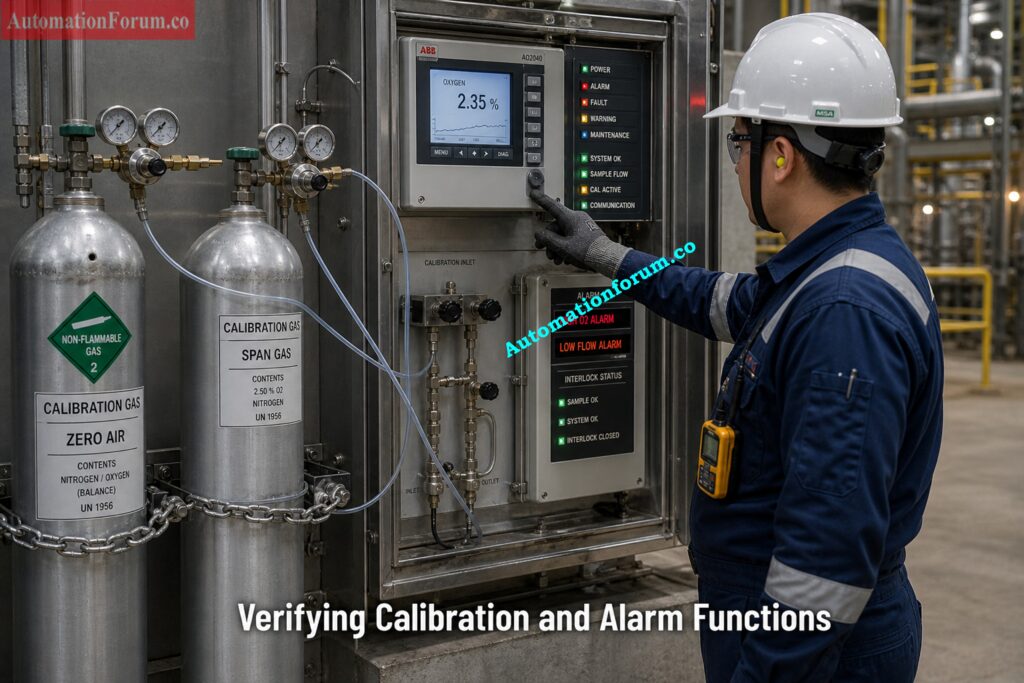
Step 7: Verify Calibration Status
Calibration verification is essential for maintaining analyzer accuracy.
Inspect the following:
- Calibration gas availability
- Calibration cylinder pressure
- Calibration due date
- Zero gas condition
- Span gas condition
- Analyzer drift
- Auto calibration sequence
Verify that calibration records are updated properly.
Excessive analyzer drift between calibrations may indicate sensor aging, contamination, or internal faults.
Calibration gases must be stored safely and within valid certification periods.
Calibrate Zirconia Oxygen Analyzers Like a Pro: 9 Step Zirconia Oxygen Analyzer Calibration Procedure
Step 8: Check Alarm and Interlock Functions
Analyzer alarms and interlocks play an important role in process safety.
Verify the following:
- High alarms
- Low alarms
- Analyzer fault alarms
- Sample flow alarms
- Shelter gas detection alarms
- Interlock actions
- Signal transmission to DCS or PLC
Confirm alarm annunciation and proper control system response.
Faulty analyzer alarms may prevent operators from detecting dangerous process conditions.
Choose the Right Oxygen Analyzer or Regret It: 6 Factors to Consider When Choosing an Oxygen Analyzer for your Application
Common Sample Flow Problems in Analyzer Systems
The following issues are commonly identified during routine analyzer inspections:
- Low sample flow
- Blocked filters
- Condensation in tubing
- Sample leakage
- Regulator instability
- Analyzer drift
- Rotameter malfunction
- Heat tracing failure
- Sensor contamination
- Unstable analyzer readings
- Delayed analyzer response
- Calibration gas leakage
- Moisture trap overflow
- Corroded tubing connections
Many analyzer problems originate from poor sample conditioning rather than the analyzer itself.
Fix Paramagnetic Oxygen Analyzer Problems Before Shutdowns: Troubleshooting of Oxygen Analyzer : Paramagnetic Type
Real Field Case Studies of Analyzer and Sampling System Failures
Case Study 1: Low Sample Flow Causing Delayed Analyzer Response
The hydrogen analyzer equipment in a refinery revealed a delayed response when the process changed. The investigation found that the sample flow rate had reduced because the coalescing filter was only partially blocked.
The sample travel time increased because of less flow, which made the analyzer take 3 to 5 minutes longer to respond. This caused the operator to take longer to act when the reactor was disturbed.
The analyzer response went back to normal once the filter was changed and the flow was fixed.
Technical knowledge
The amount of time it takes for a sample to lag depends on the flow speed and the size of the system. Less flow immediately increases lag time, which slows down process monitoring.
Case Study 2: Condensation Causing False Gas Analyzer Reading
An oxygen analyzer at a gas processing plant began to display readings that were unusually low. The inspection revealed moisture inside the sample line because the heat tracing didn’t work.
The condensed liquid took in some of the gas components, which made the concentration that actually reached the analyzer lower. Because of this, the oxygen measurements were wrong and too low.
Condensation is a big problem for sampling systems since it affects the makeup of the sample and makes the analysis wrong.
The analyzer values stabilized once the heat tracing was restored and the condensate was drained.
Case Study 3: Filter Clogging Leading to Analyzer Drift
In a continuous emission monitoring system, the values from the analyzer began to change slightly over time. It was determined that filter blockage was the main problem, which caused a drop in pressure and an unsteady sample flow.
In analyzer systems, these kinds of problems happen a lot because of filter clogging and moisture carryover, which cause signal drift and results that aren’t always accurate.
Changing the filter and regulating the pressure got rid of the drift.
Calibrate Paramagnetic Oxygen Analyzers With Zero Confusion: 10 Step Oxygen Analyzer Calibration Procedure: Paramagnetic Type
Troubleshooting Guide for Analyzer Sampling System Problems
| Problem | Possible Cause | Troubleshooting Action |
| Low sample flow | Blocked filter or tubing | Replace filter and inspect tubing |
| Unstable readings | Pressure fluctuation | Check regulator stability |
| Condensation in lines | Heat tracing failure | Inspect heater and insulation |
| Analyzer drift | Sensor aging | Recalibrate or replace sensor |
| Slow analyzer response | Excessive dead volume | Reduce tubing length |
| Rotameter no indication | Float sticking | Clean or replace rotameter |
| Moisture carryover | Faulty moisture separator | Drain and inspect separator |
| Frequent alarms | Faulty wiring or communication | Inspect signal connections |
| Sample leakage | Loose fittings | Tighten fittings and leak test |
| Excessive pressure drop | Dirty filter element | Replace filter cartridge |
Master Cell Constant Before Conductivity Errors Spread: Understanding Cell Constant in Conductivity Analyzers and its Significance
Failure Impact Analysis in Analyzer Systems
| Failure | Root Cause | Impact on Analyzer | Process Risk |
| Low sample flow | Blocked filter or restriction | Slow response time | Delayed control action |
| Condensation in sample line | Heat tracing failure | Wrong concentration reading | Safety and quality risk |
| Filter clogging | Contaminants in sample | Pressure drop and instability | Analyzer drift |
| Sample leakage | Loose fittings | Air ingress or sample loss | False readings |
| Regulator instability | Faulty regulator | Flow fluctuation | Unstable analyzer output |
| Dead volume in tubing | Poor design | Sample lag and mixing | Incorrect measurement |
| Moisture carryover | Faulty separator | Sensor contamination | Analyzer damage |
| Heat tracing failure | Power loss or heater fault | Condensation formation | Measurement error |
| Excessive pressure drop | Dirty filters | Reduced flow | Slow analyzer response |
Key engineering insight
Most analyzer failures originate from the sampling system rather than the analyzer itself, often due to poor design or maintenance
Explore Process Analyzers From Setup to Troubleshooting: Exploring Process Analyzers: Principles, Installation, Calibration & Troubleshooting
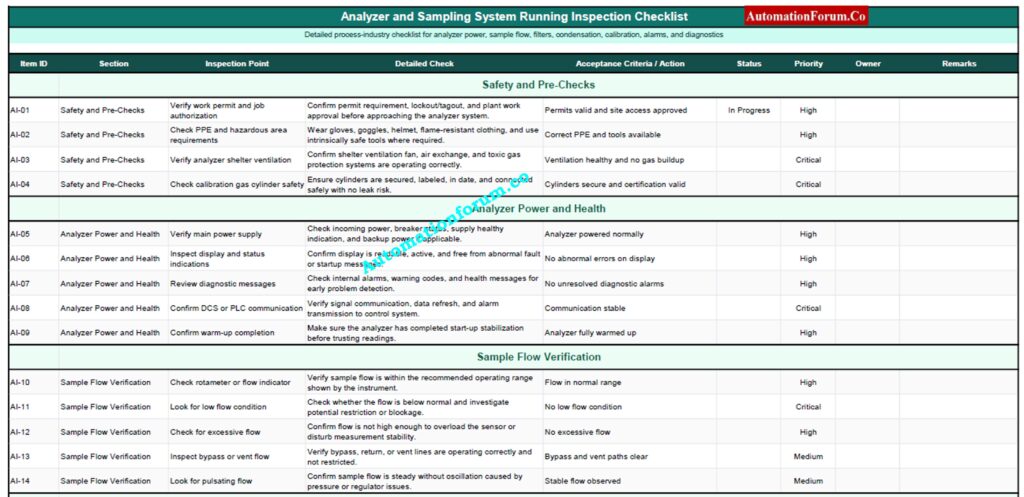
Analyzer and Sampling System Inspection Checklist
| Inspection Item | Check Description | Status | Remarks |
| Analyzer power supply | Verify power healthy | OK / Not OK | |
| Analyzer display | Check display and diagnostics | OK / Not OK | |
| Sample flow | Verify normal rotameter reading | OK / Not OK | |
| Filters | Check cleanliness and pressure drop | OK / Not OK | |
| Pressure regulator | Verify stable outlet pressure | OK / Not OK | |
| Condensation | Confirm no moisture accumulation | OK / Not OK | |
| Heat tracing | Verify heater operation | OK / Not OK | |
| Moisture trap | Inspect drain condition | OK / Not OK | |
| Tubing condition | Inspect corrosion and damage | OK / Not OK | |
| Leak inspection | Verify leak free fittings | OK / Not OK | |
| Analyzer readings | Confirm stable measurement | OK / Not OK | |
| Calibration status | Verify calibration validity | OK / Not OK | |
| Alarm condition | Check alarm functionality | OK / Not OK | |
| Communication | Verify DCS communication | OK / Not OK | |
| Shelter ventilation | Confirm proper ventilation | OK / Not OK | |
| Exhaust system | Verify vent line operation | OK / Not OK |
Common parts of industrial inspections are checking the flow of rotameters, the temperature of heat traced tubing, the amount of condensate, analyzer readings, purge systems, and calibration checks.
Pick the Right pH Analyzer Every Time: Selection Guide for pH Analyzers in Process Applications
Best Practices for Reliable Analyzer Operation
The following suggested practices can help make analyzers more reliable and cut down on maintenance issues:
- Perform routine preventive maintenance
- Maintain proper sample flow continuously
- Replace filters regularly
- Perform periodic calibration
- Maintain heat tracing systems properly
- Minimize dead legs in sample tubing
- Use representative sample extraction points
- Keep analyzer shelters clean
- Maintain stable sample pressure
- Inspect tubing supports regularly
- Verify analyzer diagnostics frequently
- Maintain accurate maintenance records
A well-designed sample system and regular checks make analyzers work better and cut down on false findings.
Know How Paramagnetic Oxygen Analyzers Really Work: Oxygen Analyzer Working Principle: Paramagnetic Type
Advanced Diagnostics and Predictive Monitoring for Analyzer Systems
Modern process facilities are using more and more advanced diagnostics and predictive monitoring methods to make analyzers more reliable and cut down on unscheduled downtime.
DCS Trend Analysis for Analyzer Health
In the Distributed Control System, you should always keep an eye on the analyzer readings. Trending can help you find problems with delayed responses, steady drift, or unexpected spikes.
For example:
- Gradual drift indicates sensor aging or contamination
- Sudden spikes indicate flow or pressure instability
- Flat signals indicate sample blockage
Differential Pressure Monitoring Across Filters
Installing differential pressure indicators on filters can help you find clogs before they impair the functioning of the analyzer.
An increase in pressure drop means that contamination is building up, which can slow down the flow of samples and make measurements less stable.
Low Flow Alarm Strategy
You can use low flow switches or transmitters to set off warnings when the flow of samples decreases below a certain level.
This stops the analyzer from working when the sample circumstances are not right.
Internal Analyzer Diagnostics
Modern analyzers provide internal diagnostics such as:
- Sensor health monitoring
- Calibration deviation tracking
- Internal temperature monitoring
- Flow alarms
These diagnostics help identify issues early before failure occurs.
Laboratory Comparison for Accuracy Validation
Periodic comparison of online analyzer readings with laboratory results helps validate analyzer accuracy.
Large deviations indicate:
- Calibration problems
- Sample system issues
- Analyzer malfunction
Predictive Maintenance for Sample Systems
Using historical data and trends, maintenance teams can predict failures such as:
- Filter clogging
- Sensor degradation
- Moisture breakthrough
This reduces downtime and improves system reliability.
Stop Guessing: Master Oxygen Analyzer Basics Fast: Oxygen Analyzer Basics in Process Industries – Advanced Quiz for Instrumentation Engineers
Running Inspection Checklist for Analyzer and Sampling System in Process Industries Excel Sheet
Download this Excel based analyzer inspection checklist to verify sample flow, filters, regulators, tubing, calibration, alarms, and system health, ensuring accurate measurements, reduced downtime, and reliable process operation.
Conclusion: Key Takeaways for Analyzer Reliability
Analyzer and sampling systems are very important parts of keeping an eye on and controlling industrial processes. For accurate analyzer measurements, the analyzer itself and the sample handling system must both be in good shape.
Regular running checks can find problems including low sample flow, dirty filters, pressure instability, moisture buildup, leaking tubing, calibration drift, and unstable analyzer findings before they pose big difficulties with operations.
Regularly checking sample flow systems, filters, regulators, condensation control systems, heat tracing, alarms, calibration systems, and analyzer diagnostics makes analyzers much more reliable, safe, and efficient.
A properly cared for analyzer and sample conditioning system makes sure that process measurements are correct, reduces downtime, stops erroneous readings, and helps the plant run smoothly in tough industrial settings.
Maintain Paramagnetic O2 Analyzers Without Missing Steps: Step by Step Preventive Maintenance Procedure for O2 Analyzers : Paramagnetic Type
Frequently Asked Questions on Running Inspection Procedure for Analyzer and Sampling System
What is analyzer sampling system inspection?
The analyzer sampling system check makes sure that the sample sent is clean, representative, and stable so that measurements are correct and process control is trustworthy.
Why is sample flow important in analyzers?
For the analyzer to get fresh and representative samples, the sample flow must be correct. If the flow is too low or obstructed, the response time and values may be wrong.
What causes condensation in analyzer tubing?
When the temperature drops or the heat tracing isn’t good, condensation happens. This can change the composition of the sample and give the analyzer wrong readings.
How often should analyzer inspection be done?
Analyzer check should be done often while the system is running to find problems early and make sure that measurements and system performance are always accurate.
What are common analyzer sampling system problems?
Low sample flow, clogged filters, condensation, leaks, and unstable pressure are all common factors that can make analyzers less accurate and reliable.
Refer the below link for the Understand Gas Analyzer Sampling Systems Before Failure
 Calculator 1")

![Signal-to-Noise Ratio (SNR) Calculator for Instrumentation and Control Systems
<!DOCTYPE html>
<html lang="en">
<head>
<meta charset="UTF-8" />
<meta name="viewport" content="width=device-width, initial-scale=1.0" />
<title>Signal-to-Noise Ratio (SNR) Calculator | AutomationForum.co</title>
<meta name="description" content="Free Signal-to-Noise Ratio (SNR) calculator with signal and noise units, impedance input, and live engineering results." />
<meta name="keywords" content="SNR calculator, signal to noise ratio calculator, automation engineering calculator, signal unit, noise unit" />
<meta name="robots" content="index, follow" />
<meta name="theme-color" content="#ffffff" />
<style>
:root{
--bg:#f6f9ff;
--card:#ffffff;
--text:#132238;
--muted:#5c6b7d;
--line:#d9e3f2;
--blue:#2f63e0;
--blue-dark:#2047a8;
--orange:#f59e0b;
--green:#16a34a;
--purple:#7c3aed;
--shadow:0 10px 28px rgba(31, 55, 108, .10);
--radius:12px;
}
*{box-sizing:border-box}
body{
margin:0;
background:var(--bg);
color:var(--text);
font-family:Arial, Helvetica, sans-serif;
}
.wrap{
width:min(1100px, calc(100% - 30px));
margin:18px auto 34px;
}
.topline{
display:flex;
align-items:center;
gap:10px;
margin-bottom:4px;
}
.brand{
color:#2b55c8;
font-size:14px;
font-weight:700;
letter-spacing:.01em;
margin:0 0 8px;
}
.title{
display:flex;
align-items:center;
gap:10px;
margin:0;
font-size:31px;
line-height:1.15;
color:#1f3f92;
font-weight:800;
letter-spacing:-0.02em;
}
.title-icon{
width:26px;
height:26px;
flex:0 0 auto;
display:inline-block;
}
.rule{
height:2px;
background:#2248b5;
margin:10px 0 8px;
}
.intro{
margin:0;
color:#2f3a4a;
font-size:15px;
line-height:1.65;
}
.card{
background:var(--card);
border:1px solid var(--line);
border-radius:var(--radius);
box-shadow:var(--shadow);
padding:14px 14px 15px;
margin-top:18px;
}
.section-title{
margin:0 0 10px;
color:var(--blue);
font-size:22px;
line-height:1.2;
font-weight:800;
padding-bottom:10px;
border-bottom:1px dashed #d8e0ef;
}
.grid{
display:grid;
grid-template-columns:1fr 1fr;
gap:16px;
}
.field label{
display:flex;
align-items:center;
gap:8px;
font-size:14px;
font-weight:700;
color:#1f2b3a;
margin-bottom:8px;
}
.info{
width:15px;
height:15px;
border-radius:50%;
background:#2248b5;
color:#fff;
display:inline-flex;
align-items:center;
justify-content:center;
font-size:11px;
font-weight:700;
cursor:help;
position:relative;
flex:0 0 auto;
}
.info:hover::after{
content:attr(data-tip);
position:absolute;
left:50%;
transform:translateX(-50%);
bottom:130%;
width:max-content;
max-width:300px;
background:#1f2b3a;
color:#fff;
padding:8px 10px;
border-radius:8px;
font-size:12px;
line-height:1.45;
box-shadow:0 8px 18px rgba(0,0,0,.2);
z-index:10;
white-space:normal;
}
input, select{
width:100%;
border:1px solid var(--line);
border-radius:6px;
background:#fff;
color:var(--text);
font-size:15px;
padding:12px 12px;
outline:none;
transition:.2s ease;
}
input:focus, select:focus{
border-color:#6d8df0;
box-shadow:0 0 0 3px rgba(47,99,224,.10);
}
.help{
margin-top:6px;
color:var(--muted);
font-size:12px;
line-height:1.45;
}
.span-2{grid-column:1 / -1}
.btn-row{
display:grid;
grid-template-columns:1fr 1fr;
gap:8px;
margin-top:16px;
}
button{
border:none;
border-radius:6px;
padding:14px 14px;
font-size:15px;
font-weight:800;
cursor:pointer;
transition:.2s ease;
color:#fff;
display:flex;
align-items:center;
justify-content:center;
gap:8px;
}
.btn-calc{
background:linear-gradient(180deg, var(--blue-dark), var(--blue));
}
.btn-calc:hover{filter:brightness(1.03)}
.btn-reset{
background:linear-gradient(180deg, #f3a00b, var(--orange));
}
.btn-reset:hover{filter:brightness(1.03)}
.results{
margin-top:18px;
padding-top:12px;
}
.results-head{
display:flex;
align-items:center;
gap:10px;
margin-bottom:12px;
}
.results-title{
margin:0;
color:#2b55c8;
font-size:22px;
font-weight:800;
line-height:1.2;
}
.results-icon{
width:22px;
height:22px;
flex:0 0 auto;
}
.results-grid{
display:grid;
grid-template-columns:repeat(4, 1fr);
gap:10px;
}
.result-box{
border:1px solid var(--line);
border-radius:10px;
padding:14px 12px 12px;
background:#fbfdff;
min-height:154px;
display:flex;
flex-direction:column;
align-items:center;
justify-content:center;
text-align:center;
}
.result-label{
font-size:14px;
font-weight:800;
margin-bottom:10px;
color:#1f2b3a;
}
.result-icon{
width:34px;
height:34px;
margin-bottom:8px;
}
.result-value{
font-size:34px;
line-height:1.05;
font-weight:900;
color:#1547c6;
word-break:break-word;
}
.result-sub{
margin-top:6px;
font-size:14px;
color:#374151;
font-weight:700;
}
.result-sub.green{color:var(--green)}
.result-sub.purple{color:var(--purple)}
.result-sub.blue{color:#1547c6}
.message{
margin-top:12px;
border:1px solid var(--line);
background:#f7faff;
border-radius:10px;
padding:12px 14px;
font-size:14px;
line-height:1.55;
color:#243345;
display:flex;
align-items:flex-start;
gap:10px;
}
.message .ok{
width:22px;
height:22px;
flex:0 0 auto;
margin-top:1px;
}
.meta-row{
margin-top:14px;
border:1px solid var(--line);
border-radius:10px;
overflow:hidden;
display:grid;
grid-template-columns:1fr 1fr 1fr;
background:#fff;
}
.meta-item{
padding:12px 14px;
text-align:center;
border-right:1px solid var(--line);
}
.meta-item:last-child{border-right:none}
.meta-top{
display:flex;
align-items:center;
justify-content:center;
gap:8px;
font-size:13px;
color:#334155;
margin-bottom:6px;
font-weight:700;
}
.meta-val{
font-size:15px;
color:#1547c6;
font-weight:900;
}
.footer-note{
margin-top:12px;
border:1px solid var(--line);
border-radius:10px;
padding:12px 14px;
background:#f8fbff;
font-size:14px;
line-height:1.6;
color:#24405f;
}
.formula-note{
margin-top:10px;
font-size:13px;
color:var(--muted);
}
@media (max-width: 900px){
.results-grid{grid-template-columns:repeat(2, 1fr)}
.meta-row{grid-template-columns:1fr}
.meta-item{border-right:none;border-bottom:1px solid var(--line)}
.meta-item:last-child{border-bottom:none}
}
@media (max-width: 720px){
.grid,
.btn-row{
grid-template-columns:1fr;
}
.title{
font-size:24px;
align-items:flex-start;
}
.section-title,
.results-title{
font-size:20px;
}
.result-box{
min-height:140px;
}
.result-value{
font-size:30px;
}
.wrap{
width:min(100% - 16px, 1100px);
}
.card{
padding:12px;
}
}
</style>
</head>
<body>
<div class="wrap">
<div class="header">
<div class="brand">AutomationForum.co · Free Automation Engineering Calculator</div>
<h1 class="title">
<svg class="title-icon" viewBox="0 0 24 24" fill="none" aria-hidden="true">
<rect x="2" y="13" width="3" height="9" rx="1.2" fill="#2f63e0"/>
<rect x="7" y="9" width="3" height="13" rx="1.2" fill="#2f63e0"/>
<rect x="12" y="5" width="3" height="17" rx="1.2" fill="#2f63e0"/>
<rect x="17" y="1" width="3" height="21" rx="1.2" fill="#2f63e0"/>
</svg>
Signal-to-Noise Ratio (SNR) Calculator
</h1>
<div class="rule"></div>
<p class="intro">
This calculator helps instrument engineers assess the integrity of a signal in the presence of noise.
It provides Signal-to-Noise Ratio (SNR) calculations based on input parameters, offering insights into signal quality
and compliance with common industry standards for reliable measurement and control systems.
</p>
</div>
<div class="card">
<div class="section-title">Signal Parameters</div>
<div class="grid">
<div class="field">
<label for="signalValue">
Signal Value
<span class="info" data-tip="Enter the signal amplitude or power value depending on the selected unit family.">i</span>
</label>
<input type="number" id="signalValue" value="1.0" step="any" />
</div>
<div class="field">
<label for="signalUnit">Signal Unit</label>
<select id="signalUnit">
<option value="V" selected>Volts (V)</option>
<option value="mV">Millivolts (mV)</option>
<option value="uV">Microvolts (µV)</option>
<option value="W">Watts (W)</option>
<option value="mW">Milliwatts (mW)</option>
<option value="uW">Microwatts (µW)</option>
</select>
</div>
</div>
</div>
<div class="card">
<div class="section-title">Noise Parameters</div>
<div class="grid">
<div class="field">
<label for="noiseValue">
Noise Value
<span class="info" data-tip="Noise must be greater than zero. Use the same unit family as the signal for correct ratio calculation.">i</span>
</label>
<input type="number" id="noiseValue" value="0.001" step="any" />
</div>
<div class="field">
<label for="noiseUnit">Noise Unit</label>
<select id="noiseUnit">
<option value="V" selected>Volts (V)</option>
<option value="mV">Millivolts (mV)</option>
<option value="uV">Microvolts (µV)</option>
<option value="W">Watts (W)</option>
<option value="mW">Milliwatts (mW)</option>
<option value="uW">Microwatts (µW)</option>
</select>
</div>
</div>
</div>
<div class="card">
<div class="section-title">Circuit Impedance</div>
<div class="grid">
<div class="field span-2">
<label for="impedance">
Impedance (R)
<span class="info" data-tip="Reference impedance used for documentation. It is not required for ratio math when signal and noise are in the same unit family.">i</span>
</label>
<input type="number" id="impedance" value="50.2" step="any" />
<div class="help">Useful for field documentation and circuit context.</div>
</div>
</div>
</div>
<div class="btn-row">
<button class="btn-calc" type="button" id="calcBtn">
<span>🧮</span>
<span>Calculate SNR</span>
</button>
<button class="btn-reset" type="button" id="resetBtn">
<span>🔄</span>
<span>Reset Form</span>
</button>
</div>
<div class="card results">
<div class="results-head">
<svg class="results-icon" viewBox="0 0 24 24" fill="none" aria-hidden="true">
<rect x="2" y="13" width="3" height="9" rx="1.2" fill="#2f63e0"/>
<rect x="7" y="9" width="3" height="13" rx="1.2" fill="#2f63e0"/>
<rect x="12" y="5" width="3" height="17" rx="1.2" fill="#2f63e0"/>
<rect x="17" y="1" width="3" height="21" rx="1.2" fill="#2f63e0"/>
</svg>
<h2 class="results-title">Results</h2>
</div>
<div class="results-grid">
<div class="result-box">
<div class="result-label">SNR (dB)</div>
<svg class="result-icon" viewBox="0 0 48 48" fill="none" aria-hidden="true">
<path d="M7 28h7l5-14 7 24 5-10h10" stroke="#2f63e0" stroke-width="3" stroke-linecap="round" stroke-linejoin="round"/>
</svg>
<div class="result-value" id="snrDb">0.00</div>
<div class="result-sub blue">dB</div>
</div>
<div class="result-box">
<div class="result-label">Linear Ratio</div>
<svg class="result-icon" viewBox="0 0 48 48" fill="none" aria-hidden="true">
<rect x="9" y="26" width="5" height="13" rx="1.5" stroke="#16a34a" stroke-width="3"/>
<rect x="20" y="18" width="5" height="21" rx="1.5" stroke="#16a34a" stroke-width="3"/>
<rect x="31" y="10" width="5" height="29" rx="1.5" stroke="#16a34a" stroke-width="3"/>
</svg>
<div class="result-value" id="linearRatio" style="color:#16a34a;">0.00</div>
<div class="result-sub green">:1</div>
</div>
<div class="result-box">
<div class="result-label">Quality</div>
<svg class="result-icon" viewBox="0 0 48 48" fill="none" aria-hidden="true">
<circle cx="24" cy="17" r="8" stroke="#7c3aed" stroke-width="3"/>
<path d="M19 30l5 4 5-4v10l-5-3-5 3V30z" stroke="#7c3aed" stroke-width="3" stroke-linejoin="round"/>
<path d="M24 12l1.8 3.7 4.2.6-3 2.9.7 4.1-3.7-2-3.7 2 .7-4.1-3-2.9 4.2-.6L24 12z" fill="#7c3aed"/>
</svg>
<div class="result-value" id="quality" style="color:#7c3aed;">Not calculated</div>
<div class="result-sub purple" id="qualitySub">Enter values</div>
</div>
<div class="result-box">
<div class="result-label">Method</div>
<svg class="result-icon" viewBox="0 0 48 48" fill="none" aria-hidden="true">
<circle cx="24" cy="24" r="18" stroke="#2f63e0" stroke-width="3"/>
<path d="M8 24h8l3-8 5 16 4-8h12" stroke="#2f63e0" stroke-width="3" stroke-linecap="round" stroke-linejoin="round"/>
</svg>
<div class="result-value" id="method" style="color:#1547c6;">Voltage</div>
<div class="result-sub blue" id="methodSub">20 log₁₀(S / N)</div>
</div>
</div>
<div class="message" id="message">
<svg class="ok" viewBox="0 0 24 24" fill="none" aria-hidden="true">
<circle cx="12" cy="12" r="10" fill="#16a34a"/>
<path d="M7.5 12.5l3 3 6-7" stroke="#fff" stroke-width="2.2" stroke-linecap="round" stroke-linejoin="round"/>
</svg>
<div>Enter signal and noise values, then click Calculate SNR.</div>
</div>
<div class="meta-row">
<div class="meta-item">
<div class="meta-top">Ω Impedance (R)</div>
<div class="meta-val" id="impedanceOut">50.2 Ω</div>
</div>
<div class="meta-item">
<div class="meta-top">ⓘ Signal Unit</div>
<div class="meta-val" id="signalUnitOut">Volts (V)</div>
</div>
<div class="meta-item">
<div class="meta-top">ⓘ Noise Unit</div>
<div class="meta-val" id="noiseUnitOut">Volts (V)</div>
</div>
</div>
<div class="footer-note">
<strong>Voltage formula:</strong> SNR (dB) = 20 × log₁₀(Signal / Noise)
|
<strong>Power formula:</strong> SNR (dB) = 10 × log₁₀(Signal / Noise)
</div>
<div class="formula-note">
Voltage units: V, mV, µV. Power units: W, mW, µW.
</div>
</div>
</div>
<script>
const signalValue = document.getElementById('signalValue');
const signalUnit = document.getElementById('signalUnit');
const noiseValue = document.getElementById('noiseValue');
const noiseUnit = document.getElementById('noiseUnit');
const impedance = document.getElementById('impedance');
const snrDb = document.getElementById('snrDb');
const linearRatio = document.getElementById('linearRatio');
const quality = document.getElementById('quality');
const qualitySub = document.getElementById('qualitySub');
const method = document.getElementById('method');
const methodSub = document.getElementById('methodSub');
const message = document.getElementById('message');
const impedanceOut = document.getElementById('impedanceOut');
const signalUnitOut = document.getElementById('signalUnitOut');
const noiseUnitOut = document.getElementById('noiseUnitOut');
const calcBtn = document.getElementById('calcBtn');
const resetBtn = document.getElementById('resetBtn');
function unitFactor(unit) {
return {
V: 1,
mV: 1e-3,
uV: 1e-6,
W: 1,
mW: 1e-3,
uW: 1e-6
}[unit] || 1;
}
function isVoltageUnit(unit) {
return ['V', 'mV', 'uV'].includes(unit);
}
function isPowerUnit(unit) {
return ['W', 'mW', 'uW'].includes(unit);
}
function unitLabel(unit) {
const labels = {
V: 'Volts (V)',
mV: 'Millivolts (mV)',
uV: 'Microvolts (µV)',
W: 'Watts (W)',
mW: 'Milliwatts (mW)',
uW: 'Microwatts (µW)'
};
return labels[unit] || unit;
}
function qualityLabel(db) {
if (db < 10) return 'Poor';
if (db < 20) return 'Acceptable';
if (db < 30) return 'Good';
return 'Excellent';
}
function qualityMessage(db) {
if (db < 10) return 'The signal quality is poor. Noise dominates the measurement.';
if (db < 20) return 'The signal quality is acceptable, but noise may still affect performance.';
if (db < 30) return 'The signal quality is good and suitable for most applications.';
return 'The signal quality is excellent. The signal is very strong compared to the noise.';
}
function methodLabel(unit) {
return isVoltageUnit(unit) ? 'Voltage' : 'Power';
}
function methodFormula(unit) {
return isVoltageUnit(unit) ? '20 log₁₀(S / N)' : '10 log₁₀(S / N)';
}
function calcSNR() {
const sRaw = parseFloat(signalValue.value);
const nRaw = parseFloat(noiseValue.value);
const rRaw = parseFloat(impedance.value);
signalUnitOut.textContent = unitLabel(signalUnit.value);
noiseUnitOut.textContent = unitLabel(noiseUnit.value);
impedanceOut.textContent = isFinite(rRaw) ? `${rRaw.toFixed(1)} Ω` : '—';
if (!isFinite(sRaw) || !isFinite(nRaw)) {
return;
}
if (sRaw <= 0) {
message.innerHTML = '<svg class="ok" viewBox="0 0 24 24" fill="none" aria-hidden="true"><circle cx="12" cy="12" r="10" fill="#dc2626"/><path d="M8 8l8 8M16 8l-8 8" stroke="#fff" stroke-width="2.2" stroke-linecap="round"/></svg><div>Signal value must be greater than zero.</div>';
return;
}
if (nRaw <= 0) {
message.innerHTML = '<svg class="ok" viewBox="0 0 24 24" fill="none" aria-hidden="true"><circle cx="12" cy="12" r="10" fill="#dc2626"/><path d="M8 8l8 8M16 8l-8 8" stroke="#fff" stroke-width="2.2" stroke-linecap="round"/></svg><div>Noise value must be greater than zero.</div>';
return;
}
const sUnit = signalUnit.value;
const nUnit = noiseUnit.value;
const sameFamily =
(isVoltageUnit(sUnit) && isVoltageUnit(nUnit)) ||
(isPowerUnit(sUnit) && isPowerUnit(nUnit));
if (!sameFamily) {
message.innerHTML = '<svg class="ok" viewBox="0 0 24 24" fill="none" aria-hidden="true"><circle cx="12" cy="12" r="10" fill="#dc2626"/><path d="M8 8l8 8M16 8l-8 8" stroke="#fff" stroke-width="2.2" stroke-linecap="round"/></svg><div>Signal and noise units must belong to the same family: voltage with voltage, or power with power.</div>';
return;
}
const sBase = sRaw * unitFactor(sUnit);
const nBase = nRaw * unitFactor(nUnit);
if (nBase <= 0) {
message.innerHTML = '<svg class="ok" viewBox="0 0 24 24" fill="none" aria-hidden="true"><circle cx="12" cy="12" r="10" fill="#dc2626"/><path d="M8 8l8 8M16 8l-8 8" stroke="#fff" stroke-width="2.2" stroke-linecap="round"/></svg><div>Noise value must be greater than zero.</div>';
return;
}
const ratio = sBase / nBase;
const db = isVoltageUnit(sUnit)
? 20 * Math.log10(ratio)
: 10 * Math.log10(ratio);
snrDb.textContent = db.toFixed(2);
linearRatio.textContent = ratio.toFixed(2);
quality.textContent = qualityLabel(db);
qualitySub.textContent = db >= 30 ? 'Above 30 dB' : db >= 20 ? '20 to 30 dB' : db >= 10 ? '10 to 20 dB' : 'Below 10 dB';
method.textContent = methodLabel(sUnit);
methodSub.textContent = methodFormula(sUnit);
message.innerHTML = `
<svg class="ok" viewBox="0 0 24 24" fill="none" aria-hidden="true">
<circle cx="12" cy="12" r="10" fill="#16a34a"/>
<path d="M7.5 12.5l3 3 6-7" stroke="#fff" stroke-width="2.2" stroke-linecap="round" stroke-linejoin="round"/>
</svg>
<div>${qualityMessage(db)}</div>
`;
}
function resetForm() {
signalValue.value = '1.0';
signalUnit.value = 'V';
noiseValue.value = '0.001';
noiseUnit.value = 'V';
impedance.value = '50.2';
snrDb.textContent = '0.00';
linearRatio.textContent = '0.00';
quality.textContent = 'Not calculated';
qualitySub.textContent = 'Enter values';
method.textContent = 'Voltage';
methodSub.textContent = '20 log₁₀(S / N)';
signalUnitOut.textContent = 'Volts (V)';
noiseUnitOut.textContent = 'Volts (V)';
impedanceOut.textContent = '50.2 Ω';
message.innerHTML = `
<svg class="ok" viewBox="0 0 24 24" fill="none" aria-hidden="true">
<circle cx="12" cy="12" r="10" fill="#16a34a"/>
<path d="M7.5 12.5l3 3 6-7" stroke="#fff" stroke-width="2.2" stroke-linecap="round" stroke-linejoin="round"/>
</svg>
<div>Enter signal and noise values, then click Calculate SNR.</div>
`;
calcSNR();
}
calcBtn.addEventListener('click', calcSNR);
[signalValue, signalUnit, noiseValue, noiseUnit, impedance].forEach(el => {
el.addEventListener('input', calcSNR);
el.addEventListener('change', calcSNR);
});
resetBtn.addEventListener('click', resetForm);
calcSNR();
</script>
</body>
</html>
Introduction to Signal-to-Noise Ratio in Instrumentation
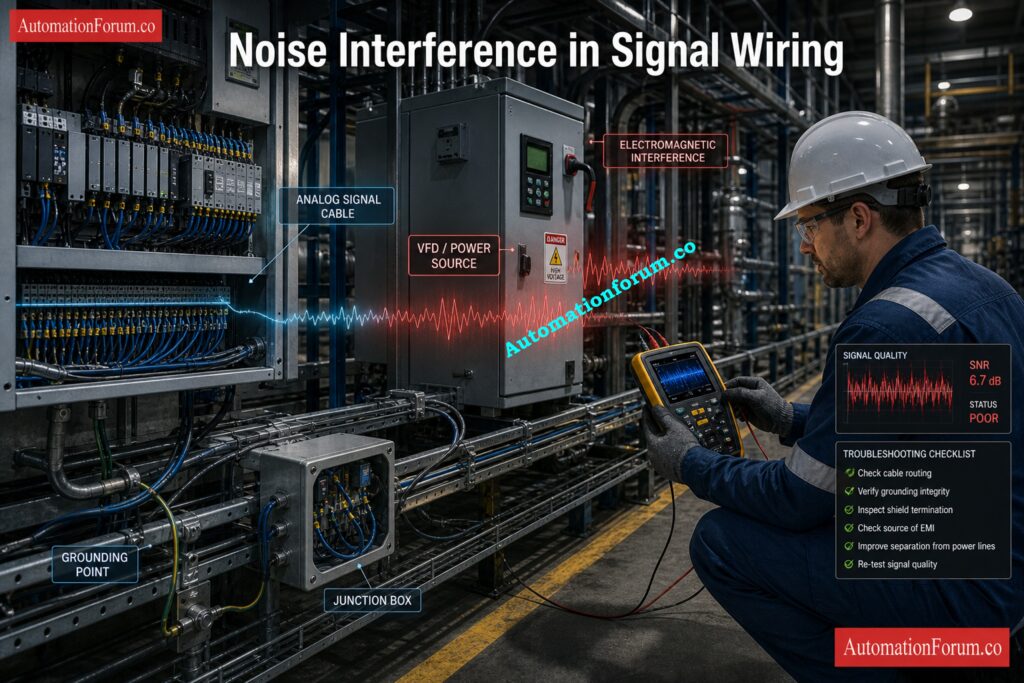
Signal-to-noise ratio, or SNR, is a practical way to measure how clean a signal is when compared with unwanted noise. In instrumentation and control systems, this matters because real plant signals rarely arrive in perfect condition. Transmitters, sensors, PLC inputs, and wireless devices can all pick up interference from nearby equipment, poor grounding, cable routing, vibration, or switching noise. When SNR is poor, the result is unstable readings, lower measurement confidence, false alarms, and poor control loop behavior. When SNR is strong, the signal is easier for the control system to interpret and the measurement becomes more dependable.
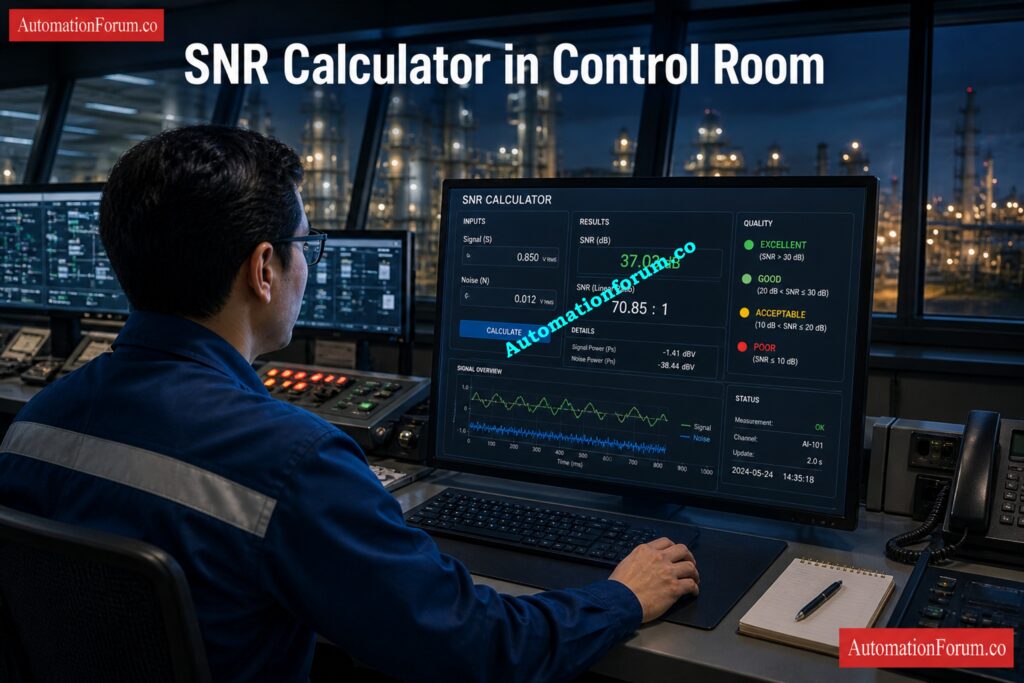
This calculator is designed for real industrial use, helping engineers quickly evaluate signal quality using either voltage-based or power-based inputs, while also showing the linear ratio, quality level, and calculation method.
What Is Signal-to-Noise Ratio (SNR)?
Signal vs Noise in Industrial Systems
SNR is the ratio of the useful signal to the noise that isn't useful. In basic engineering terms, it tells you how much stronger the real measurement is than the noise around it. Electrical noise can affect the output of a pressure transmitter, the signal from a thermocouple, the reading from a vibration probe, or an analog feedback signal.
Simulate 4-20 mA Signals Like a Pro: How to simulate 4-20ma signal with Loop Calibrator ?
Why Higher SNR Means Better Signal Clarity
If the signal is much stronger than the noise, the reading is clear and steady. The measurement can drift, jump, or lose reliability if the noise gets too loud. if the noise gets too loud.If the signal is much stronger than the noise, the reading is clear and steady. The measurement can drift, jump, or lose reliability if the noise gets too loud.
Crack Hard AO Faults with Advanced Checks: Troubleshooting Analog Output Signals in PLC Loops – Advanced Scenario-Based Quiz for Process Industries
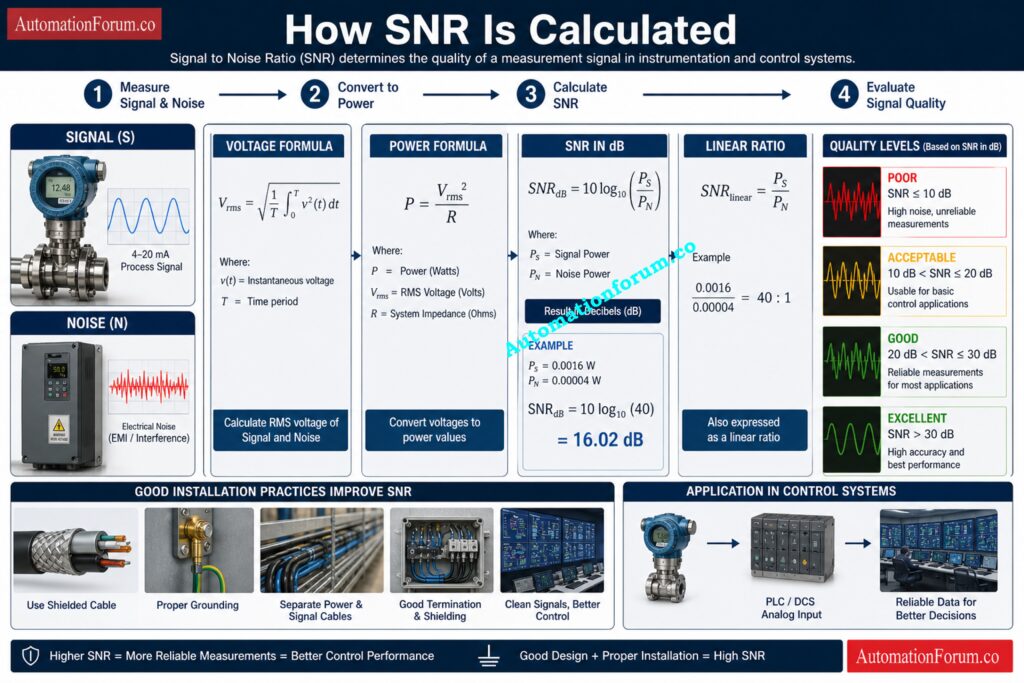
Why SNR Is Expressed in dB
In industrial practice, SNR is usually expressed in dB because decibel form makes it easier to compare signal quality across systems and signal ranges. Higher SNR means better clarity. Lower SNR means the measurement is more vulnerable to interference. The calculator also shows the linear ratio so engineers can understand the result in direct signal-to-noise terms, not only in decibels.
Verify Live 4-20 mA Signals Fast: Live Signal Verification 4 to 20 mA Loop Standard Operating Procedure (SOP)
SNR Formula and Engineering Interpretation
The calculator supports both of the standard SNR relationships used in engineering practice:
Voltage-Based SNR Formula
SNR(dB) = 20 × log10(Signal / Noise)
Power-Based SNR Formula
SNR(dB) = 10 × log10(Signal / Noise)
When to Use Voltage vs Power Method
The difference matters because voltage and power do not behave the same way. When the input values are voltages such as V, mV, or µV, the calculator uses the voltage method. When the values are power quantities such as W, mW, or µW, it uses the power method.
Why Signal and Noise Must Belong to the Same Unit Family
That is why the unit family must remain consistent. Mixing voltage with power would produce an invalid comparison, so the calculator prevents that and shows a warning if the families do not match.
Spot Dead Zero Problems Before Shutdown: Beyond Zero: Understanding the Dead Zero Problem in Industrial Analog Signals
SNR Calculator Input Parameters
Signal Value
This is the useful measurement value you want to evaluate. In practice, it may be the output of a sensor, transmitter, signal conditioner, or process interface. The actual number depends on the application, but the main goal is to judge whether the signal is strong enough compared with the noise. The calculator accepts a numeric value and updates the results immediately once calculation is performed.
Signal Unit
The signal unit determines whether the calculation follows the voltage family or the power family. The calculator includes:
Voltage units are common in instrumentation and analog measurement circuits. Power units are used in systems where power-level comparison is the correct engineering basis. The calculator keeps these separate so the result remains technically valid.
Challenge Your Instrument Signal Type Knowledge: Quiz on Instrumentation Signal Types
Noise Value
Noise is the unwanted disturbance affecting the signal. In field systems, it may come from EMI, grounding problems, poor shielding, electrical switching, VFDs, cable interference, or mechanical vibration. The calculator requires this value to be greater than zero because SNR is a ratio and cannot be calculated against zero noise.
Choose the Right IS Loop Isolation: Understanding Zener vs Galvanic Isolation in IS Loops for 4 to 20 mA Systems
Noise Unit
The noise unit must match the same family as the signal unit. That means voltage with voltage or power with power. This is important because a correct SNR calculation depends on comparing like with like. The calculator checks this condition before producing a result.
Refer the below link for How to do troubleshooting of a 4-20mA loop?
Impedance (R)
The impedance field is included for circuit context and engineering documentation. It is useful when reviewing a measurement path or reporting the test condition, but it is not required for the ratio calculation itself when the signal and noise are already entered in the same unit family.
Why Engineers Keep Trusting 4-20 mA: Why Engineers Still Trust the 4-20 mA Signal in Automation Systems
SNR Calculator Output Interpretation
The calculator displays four useful outputs: SNR in dB, linear ratio, quality, and method. These are arranged to help engineers move quickly from a mathematical result to a practical decision.
SNR in dB
This is the main result. The calculator classifies SNR into practical engineering bands:
These ranges are useful during commissioning, troubleshooting, and signal validation because they show whether the signal is likely to perform reliably or whether noise reduction work is needed.
Linear Ratio
The linear ratio tells you how many times stronger the signal is than the noise. For instance, a value of 100:1 means that the signal is 100 times stronger than the noise.. Engineers often use this form when discussing field conditions with maintenance teams or when documenting test results in a simple and direct way.
Signal Quality Indicator
This output gives a practical quality judgment instead of leaving the engineer with only a number. It helps answer a simple question: is the signal good enough for plant operation, or does the system need attention? A poor rating often suggests wiring, shielding, or grounding issues. A good or excellent rating usually indicates a stable and usable measurement.
Hunt Loop Faults Faster with Calibrators: 4-20 mA Loop Troubleshooting with Loop Calibrators : A Practical Guide
Calculation Method
The method field confirms whether the calculator used the voltage or power formula. This is important because the same signal-to-noise relationship must be interpreted using the correct formula for the selected unit family.
Track Down PLC DO Failures Quickly: Troubleshooting PLC Digital Output Signals – Advanced Industrial Quiz for Automation Engineers
How to Use the SNR Calculator
Use the calculator in this order:
The calculator is designed to be practical for field and engineering use. If the signal or noise value is invalid, or if the units do not belong to the same family, it does not produce a misleading result. Instead, it shows a clear message so the user can correct the input before relying on the output. That makes it useful for troubleshooting, commissioning, and signal validation work.
Test Your DO Troubleshooting Skill Hard: Advanced Quiz on Practical Troubleshooting of DO Signals in PLC for Process Industries
Where SNR Is Used in Industrial Applications
SNR is relevant across many automation and instrumentation applications. It is especially important in:
In these systems, a weak signal or excessive noise can reduce measurement confidence, increase instability, and create unnecessary troubleshooting time. In clean installations, a good SNR supports better process visibility and smoother control performance.
Uncover Hidden 24VDC Faults in the Field: Why 24VDC is Not Always 24VDC – Real-World Troubleshooting for Analog and Digital Signals
When to Use This SNR Calculator](https://cdn.automationforum.co/uploads/2026/05/Signal-to-Noise-Ratio-SNR-Calculator-5-1024x683.jpg)


 Basics in Process Industries Expert MCQ Quiz 1")