Introduction To ESD Control Systems In Process Industries
In process industries, emergency shutdown control systems are important safety measures that stop dangerous situations from turning into significant disasters. These systems keep an eye on unusual situations like high pressure, high temperature, or gas leaks and instantly put the plant in a safe state that has already been set. ESD systems work on their own and are made to meet certain Safety Integrity Level standards.
What Is an Emergency Shutdown (ESD) System?
An Emergency Shutdown system is a safety control system that automatically shuts down or separates a process when it finds harmful conditions. It usually has sensors, a logic solver, and final control parts like shutdown valves. When you put these parts together, they make Safety Instrumented Functions that lower the chance of dangerous incidents.
Why ESD Matters in Process Industries?
Process industries work with dangerous chemicals, combustible materials, and high-energy systems. Without a good ESD system, even small mistakes might cause big problems. ESD lowers risks on its own, helps meet functional safety standards, and keeps people, property, and the environment safe.
Instrumentation underpins safety, product quality and process control in heavy industries. Ensuring measurement instruments are calibrated and that calibration is performed to recognised ISO standards reduces production risk, improves compliance, and preserves contractual and legal defensibility. This guide translates the relevant ISO requirements into practical, step-by-step actions you can apply on the shop floor and in the calibration lab. You will get clear coverage of ISO standards for instrumentation calibration, including ISO 9001 (monitoring & measuring resources), ISO/IEC 17025 for calibration laboratories, ISO 10012 measurement management guidance, and how NABL accreditation interacts with lab competence and traceability.
Why ISO Standards For Instrumentation Calibration Matter In Process Industries
Key Benefits Of ISO Based Calibration Programs
Reliable measurements protect safety product quality and regulatory compliance. In process industries a single misreading can cause product off spec plant trips environmental release or safety incidents ISO based calibration programs reduce these risks by standardizing how instruments are controlled calibrated and recorded Key benefits include:
Demonstrable legal and contractual compliance.
Improved process safety and reduced production risk.
Consistent quality assurance across shifts sites and vendors.
Simplified supplier qualification when using accredited laboratories.
Risks Of Non Compliance In Calibration Activities
Failing to meet ISO standards for instrumentation calibration leads to common failures such as missed calibrations, untraceable records, lack of uncertainty data and instruments left in service without verification. Consequences include failed audits production losses safety investigations and contractual disputes.
ISO 9001 Monitoring and Measuring Resources Clause 7.1.5
ISO 9001 requires organizations to determine monitoring and measuring resources and ensure they remain suitable for their intended purpose. This includes identification calibration verification protection and maintenance. Clause seven point one point five is the plant level requirement that drives policies for instrument control tagging calibration intervals and record retention.
ISO/IEC 17025 Calibration Laboratory Competence and Reporting Requirements
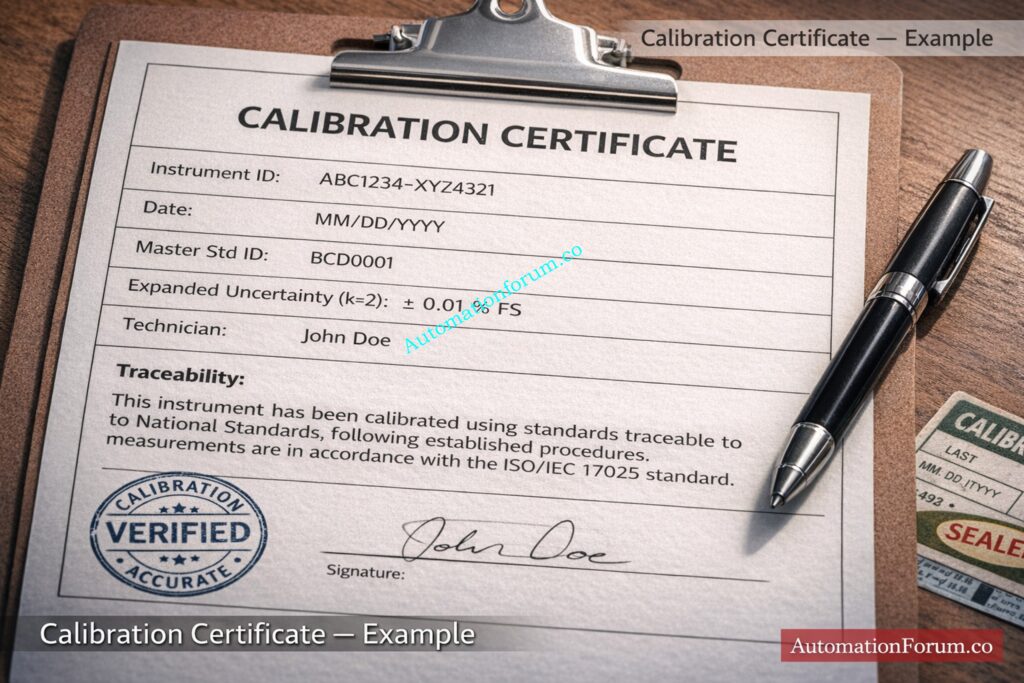
ISO IEC 17025 is the international benchmark for calibration and testing laboratories. It covers technical competence method validation measurement uncertainty environmental controls equipment traceability and the content and format of calibration certificates. When you use in house or external laboratories ISO IEC 17025 alignment ensures reported values and uncertainties meet international expectations
ISO 10012 Measurement Management System Guidance
ISO 10012 provides guidance for establishing a measurement management system It helps organizations plan measurement activities select measurement processes and perform metrological confirmation. The standard complements ISO 9001 and ISO IEC 17025 when an organization performs measurements as part of its quality system.
NABL Accreditation And Scope Of Calibration Laboratories
NABL accreditation confirms that a calibration laboratory complies with ISO/IEC 17025 requirements for technical competence, traceability, and measurement uncertainty evaluation. The laboratory’s scope of accreditation defines the exact measurement parameters, ranges, and uncertainties it is authorized to perform. Before selecting a calibration provider, always verify that the required measurement quantity and range are covered within the lab’s approved NABL scope.
ISO 45001 and ISO 14001 Relevance In Calibration Activities
ISO 45001 promotes safe working practices for calibration tasks such as isolation lock out tag out working at height and confined space entries ISO 14001 provides guidance on environmental handling such as disposal of calibration fluids and chemical wastes. Both standards are relevant to ensure calibration work does not create safety or environmental liabilities.
Instrument Identification Tagging and Record Linking
Every instrument must have a unique tag or code that links to its calibration record in the equipment management system. Labels should clearly show current calibration status and the next due date. Use barcodes or QR codes where possible to speed field access to records.
Traceability in calibration requires an unbroken documented chain from the device under test through working and master standards to national standards. Record certificate numbers dates scopes and uncertainty values at each level. Protect and back up records and define retention period in the quality manual. Common retention times are three to seven years but may be longer for regulated products.
Define a workflow for devices found out of tolerance Include quarantine labeling risk assessment root cause analysis corrective action and disposition options such as repair recalibration or replacement. Keep records of decisions and impacts on products and processes.
ISO IEC 17025 Expectations For Calibration Laboratories
Personnel Competence Training and Proficiency Testing
Laboratory staff must hold documented qualifications training and competence evidence. This includes a competence matrix periodic assessments and records of proficiency testing or inter laboratory comparisons that demonstrate technical ability.
Laboratories are expected to evaluate uncertainty for each measurement result. Use the GUM approach identify type A and type B uncertainty components quantify standard uncertainties combine them by root sum square and report expanded uncertainty with a coverage factor commonly k equals 2 for approximately 95 percent confidence. Include the uncertainty budget method assumptions and sensitivity coefficients in laboratory records.
Control ambient conditions that affect measurements and log temperature humidity and any relevant environmental parameter during calibration Masters and working standards must have valid certificates and scheduled verification routines. Record storage conditions and handling procedures for master standards.
Traceability In Calibration and Hierarchy Of Standards
National Standards Accreditation and Laboratory Scope Verification
Traceability requires a documented chain of comparisons to national or international standards. In many countries a national accreditation board such as NABL accreditation in India assesses laboratories against ISO IEC 17025 and records scopes of accreditation that define the measurement ranges and quantities for which the lab is competent. When selecting an external provider verify its scope matches your measurement requirement.
The practical hierarchy is national standard to primary standard to master standard to working standard to device under test. Maintain certificates for each level and record certificate identifiers and calibration dates. This chain underpins the traceability statement on calibration certificates.
Working Standards and Master Standards Management
Maintain a register for all master and working standards that includes storage conditions last calibration date uncertainty and custodian name. Protect masters against environmental stress and log any comparisons between masters and working standards.
Measurement Uncertainty In Calibration Practical Guidance
Test Uncertainty Ratio TUR and Acceptance Criteria
Test Uncertainty Ratio TUR is the ratio of allowable tolerance to calibration uncertainty. A common guideline is the four to one rule which suggests calibration uncertainty should be at least four times smaller than device tolerance. This rule reduces false accept risk but is only a heuristic Use a risk based decision that accounts for safety and quality consequences when setting acceptance rules.
Integrating Calibration Records With CMMS Or Calibration Management Software
Use this template as a spreadsheet that feeds your maintenance or calibration management system. Include validation for date formats pick lists for types and automated reminders for upcoming due dates. The table helps technicians capture consistent information in the field and supports rapid audit evidence assembly.
Step By Step Instrument Calibration Procedure as Per ISO
Pre Calibration Checks and Planning
Verify the instrument identity confirm isolation and permits and review previous calibration history. Capture process conditions and any known failure modes. Plan for required tools references and environmental checks.
Environmental Verification and Measurement Conditions
Record ambient temperature humidity and supply conditions if they influence measurement outcomes. Ensure conditions meet procedural limits and document any deviations.
Record instrument readings before any adjustment These as found values support trending and root cause analysis. If adjustment is allowed follow manufacturer procedure or plant SOP. Document steps taken and rationale for adjustment.
Record as left values confirm acceptance criteria are met and update the equipment record. Attach or issue a calibration certificate that contains traceability uncertainty and signatures. Update the asset tag or CMMS with next due date and status.
Disposition Process for Out Of Tolerance Instruments
If an instrument cannot be adjusted into tolerance perform an impact assessment. Decide on quarantine repair replacement or increased monitoring and record the corrective action and effect on past product and process data.
Common Audit Findings In Calibration And How To Prevent Them
Frequent Non Conformance Examples In Calibration Audits
Auditors often find missing traceability records expired master standards no uncertainty calculations and unlabeled instruments. Prevent these by maintaining the master register enforcing record retention performing internal proficiency checks and using a central calibration tracking system.
ISO Based Calibration for Audit Ready Measurement Systems
Adopting ISO standards for instrumentation calibration brings structure traceability and technical rigor to measurement management. When you align plant procedures with ISO 9001 calibration requirements and use ISO IEC 17025 accredited laboratories for technical competence you create an audit ready measurement system that supports safety product quality and regulatory compliance. Maintain clear traceability to national standards manage uncertainty in a documented way and run a risk based calibration plan to keep instruments reliable and claims defensible. Implement the documentation templates and the instrument calibration procedure as per ISO to reduce audit findings and to demonstrate measurement assurance across your operations.
FAQ On ISO Standards for Instrumentation Calibration
What is The ISO Standard for Instrument Calibration?
There is no single ISO standard exclusively for instrument calibration. ISO 9001 covers calibration control under monitoring and measuring resources, while ISO IEC 17025 defines competence requirements for calibration laboratories.
What are ISO 45001 and ISO 14001 Standards?
ISO 45001 is an occupational health and safety management standard that ensures safe working conditions. ISO 14001 is an environmental management standard focused on controlling environmental impacts and regulatory compliance.
What is ISO IEC 17025 Calibration?
ISO IEC 17025 calibration refers to calibration performed by a laboratory that meets international requirements for technical competence, traceability, and measurement uncertainty evaluation.
What is The Difference Between ISO 17025 and ISO 10012?
ISO IEC 17025 applies to testing and calibration laboratories and focuses on technical competence and uncertainty reporting. ISO 10012 provides guidance for organizations to manage measurement processes within a quality management system.
What are the Five Requirements for a Calibration Standard ?
Key requirements include traceability to national standards, defined calibration intervals, documented procedures, evaluation of measurement uncertainty, and proper calibration records with identification and approval.
Is ISO IEC 17025 Mandatory?
ISO IEC 17025 is not legally mandatory in most cases, but it is often required by regulators, customers, or contracts when laboratory competence and traceable calibration results must be demonstrated.
Refer the below link for the Collection of Instrument Calibration Activity Calculators for Accurate Adjustments
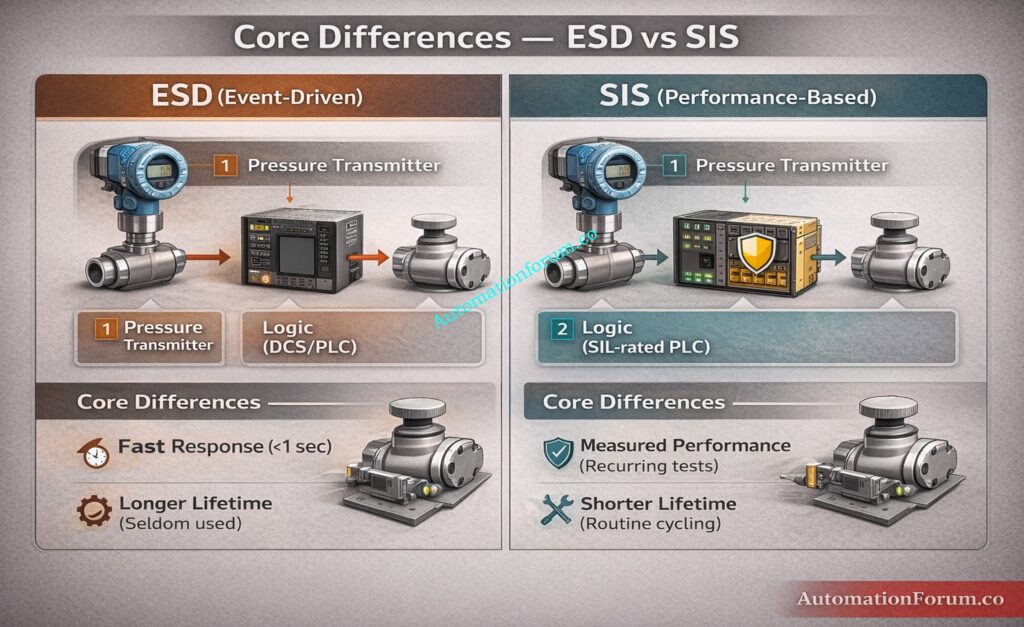
In process industries such as oil & gas, petrochemical, refining, LNG, pharmaceuticals, power generation, and specialty chemicals, the confusion between Emergency Shutdown (ESD) and Safety Instrumented Systems (SIS) continues to create design inconsistencies, audit findings, and unnecessary capital expenditure.
Why Understanding ESD vs SIS Matters in Process Industries
Both systems perform shutdown actions. Both may close valves and trip equipment. Both appear to “protect the plant.”
However, the difference between ESD vs SIS is not in the physical action it is in the risk justification, performance requirement, independence criteria, and lifecycle management behind that action.
This comprehensive technical guide explains in depth:
Real refinery, LNG, compressor, and pipeline examples
Brownfield upgrade challenges
Independence requirements
Testing philosophy differences
Practical engineering decision framework
This guide is structured specifically for instrumentation engineers, process safety engineers, EPC engineers, QA/QC professionals, and maintenance teams working in high-hazard industries.
Emergency Shutdown (ESD) is a system or logic arrangement designed to bring equipment or an entire plant to a safe state during abnormal or emergency conditions.
A Safety Instrumented System (SIS) is a formally engineered, risk-reduction system designed to achieve a defined Safety Integrity Level (SIL) through implementation of one or more Safety Instrumented Functions (SIFs).
Unlike ESD, SIS is:
Performance-based
Quantified
Lifecycle-managed
Auditable
Risk-justified
SIS follows standards such as IEC 61511 for the process industry.
What is a Safety Instrumented Function (SIF)?
A SIF is a specific safety function designed to:
Detect a hazardous condition
Decide using a logic solver
Execute a final element action
Achieve defined risk reduction target
Each SIF has:
Defined process safety time
Defined probability of failure on demand
Defined SIL target
Proof test interval
Hardware architecture requirements
SIS is the overall system. SIF is the individual safety function inside it.
SIS Lifecycle in Process Industry
Unlike simple ESD logic, SIS must follow the full functional safety lifecycle:
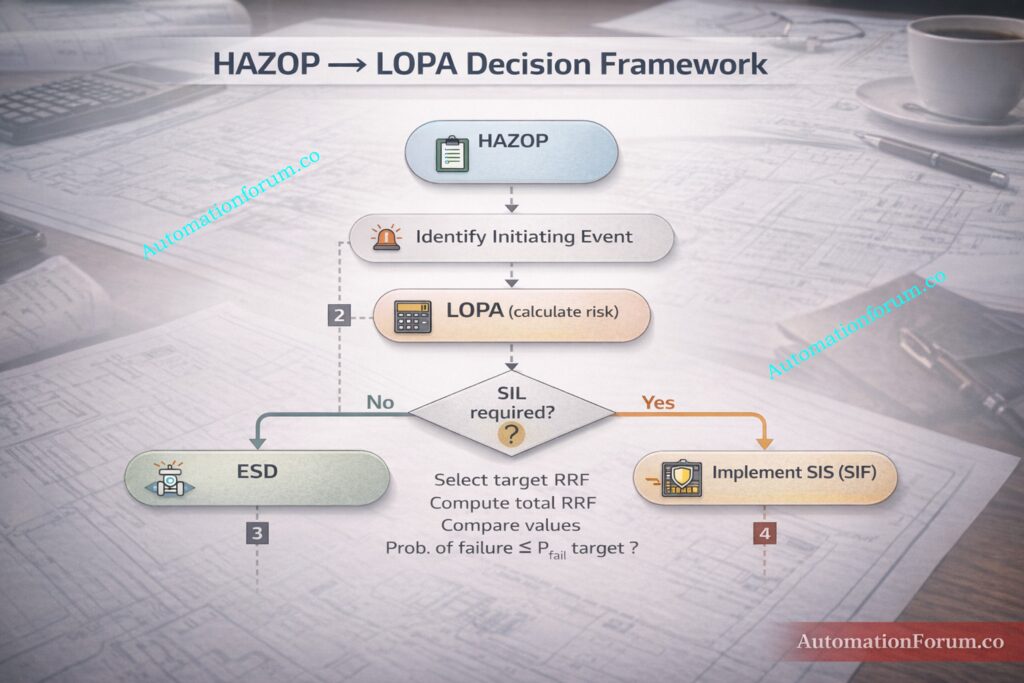
Hazard identification (HAZOP)
Risk analysis (LOPA)
SIL assignment
Detailed engineering design
Verification and validation
Installation and commissioning
Proof testing and maintenance
Periodic review and MOC control
SIS is governed by standards such as IEC 61511 (process industry).
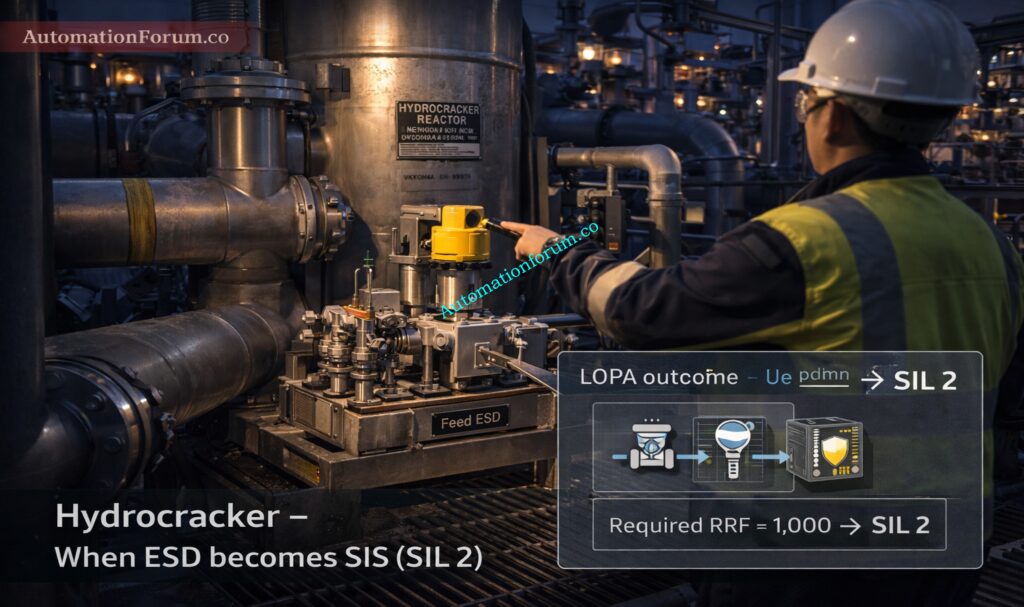
Practical example: A pressure excursion is currently handled by ESD isolation via DCS. LOPA shows the ESD alone doesn’t achieve the needed risk reduction. The project team then determines whether to:
Formalize the ESD as a SIF and apply SIL requirements (hardware architecture, diagnostics, proof testing), or
Brownfield traps: Many plants operate for years with ESD trips not justified as SIFs. During later HAZOP/LOPA reviews these may be retrofitted into the SIS lifecycle a process that requires
scope, budget and careful implementation planning.
Formalized and periodic, based on failure rates and SIL.
Recognizes partial-diagnostic coverage and seeks to reveal hidden failures.
Documented test procedures and records are mandatory for audits.
Management of Change (MOC) and spares policy must be documented.
Failing to apply proof-testing regimes when a function is effectively performing a safety role leads to silent reliability decay the SIS requirement prevents that.
Practical engineering takeaway – do this on every project
Define function first, hardware later. Start with what the safety function must do (detect, respond, isolate), then determine whether it must be an SIS SIF with SIL or can be an ESD action.
Run HAZOP then LOPA early. Use LOPA outputs to determine whether existing ESDs need SIL justification.
Ensure independence. If the intention is to credit a function, design separation between BPCS and SIS from day one.
Document testing requirements. If you decide a function is a SIF, add proof testing, inspection plans, spare lists and MOC processes.
Treat operator actions as support, not the sole credited layer.
Plan brownfield upgrades carefully. Account for budget/time to meet SIL requirements if converting ESD → SIS.
Communicate clearly in design documents. Label which trips are ESD-only vs. SIF-with-SIL so commissioning, operations and auditors are aligned.
No ESD is not automatically part of an SIS. It becomes part of an SIS only if risk assessment or LOPA assigns it as a SIF and it is implemented under the functional safety lifecycle.
Can an ESD be SIL rated?
Yes an ESD can be SIL rated when LOPA requires quantified reliability. In that case it is engineered as a SIF with a SIL target safety rated hardware diagnostics and proof testing.
What is the difference between ESD and DCS?
ESD is an event driven protective shutdown system while DCS is a distributed control system for continuous process control and operation. ESD focuses on rapid isolation during emergencies whereas DCS manages normal control loops sequencing and optimization.
DCS controls and optimizes the production process while SIS is an independent safety system designed to reduce risk to a tolerable level. SIS implements SIL assigned safety functions under a formal lifecycle whereas DCS focuses on operational control.
What is the difference between PLC and SIS?
A PLC is a general purpose industrial controller used for automation and control tasks. SIS is a certified safety system that may use safety rated PLCs to implement SIL based safety instrumented functions.
What does ESD stand for?
ESD stands for Emergency Shutdown. It refers to a system designed to quickly bring equipment or a plant to a safe state during abnormal or emergency conditions.
What is ESD used for?
ESD is used to rapidly isolate energy sources stop material flow and prevent escalation during emergencies. Typical actions include closing ESD valves tripping pumps or compressors and shutting down hazardous operations.
Refer the below link for the Selecting the Right Emergency Shutdown Valve Strategy
Definition and Purpose of Process Value Cross Check
A Process Value Cross Check is a useful way to check if a transmitter is showing the right process value while it is running.
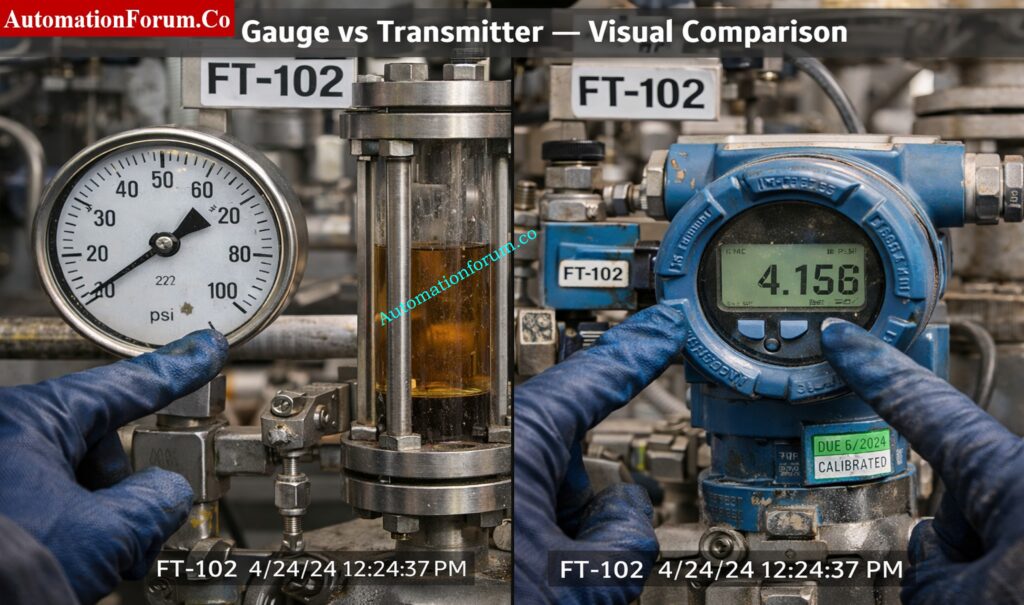
It means checking the transmitter reading against a separate reference, like:
A local gauge or sight glass
A temporary reference instrument or portable calibrator
A manual calculation that uses engineering formulas
The goal is to immediately find out if the instrument is correct or if the problem is caused by drift, a configuration error, a mechanical blockage, electrical noise, or changing process conditions.
A cross check checks performance directly in the running process, which is different from full calibration.
Why Transmitter Reading Verification is Critical in Process Industries
In process industries, transmitter readings control safety systems, product quality, and operational efficiency. An incorrect reading can cause:
False trips and shutdowns
Off specification product
Incorrect control actions
Safety risks
Even slight mistakes in measurements can have big effects on finances and operations.
Routine Process Value Cross Checks assist find offsets, spot drift early, avoid downtime, and make preventive maintenance plans stronger.
Why Process Value Cross Check is Important for Safety Quality and Compliance
Preventing False Trips and Unnecessary Shutdowns
A Process value cross check is not a paperwork exercise it is a frontline defence for safety product quality and regulatory compliance. Field teams that routinely cross check instrument readings identify wrong range incorrect density settings and scaling errors before they cause false trips overfill or off specification product.
Avoiding Off Specification Product and Process Loss
Cross checks reduce unplanned downtime by catching problems early. For example a level transmitter reporting full while a sight glass shows half full may trigger unnecessary shutdowns or emergency valve action. Conversely under reporting flow can lead to product shortfalls that damage customer relationships.
Reducing Maintenance Cost Through Early Drift Detection
Key reasons to cross check include safety quality cost avoidance and preventive maintenance value. A short list follows
Safety detect runaway conditions or stuck valves before escalation
Quality and compliance demonstrate measurement verification for audits
Cost avoidance prevent false trips unnecessary purges and scrapped batches
Cross checks are particularly useful where fluid density changes with temperature or composition and where instrument range was adjusted during maintenance. A simple comparison between a transmitter and a local gauge often reveals configuration errors that mimic sensor failure.
Process Value Cross Check Methods – Gauge Comparison Portable Calibrator and Manual Calculation
Choose comparison methods that expose different failure modes. Use a local gauge or sight glass for quick visual confirmation. Use a temporary reference instrument such as a portable calibrator for traceable verification. Use a manual calculation as an independent engineering check when other instruments are not available.
When to Use Local Gauge for Pressure Level and Temperature Cross Check
Use local gauges and sight glasses for quick field checks of pressure level and temperature. They are simple to read and require no electronics.
Accuracy Limitations of Mechanical Gauges
Mechanical gauges and sight glasses are robust but coarse in accuracy typically within one to five percent. They are prone to parallax and blocked impulse tubing but are practical for rapid checks.
Practical Field Example of Gauge vs Transmitter Comparison
A differential pressure transmitter for level cross checked against a sight glass on the same vessel may show disagreement. If the sight glass shows half full but the transmitter shows full investigate impulse tubing and density compensation in the transmitter.
Temporary Reference Instrument Verification Using Portable Calibrator
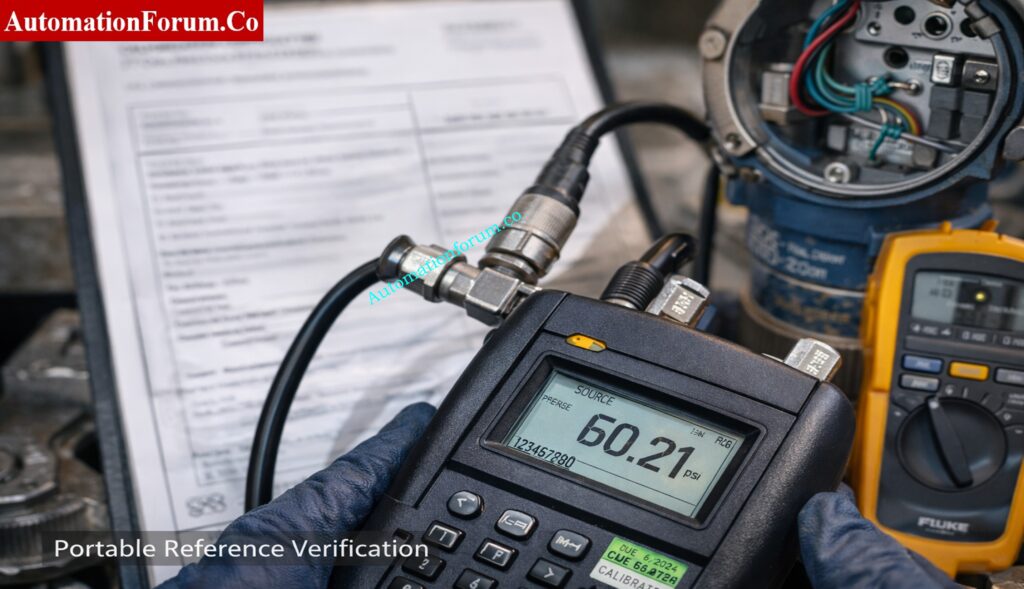
Why Portable Calibrators Provide Traceable Verification
A portable instrument provides a calibrated reference for verification. Common tools include pressure calibrators clamp on ultrasonic meters pitot tubes and portable temperature calibrators. Use these when precise comparison is needed.
Accuracy Expectations and Calibration Certificate Requirements
Portable calibrators often have traceable accuracy better than one percent. Correct connection and stable process conditions are required. Check the calibration certificate before use.
Field Example of Transmitter Output Validation Using Reference Instrument
A portable pressure calibrator applied to the impulse port confirms or rejects the transmitter output. If the calibrated device agrees with the local gauge but not with the transmitter suspect configuration or transmitter failure.
Manual Calculation Method for Flow and Level Cross Check
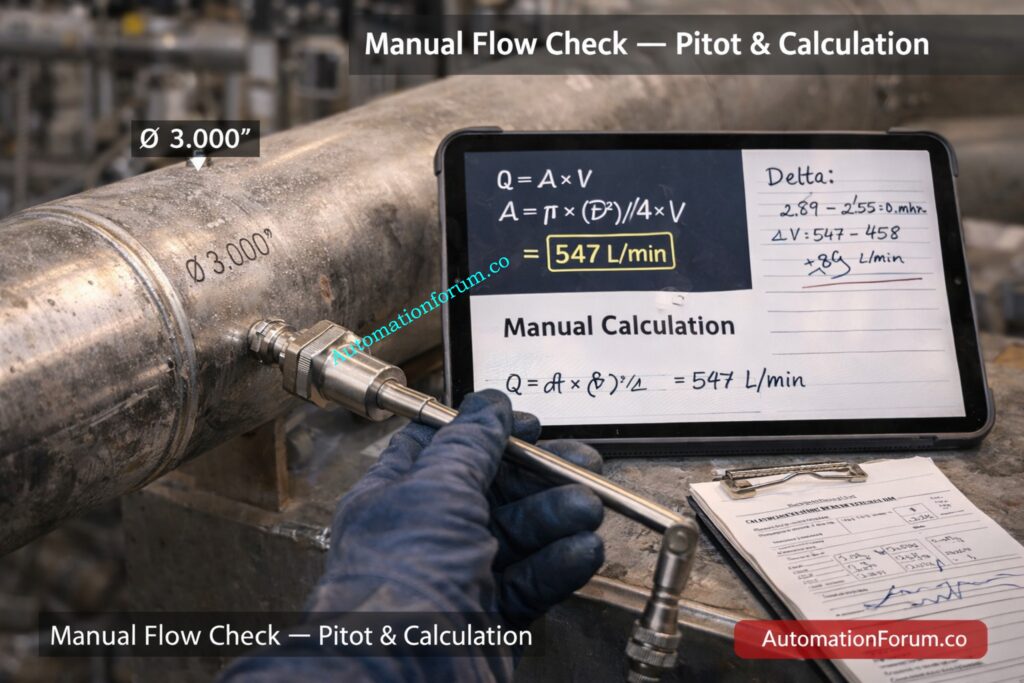
Purpose and when to use Manual calculations use fundamental physical relationships to provide an independent check. Use area times velocity for flow checks and hydrostatic head for level checks when other references are not present.
Accuracy and limitations The accuracy depends on input data quality such as pipe internal diameter velocity measurement and fluid density. Treat manual calculation as a sanity check and record assumptions.
Example Calculate flow in a three inch pipe using measured velocity and pipe internal diameter then compare with the flow transmitter reading to identify possible span issues or two phase flow.
Step by Step Process Value Cross Check Procedure – Field Checklist for Technicians
Follow a methodical sequence. Start with safety and pre checks then record readings and observations. The checklist below is designed to be copied into a field log.
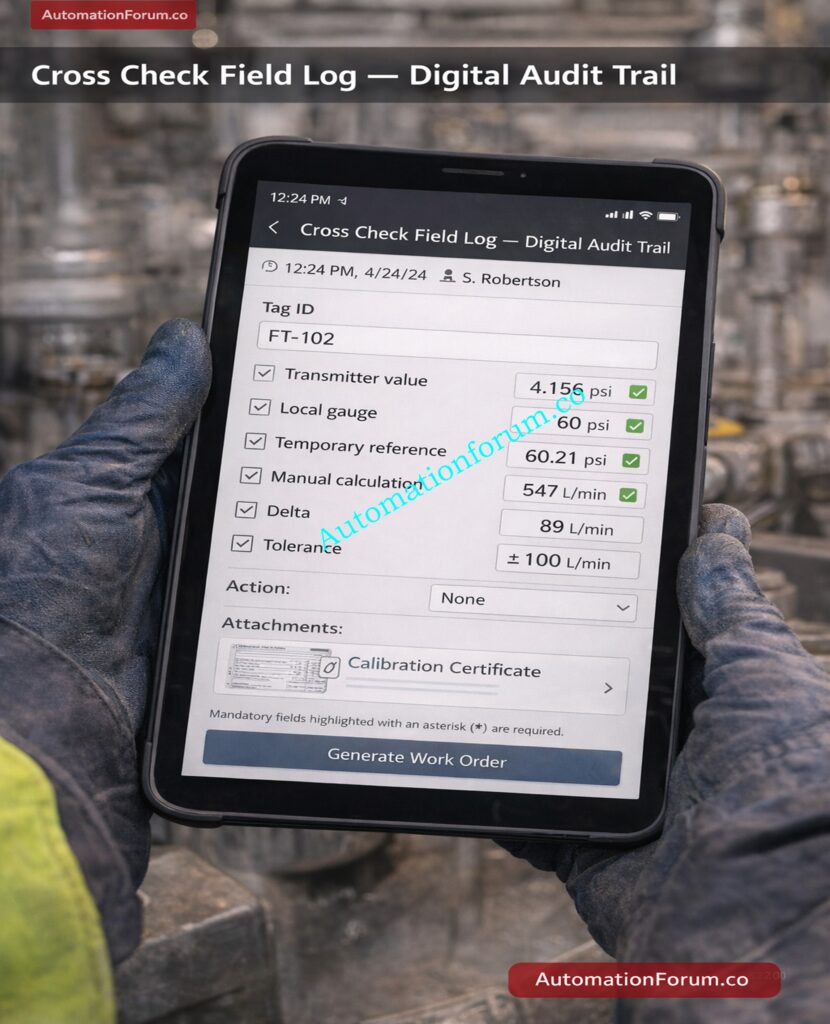
Field Log Template for Process Value Cross Check Documentation
Timestamp
Tag
Transmitter value
Local gauge
Temporary reference
Manual calculation
Delta
Condition notes
Action
10 12
PT 101
3.45 bar
3.40 bar
3.42 bar
n a
0.05 bar
Impulse tubing wet
Monitor
10 16
FT 205
547 litres per minute
n a
552 litres per minute
547 litres per minute
5 litres per minute
Pipe vibration
Check flowmeter span
How to Record Delta and Tolerance
Set site specific tolerance based on criticality. Typical examples are one to two percent for critical control loops three to five percent for monitoring loops and two to five percent for mechanical gauges. Convert percentage tolerances to engineering units at normal operating points and record them.
How to Interpret Cross Check Results – Offset Drift and Scaling Errors
Patterns in the data reveal the likely cause. A steady offset where the difference is constant across conditions suggests calibration or configuration error.
Drift over time suggests sensor ageing moisture ingress or progressive electronics fault. Random scatter points to mechanical or electrical noise such as blocked impulse tubing loose connectors or power supply instability.
If the offset changes with temperature or composition suspect density compensation or range mismatch. For example a differential pressure transmitter used for level measurement will respond to fluid density changes. If the difference grows with signal amplitude investigate transmitter linearity and span.
Best Practices, Frequency and Documentation for Audits
Define frequency by loop criticality. Critical safety loops may need daily to weekly checks. Important process control loops are often checked weekly to monthly.
Low risk monitoring loops can be checked quarterly. Use failure history to adjust cadence and focus resources where they reduce risk most.
Use data historians and statistical analysis to detect slow drift. Set up alarms for persistent offset and trend anomalies so maintenance resources are deployed where they matter most.
For audits keep a linked record showing who performed the check what temporary reference instrument was used and attach calibration certificate evidence. Use digital forms to reduce transcription mistakes and preserve timestamps and operator identity.
Include cross check status in shift handovers and maintenance work packs. Use standard forms to ensure consistent recording and escalation paths.
Case Study – Flow Transmitter Validation Using Manual Calculation and Pitot Measurement
Field Scenario Description
Scenario FT 205 a differential pressure based flow transmitter reports five hundred and sixty litres per minute.
Operations doubt the reading. A pitot temporary reference monitors the speed of a fluid in a three-inch pipe at two meters per second.
To find volumetric flow, multiply the area by the velocity and compare the results.
Step by Step Flow Calculation
The pipe’s diameter is three inches, which is seventy-six point two millimeters or zero point zero seven six two meters. To find Area A, multiply pi by the diameter squared and then divide by four.
The square of the diameter is zero point zero seven six two times zero point zero seven six two, which is zero point zero zero five eight zero six four four.
To get zero point zero one eight two four one, multiply by pi. Then, to get zero point zero zero four five six zero three seven square metres, divide by four.
To get zero point zero zero nine one two zero seven four cubic metres per second, multiply the area by the speed of two metres per second. Convert to litres per minute multiply by one thousand then by sixty to obtain approximately five hundred and forty seven litres per minute.
The calculated flow of approximately five hundred and forty seven litres per minute compared with the transmitter five hundred and sixty litres per minute yields a delta of thirteen litres per minute or two point four percent.
Recommended Corrective Actions for Marginal Results
For a critical loop with a tolerance of one to two percent this is marginal.
Actions include repeating the measurements confirming pitot calibration checking pipe internal diameter and verifying there is no two phase flow present.
Log results attach calibration certificate images and schedule corrective action if required.
Training and Standard Operating Procedure for Process Value Cross Check
Ensure technicians receive hands on training and shadowing.
Keep a clear standard operating procedure for cross-checks that includes a step-by-step list of tasks, a way to record measurements, and rules for how to handle problems.
Use what you learned from cross checks to change your procedures and tolerances.
Add the status of the cross check to the daily handover notes, and make sure that any remedial action has a maintenance ticket reference so that it can be checked.
Digital Documentation and Mobile Data Capture for Process Value Cross Check
Benefits of Structured Digital Forms
Using mobile forms to collect data cuts down on transcribing mistakes and makes it easier to follow the process value cross-check.
Technicians can now enter values immediately into a structured digital form on a tablet or industrial mobile device instead of writing them down in a notebook and then entering them into a maintenance system.
Automatic Work Order Generation When Tolerance Is Exceeded
Including a picture of the temporary reference instrument and its calibration certificate makes it easier to track audits and shows that the cross-check was done with a properly calibrated equipment.
If the delta goes over the limit, the form can automatically make a work order when it is linked to a maintenance system. Stored recordings help find problems with drift or mechanics that happen over and over again.
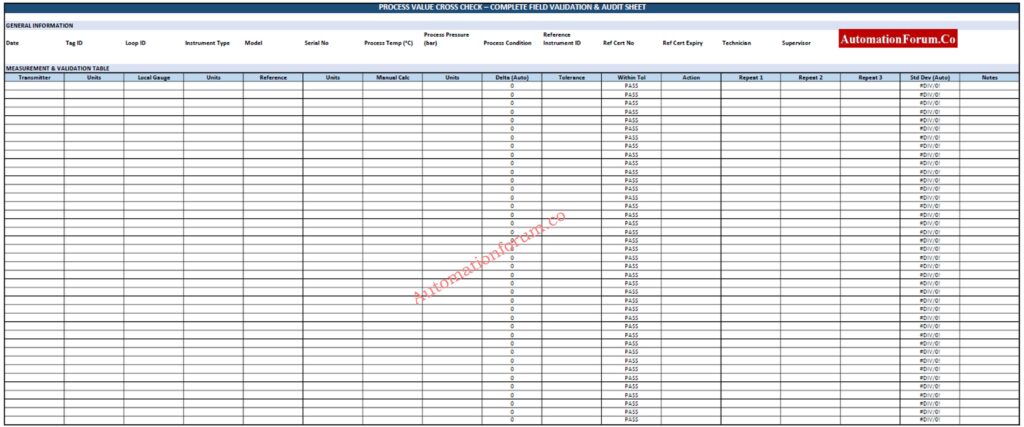
Process Value Cross Check – Field Validation and Transmitter Verification Checklist
A Process Value Cross Check is a useful way to make sure that a transmitter accurately shows how the process is doing right now. It checks the accuracy of the measurement by comparing the transmitter reading to a nearby gauge, a portable calibrated equipment, or a manual calculation.
With automatic delta calculation, tolerance evaluation, and action logging, this checklist gives you an organized, audit-ready way to do things. It helps find drift, configuration mistakes, and mechanical or electrical problems early, which helps keep people safe, improve product quality, and keep up with maintenance schedules. Download : Process_Value_Cross_Check_ENTERPRISE
Build a Reliable Process Value Cross Check Culture
A disciplined Process value cross check programme protects safety product quality and maintenance budgets. Start by selecting two critical loops to cross check this week and log the results. Use trending to detect slow drift and attach evidence to calibration and maintenance records. Share findings in handover and schedule corrective work when needed.
Online Mass Flow Rate Converter for Industrial and HVAC Applications
A mass flow rate converter is an essential engineering tool for converting between different mass and volumetric flow units quickly and accurately. The Mass Flow Converter on AutomationForum.co is designed specifically for instrumentation engineers, HVAC designers, process engineers, and maintenance professionals who need reliable mass flow units conversion in daily project work. It supports more than 50 units and uses a consistent base unit method to ensure transparent and traceable calculations.
Your Trusted Source for Automation Power Tools & Solutions
⚡ MASS FLOW CONVERTER
Professional Mass Flow Rate & Volumetric Conversion Tool
Mass Flow Rate Converter
Convert between 50+ mass flow rate and volumetric flow units with scientific precision
🎯 Quick Conversion Presets
⚡ Conversion Mode
🔍
🔍
🔍
🔍
🔍
📊 Conversion Comparison Table
📐 Conversion Formula & Steps▼
⚙️ Settings▼
📜 Conversion History▼
No conversions yet
ℹ️ About Mass Flow Rate & Units
Mass Flow Rate: Measures the mass of a substance passing through a given point per unit time. Common applications include HVAC systems, chemical processing, industrial manufacturing, and fluid dynamics.
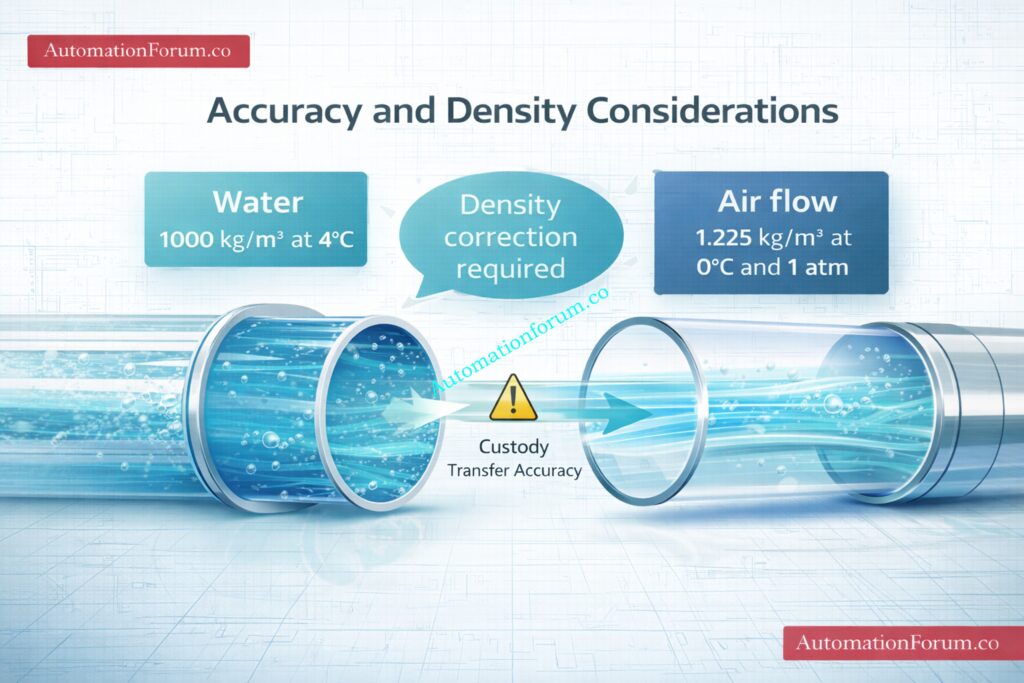
Volumetric Flow (Water): Assumes water density of 1000 kg/m³ (at 4°C). Units include L/h (liters per hour), m³/h, gal/min.
Volumetric Flow (Air/Gas): Assumes standard air density of 1.225 kg/m³ at STP (0°C, 1 atm). SCFM (Standard Cubic Feet per Minute) and Nm³/h are commonly used in compressed air systems and gas flow measurement.
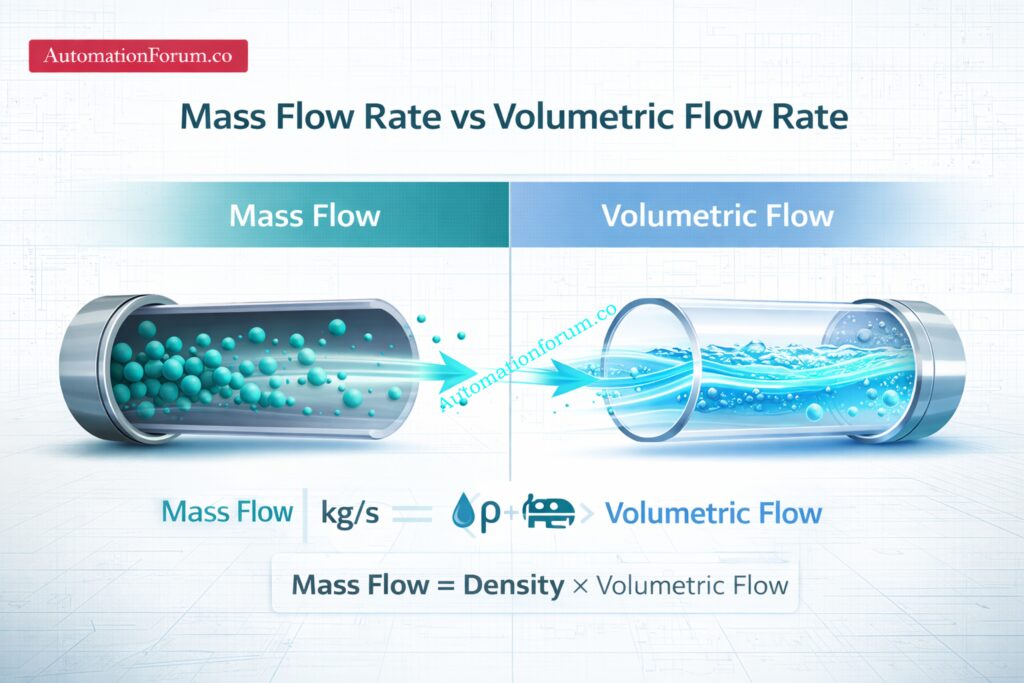
Difference Between Mass Flow Rate and Volumetric Flow Rate
Mass flow rate measures how much mass flows per unit time. For example, kilogram per second or pound per minute.
Volumetric flow rate measures how much volume flows per unit time. For example, cubic meter per hour, liter per hour, or standard cubic feet per minute.
Mass Flow Formula – Mass Flow Equals Density Multiplied by Volumetric Flow
The relationship between mass flow and volumetric flow is governed by density:
Mass flow equals density multiplied by volumetric flow.
This is why volumetric to mass conversion always requires a density assumption. When changing between volumetric and mass units, the Mass Flow Converter AutomationForum employs standard density values.
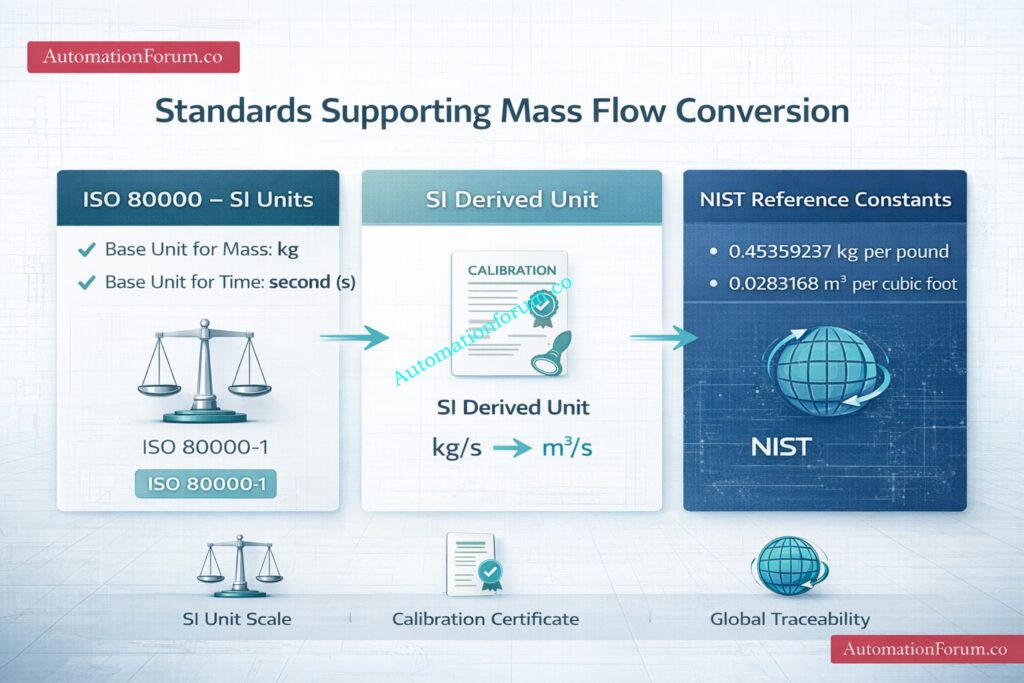
International Standards Supporting Mass Flow Measurement and Conversion
Internationally accepted standards are used to measure mass flow rate and change units so that the results are technically correct, can be traced, and are the same around the world. The main standards and references for converting mass flow units are:
ISO 80000 – SI Units for Mass and Time
ISO 80000 – Defines the International System of Units including kilogram as the base unit of mass and second as the base unit of time. Kilogram per second is therefore the derived SI unit for mass flow rate.
Standard Reference Conditions for Gas Flow-Sets the temperature and pressure levels for units like SCFM and Nm³ per hour. 0 degrees Celsius and 1 atmosphere of pressure are two common reference conditions.
Traceability Principles in Metrology – principles say that the unit conversions used in calibration, custody transfer, and reporting must be based on standard constants and known reference circumstances.
Using kilogram per second as the internal base unit in a mass flow rate converter aligns with ISO SI unit structure and supports globally consistent engineeringdocumentation.
Meet the Mass Flow Converter AutomationForum.co – Features
Mass Flow Converter AutomationForum.co provides an engineer oriented interface and features drawn from the tool build. Key elements include the following
Presets for common conversions such as kg per hour to lb per minute SCFM to kg per hour and L per hour to gal per minute
Single value mode for one off checks and quick calculations
Bulk convert mode that accepts newline or comma separated lists for batch processing
Comparison table mode that shows one input value across a set of common units side by side
CSV export and copy to clipboard for sharing conversion results and for inclusion in reports
History of recent conversions stored locally for quick recall of past values
Precision control that lets you select number of decimal places typically 2 4 6 8 or 10 depending on task
Show formulas option that reveals the numeric factors and the step by step calculation so results are auditable
Refer to the tool build for the full unit list UI behavior and the default density assumptions.
Supported Mass and Volumetric Flow Units Conversion Table
The converter supports 50 plus units including:
Kilogram per second Kilogram per hour Gram per second Ton per hour Pound per minute Pound per hour Ounce per minute SCFM SCFH Nm cubic meter per hour Liter per hour Cubic meter per hour Gallon per minute Ton US per hour Ton UK per hour Slug per second
This wide coverage makes it suitable as a complete mass flow conversion table for HVAC engineers and industrial users.
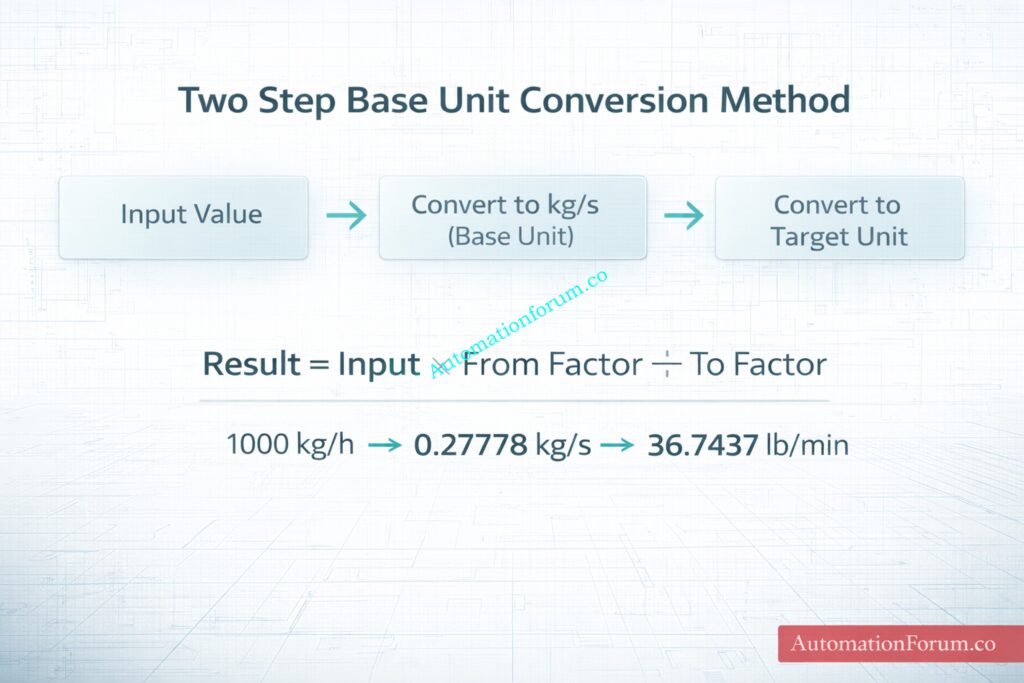
How to Convert Mass Flow Rate – Step by Step Engineering Method
Two Step Base Unit Method Using Kg Per Second
The converter uses a two step base unit approach to keep conversions consistent and simple.
1 Convert the input value to the base unit kg per second using the input unit factor 2 Convert from kg per second to the target unit using the target unit factor
The core formula used across the tool is
result = input × fromFactor ÷ toFactor
where fromFactor and toFactor are the numeric multipliers that convert a unit to kilograms per second.
Example 1 – Convert 1000 Kg/H to Lb/Min
Step 1 convert 1000 kg per hour to kg per second
fromFactor for kg per hour = 1 ÷ 3600
kgPerSec = 1000 × 1 ÷ 3600 = 0.2777777777777778 kg per second
Step 2 convert kg per second to lb per minute
toFactor for lb per minute = 0.45359237 ÷ 60 = 0.007559872833333333
result lb per minute = kgPerSec ÷ toFactor
result = 0.2777777777777778 ÷ 0.007559872833333333 = 36.74371036414626 lb per minute
So 1000 kg per hour is approximately 36.7437 lb per minute using the tool default factors.
Example 2 – Convert 500 SCFM to Kg/H Using Standard Air Density
The tool uses standard air density 1.225 kilograms per cubic meter and one cubic foot equals 0.0283168 cubic meters. Use those constants in the SCFM to kg per second factor.
Step 1 compute SCFM to kg per second factor
scfmFactor = 0.0283168 × 1.225 ÷ 60 = 0.0005781346666666667 kg per second per SCFM
kgPerSec = 500 × 0.0005781346666666667 = 0.28906733333333336 kg per second
Step 2 convert kg per second to kg per hour
kg per hour factor inverse = 3600
result kg per hour = 0.28906733333333336 × 3600 = 1040.6423999999999 kg per hour
So 500 SCFM is approximately 1040.6424 kg per hour with the standard air density assumption used by the tool.
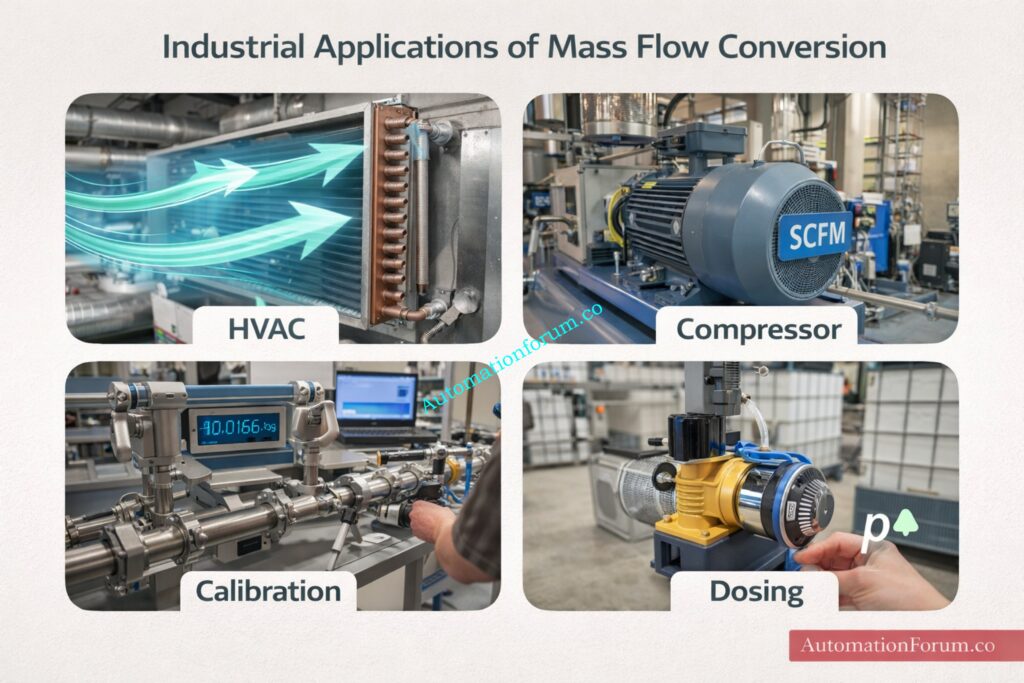
Practical Engineering Applications of Mass Flow Unit Conversion
Water density assumption in the tool is 1000 kilograms per cubic meter which corresponds to water near four degrees Celsius. Use a temperature corrected density for hot water or process liquids whose density changes significantly with temperature or composition.
Air and gas assumption in the tool is 1.225 kilograms per cubic meter representing standard conditions zero degrees Celsius and one atmosphere. For compressed air at elevated temperature or pressure or for other gases compute gas specific density using ideal gas or real gas methods before converting volumetric to mass flow.
For custody transfer custody or billing level accuracy do not rely solely on standard assumptions use measured density and traceable calibration.
When converting process gas volumetric numbers to mass flow consider molar mass temperature and pressure corrections and use corrected standard conditions if required.
Bulk Mass Flow Conversion Tool with CSV Export and Comparison Table
Bulk processing removes repetitive work when you have many flow values to convert. Paste comma separated or newline separated numbers in bulk mode select the from unit and the to unit then convert and export CSV. Engineers value this for datasheet review and for preparing spreadsheets used in simulation and reporting.
Comparison table mode creates a quick side by side view showing an input value across common engineering units. This is useful when you need a quick spec sheet for an instrument or to show different stakeholders values in their preferred units.
Precision control allows you to select decimal places depending on the task. Two decimal places may be sufficient for a quick field check while six or more digits are used for simulation and calibration planning.
CSV export is available for single bulk and comparison outputs so you can import results into documentation software spreadsheets and test reports.
Accuracy Considerations in Volumetric to Mass Flow Conversion
For volumetric to mass conversion density is the key variable. If the fluid or gas temperature pressure or composition differs from the assumption you must supply corrected density.
Compressible flow effects do not change the mathematical conversion between volume and mass but they change density. For high pressure gas systems calculate actual gas density at operating conditions before converting.
Rounding and precision choices matter for reporting. Record the precision used and include units on all reports and datasheets so readers can reproduce calculations.
The tool exposes formulas and numeric factors so you can audit results. For regulatory custody transfer or billing use site specific procedures and traceable calibration data.
How to Use the Mass Flow Rate Converter in Real Project Work
Suggested workflows
Datasheet checks use comparison table mode to present one test flow across the units that appear on instrument datasheets and in control system displays.
Instrument calibration use single value mode to verify zero and span set points then record results and export CSV to include in calibration reports.
Compressor specification convert required mass flow to volumetric inlet conditions using corrected density so compressor curves and power calculations use consistent mass flow input.
Control valve sizing cross check convert meter station readings from SCFM or Nm cubed per hour to kg per second then to the mass flow units used by the sizing software.
Include the conversion formula and the density assumptions in project documentation so results remain reproducible.
Frequently Asked Questions About Mass Flow Rate Conversion
How to Convert Mass Flow Rate
Convert mass flow rate by multiplying the input value by the appropriate unit conversion factor. In engineering tools, this is typically done using a base unit such as kilogram per second for consistent results.
How to Calculate Mass Flow Rate from Volumetric Flow
Mass flow rate is calculated by multiplying density by volumetric flow rate. Mass flow equals density multiplied by volumetric flow when fluid density is known.
Multiply velocity in meter per second by the pipe cross sectional area to get cubic meter per second. Then multiply the result by 3600 to convert cubic meter per second to cubic meter per hour.
How to Convert CFM to Kg Per Second
First convert cubic feet per minute to cubic meter per minute using 1 cubic foot equals 0.0283168 cubic meter. Then multiply by air density and divide by 60 to obtain kilogram per second.
What Is 1 CFM Equal To in Kg Per Second
One CFM equals 0.0283168 cubic meter per minute. At standard air density, it equals approximately 0.000578 kilogram per second.
How Many Kilograms are in One Cubic Foot
One cubic foot equals 0.0283168 cubic meter. For water at 1000 kilogram per cubic meter density, 1 cubic foot equals about 28.3168 kilogram.
This professional quiz teaches EPC instrumentation design engineers and lead designers how to choose the best flow measurement technologies for tough projects in the process industry. Scenarios cover differential-pressure, Coriolis, magnetic, ultrasonic, turbine, vortex, thermal mass, variable area, and insertion meters, plus flow conditioning, turndown, accuracy, pressure drop, materials, hazardous-area protection, signal conditioning, diagnostics, commissioning, and cost versus performance. Questions are scenario-based with realistic constraints, including at least six calculations. Use this to train your staff, do technical interviews, or do pre-issuance design reviews to check their practical selection abilities and point out typical faults in specifications. Answers explain reasoning and calculation steps.
Real-World Flow Measurement Scenarios for Process Plants
This quiz helps EPC instrumentation engineers select the correct flowmeter by evaluating accuracy, turndown, installation constraints, and custody-transfer requirements using real project scenarios.
What is IEC 60079-14 and Why it is Critical For Hazardous Area Instrumentation
Overview of IEC 60079-14 for Process Industries
Process industries such as oil and gas refineries petrochemical complexes chemical plants fertilizer units and pharmaceutical facilities rely heavily on instrumentation and control systems to maintain safe and efficient operation.
These facilities frequently handle flammable gases vapors and combustible dusts which create hazardous atmospheres where even a small electrical spark or hot surface can trigger an explosion.
Difference Between Equipment Certification and Installation Compliance
Instrumentation devices such as pressure transmitters temperature sensors flow meters gas analyzers control valves and field junction boxes are often installed directly in these hazardous zones. If these devices or their associated wiring are improperly installed they can become unintended ignition sources.
IEC 60079-14 is the international standard that defines how electrical installations must be carried out in hazardous areas.
For instrumentation and control engineers this standard is not merely a regulatory requirement but a practical engineering guide that influences daily decisions related to instrument selection cable routing earthing enclosure selection and commissioning procedures.
This article explains IEC 60079-14 from the perspective of instrumentation and control engineering in process industries focusing on field installations control system integration and long term operational reliability.
Scope Of IEC 60079-14 In Oil, Gas and Chemical Process Plants
Electrical Installations Covered Under IEC 60079-14
IEC 60079-14 specifies requirements for the selection and installation of electrical equipment in areas where explosive atmospheres may be present. The standard ensures that equipment certified for hazardous areas continues to remain safe after installation.
For instrumentation and control systems the scope includes field instruments analytical systems solenoid valves positioners remote I O panels marshalling cabinets instrument power supplies and associated cabling and earthing systems.
What IEC 60079-14 Does Not Cover
The standard covers the complete installation lifecycle including design selection erection and initial inspection.
It does not cover maintenance activities which are addressed by other standards but it establishes the baseline condition that maintenance teams must preserve.
Relationship With Instrument Certification And Design Standards
Instrumentation equipment installed in hazardous areas is certified according to specific protection techniques. These certifications define constructional requirements and testing methods to ensure the equipment cannot ignite an explosive atmosphere.
IEC 60079-14 complements these certifications by defining how certified equipment must be installed so that its protection method remains effective. If the cable entry are wrong or the earthing is done wrong, even a completely approved transmitter can become dangerous.
Instrumentation engineers must comprehend both equipment labelling and installation specifications to guarantee the overall safety of the system.
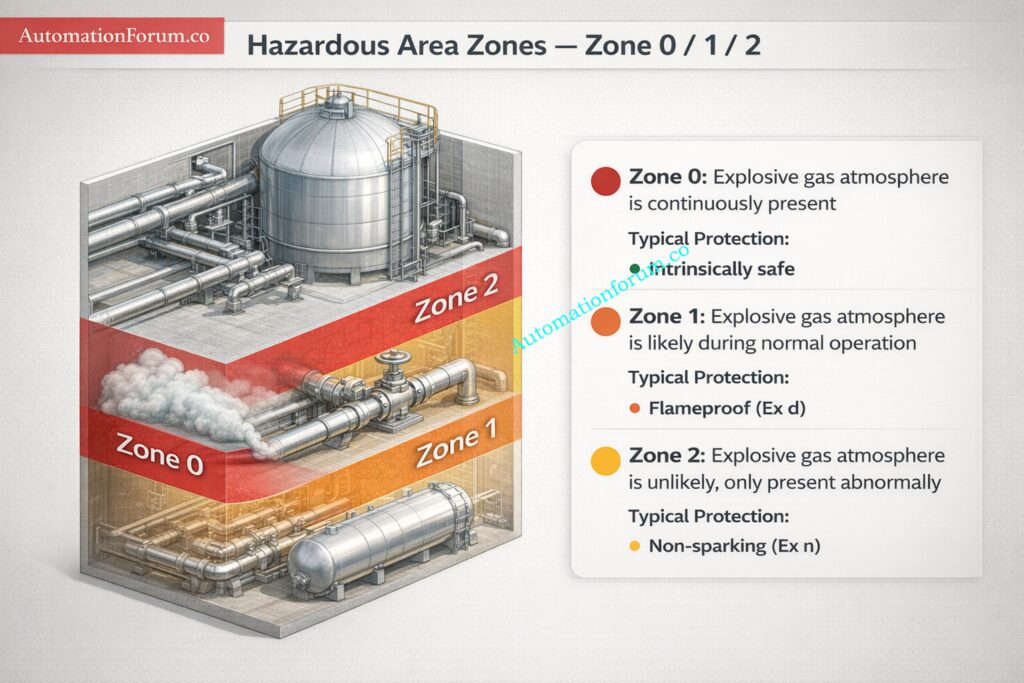
Hazardous Area Classification: Zone 0, Zone 1 And Zone 2 Explained
Hazardous area categorisation sorts plant locations into zones based on how likely it is that there will be explosive atmospheres.
Zone 0 is where explosive atmospheres are always or for lengthy periods of time.
Zone 1 represents areas where explosive atmospheres are likely during normal operation. Zone 2 represents areas where explosive atmospheres occur infrequently and for short durations.
How Zone Classification Impacts Transmitter And Analyzer Selection
The zone classification directly determines what type of instrumentation can be installed. For example intrinsically safe instruments are commonly used in zone 0 and zone 1 while non sparking equipment may be acceptable in zone 2.
Instrumentation engineers must always verify zone classification drawings before finalizing instrument specifications or installation plans.
Explosion Protection Techniques Used In Instrumentation
Intrinsic Safety Installation Requirements
Several explosion protection techniques are used in instrumentation systems.
Intrinsic safety limits electrical energy so that ignition is impossible even under fault conditions. This method is widely used for transmitters sensors and communication loops.
Flameproof Enclosure Installation Requirements
Flameproof protection allows an internal explosion to occur but prevents flame propagation to the surrounding atmosphere. This method is common for solenoid valves analyzers and certain types of transmitters.
Increased Safety Equipment In Junction Boxes
Increased safety prevents arcs sparks and excessive temperatures during normal operation and is often applied to junction boxes and terminal enclosures.
Non Sparking Equipment In Zone 2 Areas
Non sparking protection is typically used in zone 2 applications where explosive atmospheres are rare.
IEC 60079-14 ensures that the chosen protection technique is installed correctly and not compromised during field installation.
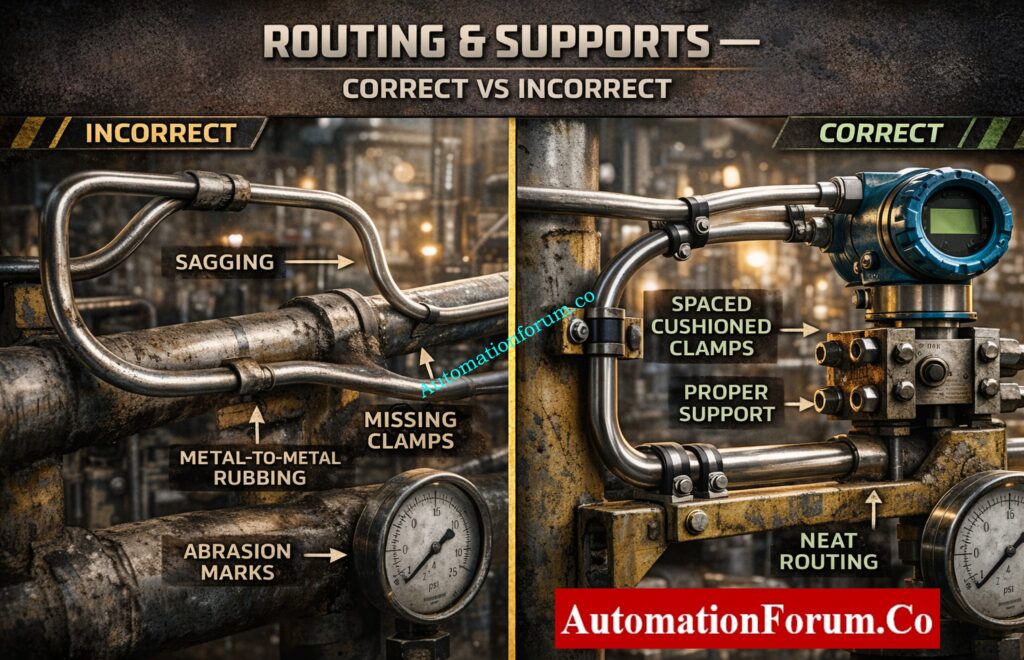
Instrument cabling plays a critical role in hazardous area safety. IEC 60079-14 defines requirements for cable type routing mechanical protection and termination practices.
Cables need to be able to handle the temperature, chemical exposure, and mechanical stress of the environment. Routing should keep damage to a minimum and keep vibration and heat exposure to a minimum.
To stop electromagnetic interference and lower the chance of fault propagation, instrument cables must also be kept separate from power connections.
Poor cabling practices can lead to signal instability false alarms and non compliance with hazardous area requirements.
Refer the below link for the 30+ International Standards for Control Systems: The Complete Guide for Automation & Instrumentation Engineer
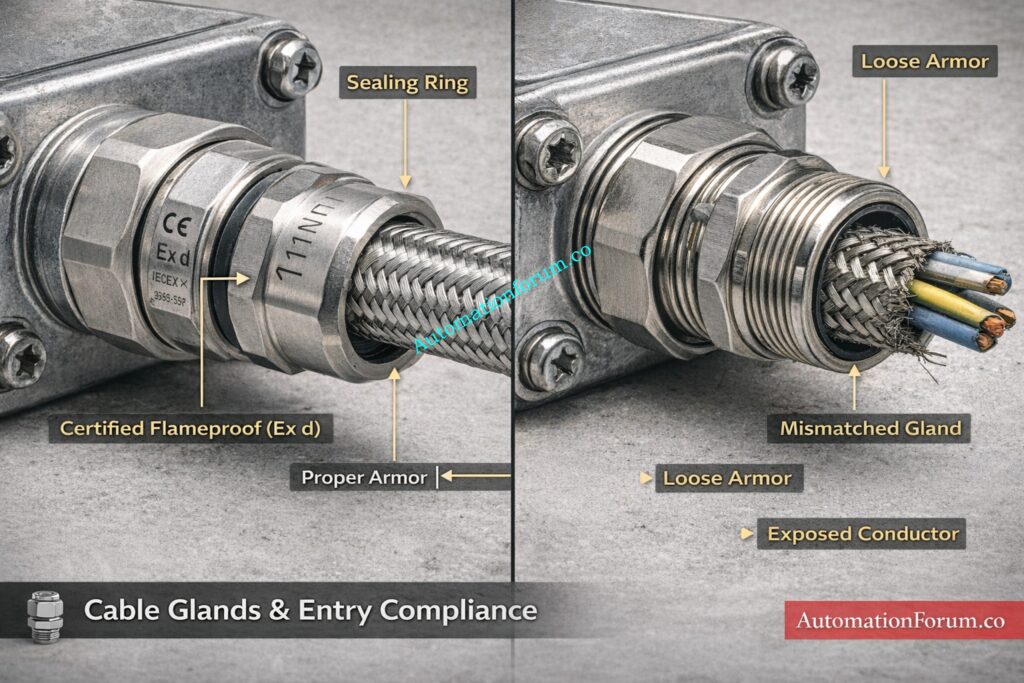
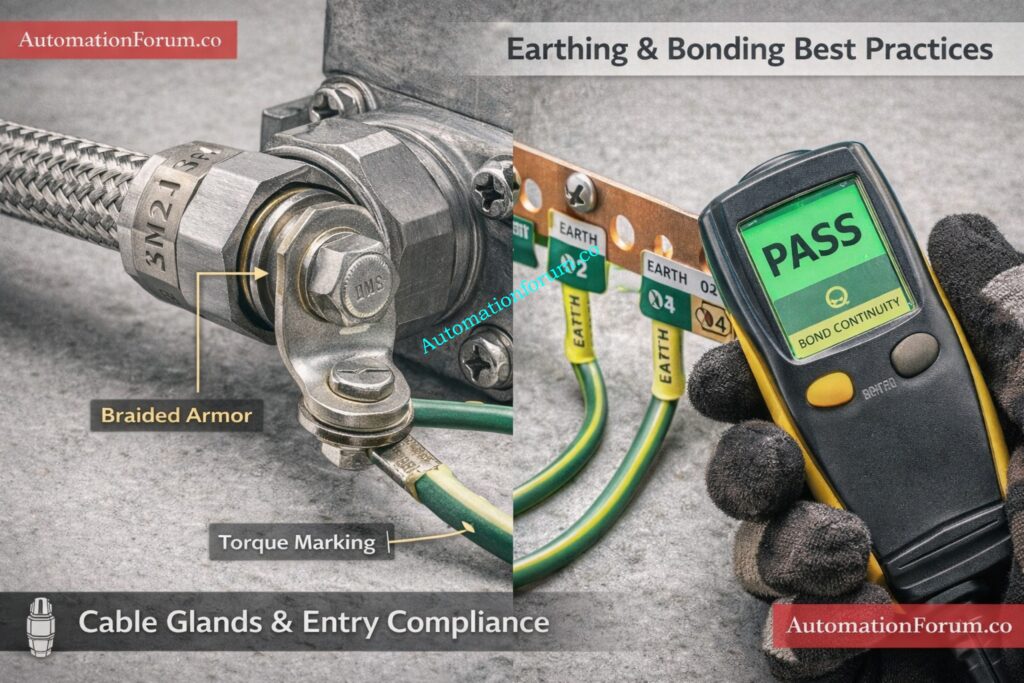
Cable glands are one of the most common sources of non compliance in hazardous area installations. The standard places strong emphasis on correct gland selection and installation.
Cable glands must be compatible with the cable construction and the enclosure protection method. Improper gland installation can create a flame path or reduce ingress protection.
Unused enclosure entries must be sealed with certified stopping plugs. Temporary or improvised sealing methods are not acceptable.
During commissioning, instrumentation personnel need to make sure that the installation of glands is checked and recorded.
Earthing and Bonding Requirements for Hazardous Area Instrumentation
Earthing and bonding stop static charge from building up and harmful potential differences from forming between conducting parts.
IEC 60079-14 requires that all exposed metallic parts of instrumentation systems are bonded to a common earthing network. This includes instrument bodies cable armours and junction boxes.
For intrinsically safe systems earthing is particularly critical because it forms part of the safety concept. Improper earthing can invalidate intrinsic safety calculations.
Good earthing practices also improve measurement accuracy and reduce noise in control signals.
Barriers or galvanic isolators must be put in place and in the right panels according to the manufacturer’s specifications. The wire in the field must provide the same level of protection all the way around the loop.
Documentation and Loop Identification Requirements
IEC 60079-14 requires clear and accurate documentation for instrumentation and control systems, although this standard is commonly overlooked. Proper documentation makes sure that the explosion protection idea used during design stays in place during installation, commissioning, operation, and any changes that need to be made in the future.
Each instrument loop installed in a hazardous area must be clearly identified with reference to its protection technique zone classification and temperature class. Intrinsically safe loops require distinct identification so that maintenance personnel can immediately recognize circuits that are permitted for live working and those that are not.
Loop drawings termination schedules cable routing layouts and earthing diagrams must reflect the as installed condition rather than design intent alone. Any deviation during construction must be updated in the final documentation package.
Identification tags on field instruments junction boxes and marshalling terminals must remain legible throughout the equipment life. Temporary markings or handwritten labels are not acceptable for hazardous area installations.
Proper documentation reduces the risk of incorrect modifications prevents accidental interconnection of incompatible circuits and supports faster fault diagnosis. During audits and inspections documentation provides evidence that the installation complies with IEC 60079-14 and that hazardous area integrity has been maintained.
Well managed documentation is therefore an essential safety barrier and an operational asset in process industry instrumentation systems.
Instrument Enclosures and Field Mounting Best Practices
Enclosures must be selected and installed so that their protection method remains intact throughout the equipment life cycle.
Flameproof enclosures must not be modified and all cable entries must use certified accessories. Increased safety enclosures must maintain ingress protection ratings.
Instrument mounting must consider vibration thermal expansion and accessibility for maintenance while preserving hazardous area compliance.
Temperature Class Selection and Surface Temperature Control
The maximum surface temperature of instrumentation must remain below the ignition temperature of the surrounding atmosphere.
Process instruments can be heated by ambient conditions solar radiation or process media. IEC 60079-14 requires assessment of these factors during installation.
Proper mounting insulation and ventilation may be required to ensure compliance with the temperature class marking.
Good Installation Practices For Control System Reliability
Good installation methods for dangerous areas also make control systems work better.
Proper cable routing, separation, and termination lower noise and false alarms in signals. Proper sealing prevents moisture ingress which can cause corrosion and drift.
Instrumentation installed according to IEC 60079-14 is generally more reliable easier to maintain and less prone to unexpected failures.
Competency Requirements for Hazardous Area Installation Personnel
People who inspect and set up dangerous areas must know what they’re doing.
Competence is knowing how to prevent against explosions, how to designate equipment, how to install it, and what the inspection criteria are.
Process facilities need to make sure that the people who work on instrumentation teams have the right training and expertise to do hazardous area work safely.
Practical Example: Pressure Transmitter Installation In a Zone 1 Hazardous Area
Think about a pressure transmitter that is set up on a hydrocarbon process line in an area that is classed as zone 1.
Step By Step Installation Process
The line runs at a high temperature and the process fluid can catch fire. The area classification drawing identifies the location as zone 1.
The instrumentation engineer choose a pressure transmitter that is fundamentally safe, has the right temperature class, and protects equipment for zone 1.
Intrinsic Safety Barrier Integration In Control Room
There is an intrinsically safe barrier in the control room’s marshalling panel. The cabling for the instrument loop goes through separate cable trays to keep it separate from the power circuits.
A certified cable gland that is safe for intrinsic safety is chosen and put in the right place at the transmitter enclosure. The cable armour is attached to the junction box and linked to the plant’s earthing network.
The transmitter is mounted with sufficient clearance from hot surfaces to ensure its surface temperature remains within limits.
During commissioning the loop is tested for continuity insulation resistance and barrier function.
Testing And Documentation Verification
The intrinsic safety documentation including loop drawings and inspection records is completed and approved.
This example demonstrates how IEC 60079-14 influences every step from equipment selection to installation and commissioning.
Integration of IEC 60079-14 With Control System Architecture
The configuration of control system parts including marshalling cabinets, remote I/O panels, and intrinsic safety barriers is affected by hazardous area standards.
Correct integration keeps circuits separate, makes maintenance easier, and makes sure that installation regulations are followed.
Ensuring Safe and Compliant Hazardous Area Instrumentation Installations
IEC 60079-14 is a fundamental standard for instrumentation and control engineers working in hazardous process environments. It defines how safety is achieved not only through equipment selection but through disciplined installation practices.
By applying the requirements of IEC 60079-14 instrumentation teams can ensure safe reliable and compliant systems that protect personnel assets and production continuity throughout the plant lifecycle.
IEC 60079 Part 14 2013 is the international standard that defines the selection and installation requirements for electrical equipment in explosive atmospheres.
It ensures hazardous area instruments and wiring are installed safely without compromising explosion protection.
What is the annex C of IEC 60079 14?
Annexe C gives more information on how to check and inspect installations in dangerous areas.
It helps engineers make sure that the wiring and equipment they install meet the requirements for explosion protection.
What is DIN 60079 14 2014?
DIN 60079 14 2014 is Germany’s version of IEC 60079 14. It makes sure that national installation guidelines are in line with international hazardous area standards.
It applies the same explosion protection installation principles within Germany and European industrial facilities.
What is the IEC standard for cable glands?
Cable glands used in hazardous areas must comply with IEC 60079 0 and relevant protection specific standards within the IEC 60079 series.
They must maintain enclosure integrity and prevent flame transmission in explosion protected installations.
What is the difference between IEC 60079 13 and 14?
IEC 60079 13 covers the design and construction of pressurized rooms or protective enclosures in hazardous areas.
IEC 60079 14 focuses on the selection and installation of electrical equipment and wiring in explosive atmospheres.
What Is Impulse Line Inspection and Why It Is Critical for DP Transmitters
This procedure defines a detailed step by step method for routine running inspection of impulse lines and process connections associated with differential pressure pressure and flow transmitters. The objective is to ensure accurate measurement fast dynamic response and reliable control performance by preventing false readings caused by blocked impulse lines condensate accumulation trapped air leakage vibration improper routing and incorrect valve positioning. This procedure is intended for use by instrumentation techniciansmaintenance engineers and supervisors during normal plant operation.
Scope of Impulse Line Inspection in Process Industries
This procedure applies to all impulse lines connected to differential pressure pressure and flow transmitters installed in gas liquid steam and multiphase services. The procedure is applicable during routine rounds normal operation and condition based maintenance activities. It does not replace shutdown maintenance or major modification procedures.
Real Field Case Study: Sluggish DP Transmitter Caused by Condensate
Case explanation and step by step actions
Initial Symptom And First Observations
Technician observed sluggish transmitter response immediately following a commanded or measured flow increase. The DCS trend showed a slow ramp instead of the expected quick step up and settle. No alarms for hardware failure were present. Visual inspection of the impulse line and manifold showed no visible leaks or damaged fittings.
Simple Tactile Temperature Check And What It Revealed
Technician performed a gloved touch check and found a markedly cold section at a low elbow in the high pressure impulse line run. The cold spot was localized and colder than adjacent tubing. This is a classic sign of condensate pooling in steam heated circuits or a failed heat trace at that low point. The cold pocket suggests liquid accumulation that will change the effective fluid column in the impulse line.
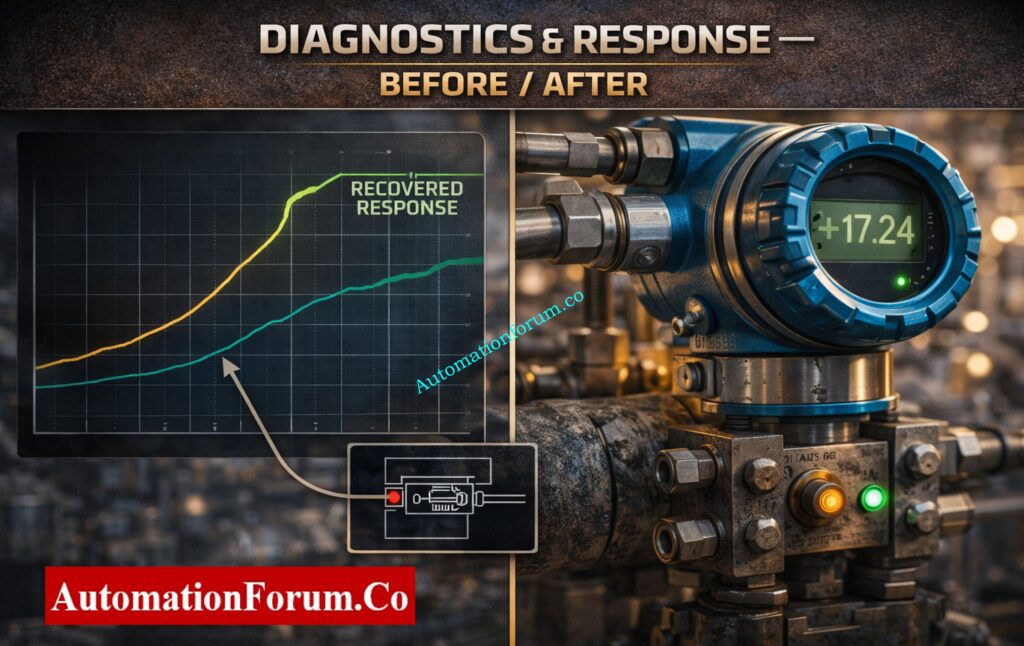
Why Condensate Causes Sluggish Response And Bias
Condensate in the impulse line adds a trapped liquid volume that dampens pressure fluctuation and changes the static head seen by the transmitter. On a flow step the pressure change is transmitted more slowly through the liquid filled pocket and any compressible vapor spaces. That produces a slow rise on the transmitter output and a reduced fluctuation amplitude. If condensate sits on the high pressure side it biases the differential reading low until bled.
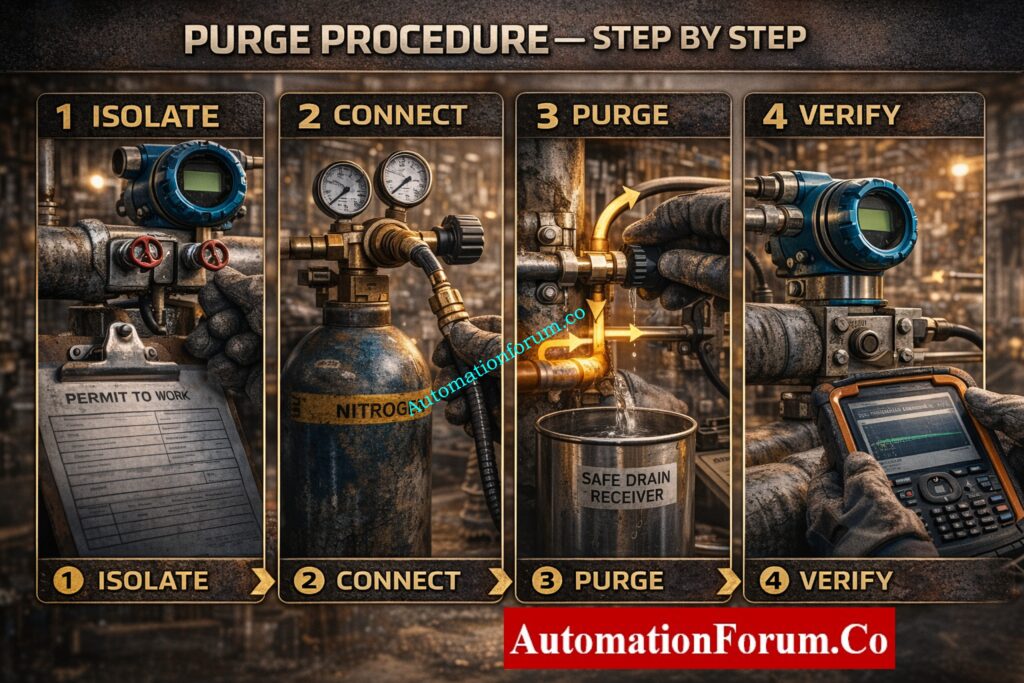
Technician obtained the required permit and confirmed isolation and safe discharge routing. Personal protective equipment was worn and an approved container positioned. The drain location and receiving point were verified with operations to prevent process contamination or unsafe disposal.
Controlled Drainage Procedure And Observations During Drain
Technician slowly opened the drain valve while watching the transmitter trend and the drain container. A significant volume of condensate was expelled. The operator observed the transmitter output begin to move toward the expected value as the liquid cleared from the pocket. The drain was closed when steam or flow without liquid was observed.
Secondary Check That Found The Root Valve Issue
With the condensate removed the technician checked valve positions and found the high pressure root valve only partially open. A partially closed root valve restricts the path into the impulse line and reduces dynamic coupling. This can mimic a blocked line by limiting how quickly the pressure can change in the transmitter sensing line. The technician, with authorization, fully opened the valve to its correct running position.
Technician checked heat trace power and insulation integrity at the low elbow. Heat tracing was restored and insulation replaced or resealed so the low point would no longer cool enough to form condensate under normal conditions.
Verification Of Recovery and Closure Of The Corrective Action
After condensate removal valve correction and restoration of heat trace the technician observed the transmitter trend recover to normal dynamic behavior within a short interval, typically minutes. The control loop regained expected stability and the earlier sluggish behavior stopped. Technician recorded the volume drained the condition found and the steps taken.
Documentation Actions And Recommended Permanent Fixes
The event was logged in the CMMS with photos time stamps and the volume drained. A work order was raised to improve drain accessibility and to install a permanent drip leg or larger drain valve where needed. Recommendations included verifying heat trace routing on that run, adding a test or purge port and training operations on signs that indicate condensate accumulation.
Key Lessons And Preventive Measures
Regular touch or thermal checks at low points catch condensate early.
Always verify valve positions since partially closed root valves can mask as blocked lines.
Make drain points accessible and sized for the expected condensate volume.
Restore heat tracing and insulation promptly to avoid repeat pooling.
Tools And Approximate Timings Used In The Scenario
Tools used: infrared thermometer or thermal camera if available, gloved touch, approved drain container, basic hand tools to operate valves, permit paperwork and CMMS device for logging.
Typical timing: obtaining permit and setup 10 to 20 minutes. Drain and observation 5 to 15 minutes. Valve correction and heat trace restoration variable but often 30 to 60 minutes if parts or electrician support are required. Recovery of transmitter dynamic response usually occurs within minutes of clearing the condensate and correcting valve position.
Suggested Brief Log Entry Format To Paste Into Cmms
Date time technician name transmitter tag symptom sluggish response after flow increase initial check no leak thermal cold spot at low elbow action obtained permit drained condensate approx volume 200 mL corrected high pressure root valve to full open restored heat trace closed drain verified transmitter recovered recommended actions improve drain access add test port verify heat trace redundancy work order number
Acceptance Criteria for a Healthy Impulse Line System
Impulse lines shall be leak free properly supported and free from mechanical damage.
Condensate and trapped air shall not be present during normal operation.
Root valves shall be fully open and equalizing valves closed.
Heat tracing and insulation shall maintain stable impulse line temperature.
Transmitter response shall be fast stable and consistent with process behavior.
Completion and Handover
Confirm all valves drains and bleeds are returned to normal operating condition.
Ensure permits are closed and isolations removed.
Inform operations that inspection is complete.
Monitor transmitter performance during subsequent operation.
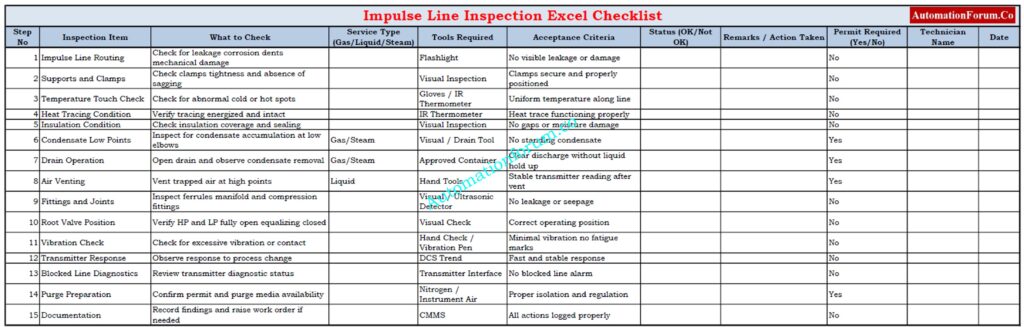
Impulse Line Inspection Checklist for Routine Rounds
This Excel checklist is meant to help with regular impulse line inspections for DP pressure and flow transmitters. It helps technicians keep track of what they find, make sure they follow SOP rules, and keep measurements reliable.
You may get the full checklist here and utilise it:
How Regular Impulse Line Inspection Prevents False DP Readings
Following this step-by-step impulse line inspection approach very closely cuts down on false DP readings, sluggish response times, and unanticipated process problems. Adding this SOP to regular rounds makes ensuring that the instruments work properly, makes things safer, and cuts down on unscheduled maintenance.
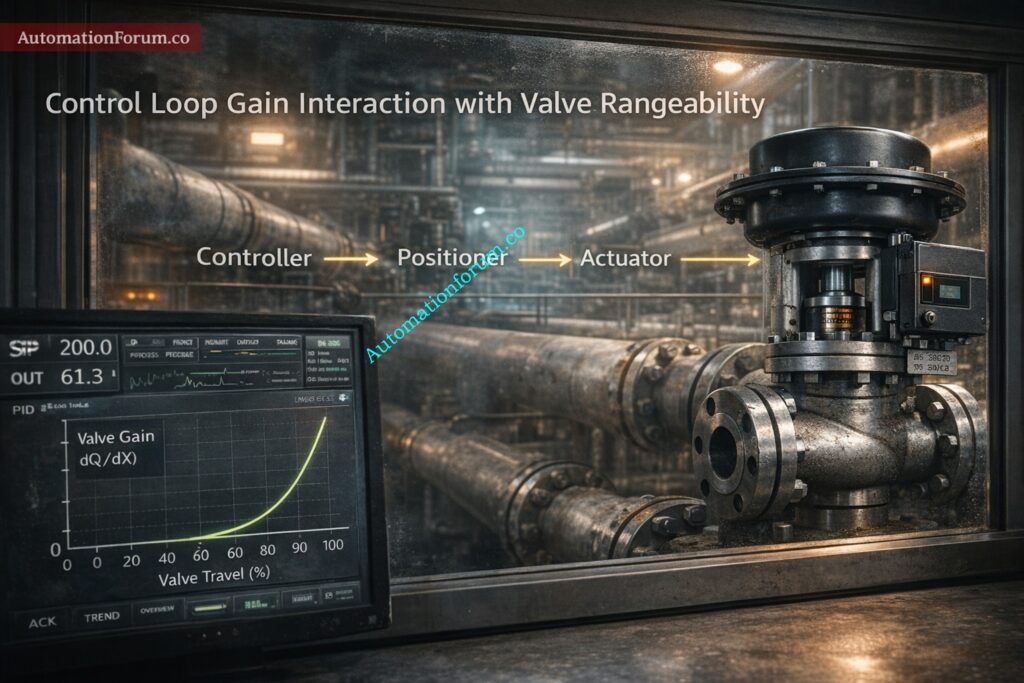
Understanding rangeability vs turndown ratio is critical for proper control valve selection. Although these terms are often used interchangeably, they define different performance characteristics that directly impact control stability, maintenance cost and process safety.
Why This Distinction Matters for Instrumentation Engineers
In control valveengineering the terms rangeability vs turndown ratio are often confused. That confusion leads to oversized valves unstable control loops poor controllability at low flow and higher maintenance cost. This article explains precise technical definitions how manufacturers report each metric and why each matters when selecting valve body trim actuator and positioner. The content is written for experienced instrumentation and control engineers who need practical guidance for sizing procurement and troubleshooting.
You will find formulas a digit by digit worked example checklists you can copy into specifications and clear rules for avoiding common design mistakes. All calculations are shown using SI units with notes on imperial conversion where relevant. The objective is to provide engineering clarity so the selected valve not only passes the required flow but also controls it accurately across the full operating range. Additional emphasis is placed on verification testing and commissioning validation to ensure theoretical performance matches field performance.
Definitions: Rangeability vs Turndown Ratio in Control Valve Selection
What Is Turndown Ratio (Definition & Formula)
Turndown ratio is a sizing parameter that defines the ratio between the maximum controllable flow and the minimum controllable flow of a control valve.
Turndown ratio = Qmax ÷ Qmin
If a valve must control from 1.0 cubic meter per hour to 20.0 cubic meters per hour then:
20.0 ÷ 1.0 = 20
Required turndown = 20 to 1
Turndown focuses strictly on flow span and capacity. It answers whether the valve can physically handle both extremes of required process flow under acceptable pressure drop conditions.
What Is Rangeability (Controllability vs Capacity)
Rangeability describes how well a valve maintains a predictable proportional relationship between valve travel and flow across its stroke. It reflects controllability not just capacity. Rangeability depends on trim design leakage class stem friction actuator stiffness and positioner resolution.
How Manufacturers Report Each Metric
Manufacturers usually publish turndown as a ratio derived from Cv or Kv testing. Rangeability is often published for the trim assembly and may assume specific actuator and positioner conditions. A valve can meet turndown requirements but still fail to provide stable control if rangeability is inadequate.
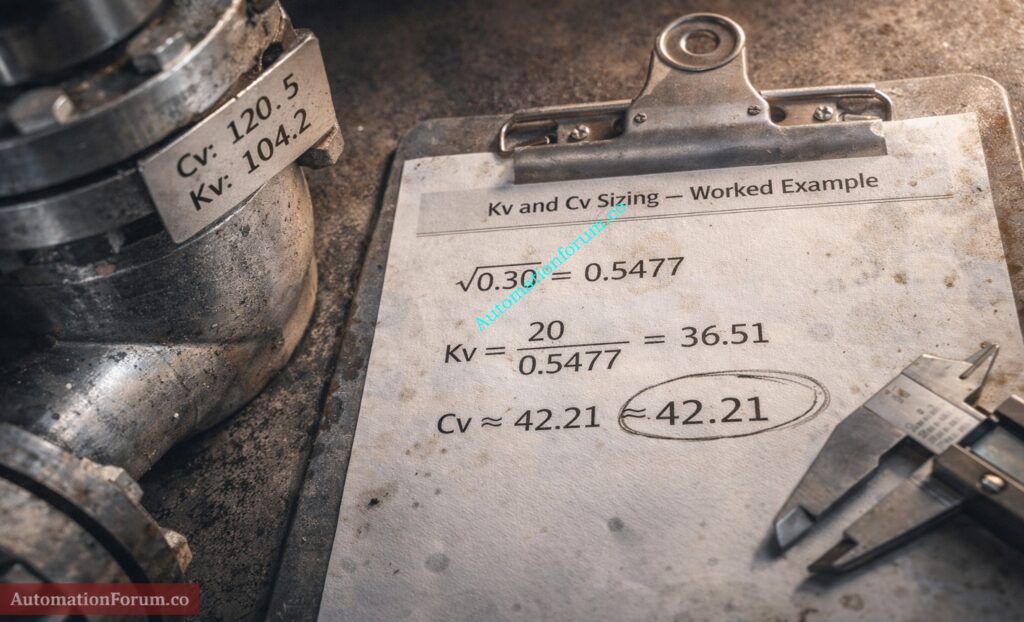
For liquids Q m3 per hour = Kv × sqrt DeltaP bar Cv ≈ Kv ÷ 0.865
When to Use Kv vs Cv (SI vs Imperial notes)
Turndown defines the required span. Rangeability defines how effectively that span can be controlled. For procurement always specify both values and define the conditions under which rangeability is validated.
This valve must provide Kv approximately 36.5 at full opening while still delivering stable controllability at 1.0 m3 per hour. Verification of low travel flow data is essential to confirm rangeability performance.
Installed Vs Inherent Valve Characteristics And Their Impact On Rangeability
In control valveengineering the published rangeability value usually represents the inherent characteristic of the valve. However actual field performance depends on the installed characteristic which includes piping resistance pump curves and system pressure variations. Failure to evaluate installed behavior is one of the most common causes of low flow instability.
The inherent characteristic describes the relationship between valve travel and flow when the pressure drop across the valve remains constant. Laboratory Cv testing is performed under these controlled conditions.
In real systems the pressure drop across the valve does not remain constant. As flow increases friction losses in piping increase and available valve pressure drop decreases. This modifies the effective valve gain and alters controllability.
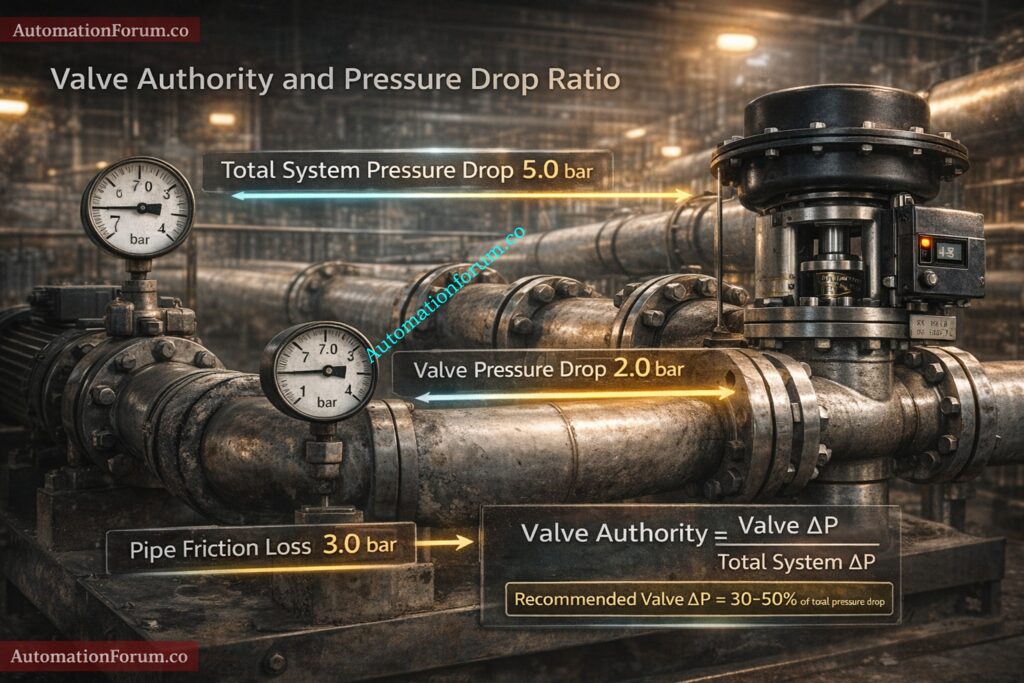
If the valve only consumes 10 to 20 percent of total system pressure drop at design flow the installed characteristic may become highly nonlinear at low travel.
Why Pressure Drop Ratio Changes Effective Rangeability
Pressure drop ratio:
Valve DeltaP ÷ Total System DeltaP
If the valve DeltaP is too small relative to system losses the valve loses authority. Effective rangeability decreases even if inherent rangeability is high.
Design rule: Valve pressure drop at normal flow should typically be 30 to 50 percent of total available pressure drop for stable control.
Ignoring installed behavior often reduces practical 50 to 1 rangeability to less than 15 to 1 in actual plant conditions.
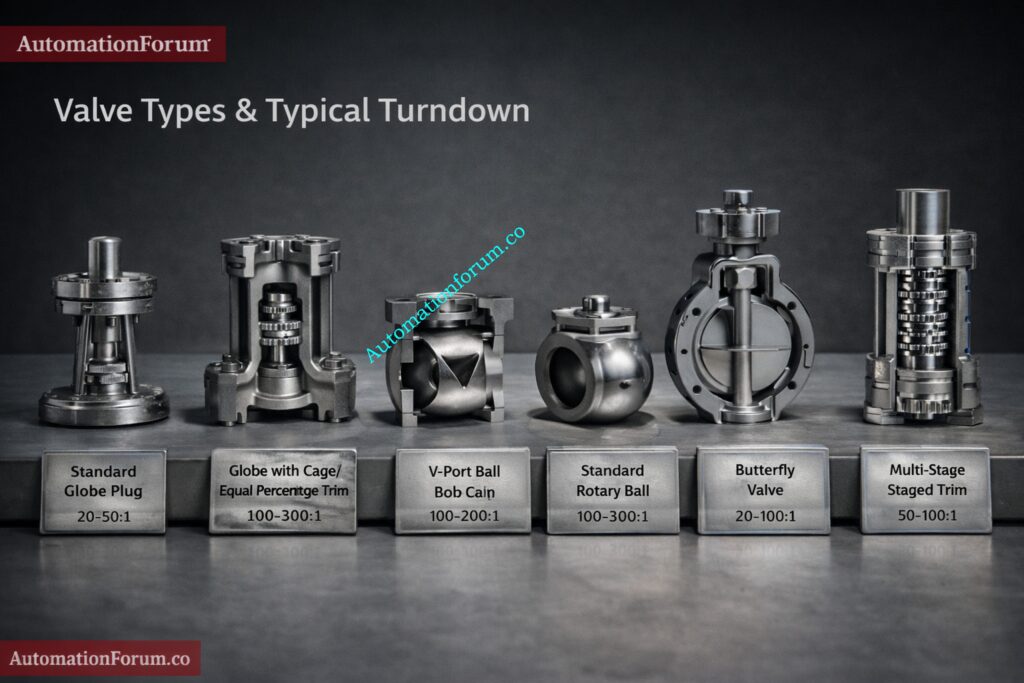
Comparison Table: Turndown Vs Rangeability Across Valve Types
The following comparison summarizes typical performance ranges under clean liquid service conditions. Actual values vary by manufacturer and trim design.
1 Define fluid properties temperature density viscosity and pressure. 2 Identify minimum and maximum flow including startup conditions. 3 Select allowable pressure drop. 4 Calculate Kv using Kv = Q ÷ sqrt DeltaP. 5 Compute turndown Qmax ÷ Qmin. 6 Add safety margin typically 20 percent. 7 Select trim with rangeability exceeding required turndown. 8 Size actuator with at least 150 percent torque margin. 9 Specify digital positioner with low deadband and high resolution. 10 Require factory performance verification.
Worked Logic Example
From the earlier example required turndown is 20 to 1. Add 20 percent margin 20 × 1.2 = 24 Specify minimum turndown 25 to 1.
Evaluation
Standard globe trim may not meet requirement.
Cage equal percentage trim with 40 to 1 turndown and high rangeability is suitable.
V port ball trim is suitable for clean liquids but erosion must be evaluated.
Actuator and positioner
Actuator must overcome maximum differential pressure plus friction with margin. Digital positioners with resolution better than 0.1 percent travel and hysteresis below 0.2 percent are strongly recommended to realize trim rangeability.
Impact on Control Loop Performance and Maintainability
Insufficient turndown forces the valve to operate near closed position where gain is unstable. This increases controller output movement wear and oscillation.
Good rangeability improves loop tuning reduces hunting and enables predictive diagnostics.
Maintenance intervals shorten when valves operate continuously at very low openings especially with erosive or cavitating fluids.
Performance can be improved by selecting better trims using valve staging upgrading positioners and applying appropriate control strategies such as split range or cascade control.
Real Field Case: Oversized Valve Causing Low Flow Instability
A refinery cooling water control valve was originally sized for 100 cubic meters per hour based on maximum pump capacity. However normal operating flow was only 15 cubic meters per hour.
The installed valve operated at approximately 5 percent travel during steady state operation. Operators reported constant oscillation and hunting despite multiple PID tuning attempts.
Investigation revealed:
Excessive Cv relative to required flow
High valve gain at low travel
Effective rangeability reduced due to poor valve authority
The valve was replaced with a smaller equal percentage cage trim sized for 40 cubic meters per hour maximum flow.
After replacement:
Operating travel went up to 35 to 45 percent.
Loop stabilized immediately
Oscillation eliminated
Actuator wear reduced significantly
This scenario shows that just achieving turndown requirements is not enough to ensure steady controllability. You need to do a proper rangeability and installed characteristic analysis.
Design Rules Summary for Rangeability vs Turndown Ratio
Turndown sets the flow span that is needed.
Rangeability tells you how much you can control within that range.
Always look at the installed characteristic, not just the intrinsic data.
Keep the valve DeltaP is between 30% and 50% of the overall system pressure drop.
Add at least 20% to the calculated turndown as a design margin.
Set the actuator torque margin to at least 150%.
Require written proof of factory Cv and functional testing
Don’t keep going if you’re less than 10% of the way there.
Following these principles ensures stable long term performance and reduced life
Practical Takeaways for Engineers
Rangeability and turndown ratio are connected, but they are not the same thing. Turndown sets the flow span that needs to be regulated, and rangeability shows how well that span can be controlled. To choose the right control valve, you need to look at the valve trim actuator and positioner as one control element. To make sure that the process works well, is stable, and lasts a long time, there must be clear requirements, enough safety margins, and proof that the factory tested it.
FAQ on Rangeability vs Turndown Ratio in Control Valve Selection
What is the difference between rangeability and turndown ratio?
The turndown ratio tells you how much flow a valve can tolerate between its highest and minimum flow.
Rangeability tells you how well and consistently the valve can control flow within that range.
What is rangeability in a control valve?
The ratio of a valve’s greatest controllable flow to its smallest stable controllable flow is called rangeability.
It shows how well the valve can keep stable, proportionate control throughout its stroke.
Why is turndown ratio important?
The turndown ratio makes sure that the valve can handle the process’s required flow range.
Too little turndown causes valves to be too big, the system to be unstable, and poor low-flow control.
How do you calculate rangeability?
To get rangeability, you divide the maximum controlled flow by the minimum controllable stable flow. Rangeability = Qmax ÷ Qmin under specified test and installation conditions.
Your Trusted Source for Automation Power Tools & Solutions
🔧 Pressure Unit Converter
Professional-grade converter with precise conversion factors • 50+ units supported
Input
🔍
🔍
Result
Conversion Steps▼
📜 Conversion History (Last 10)▼
No conversions yet
ℹ️ How It Works & Usage Guide▼
Conversion Methodology
All conversions use Pascal (Pa) as the canonical intermediate unit. The conversion path is:
Input Value × (From Unit → Pa Factor) → Pa Value → Pa Value × (Pa → To Unit Factor) → Result
All conversion factors comply with ISO 80000-4 (Quantities and units – Part 4: Mechanics) and NIST SP 811 standards.
Standards & References
SI Units: International System of Units (SI) – BIPM standards
PSI/Imperial: ASME Y14.38 & ISO 1000 conversion factors
Standard Atmosphere: 101,325 Pa (ISO 2533, ICAO standard)
Technical Units: Based on standard gravity (9.80665 m/s²)
Temperature-Dependent Units
Some units have temperature specifications:
Mercury columns: inHg (32°F / 0°C) vs inHg (60°F / 15.6°C), cmHg & mmHg at 0°C
Water columns: inAq & ftAq at both 4°C (max density) and 60°F (15.6°C)
These use standardized density values from NIST and ISO fluid property tables.
Usage Tips
Scientific notation is supported (e.g., 1.5e6 or 1.5E6)
Use the search box to quickly find units (type “psi”, “bar”, etc.)
Enable “Show conversion steps” to see the intermediate Pascal value
Bulk mode supports newline or comma-separated values
Results are automatically saved to history (stored locally)
Keyboard Shortcuts
Enter in any input field triggers conversion
Tab to navigate between fields
Type in unit dropdowns to filter results instantly
📚 Standards & Technical References▼
International Standards Compliance
This converter adheres to internationally recognized standards and metrology guidelines:
🌍 SI Base Standards
ISO 80000-4:2019 – Quantities and units — Part 4: Mechanics
BIPM SI Brochure (9th Ed.) – The International System of Units
Pascal (Pa): SI derived unit = 1 N/m² = 1 kg/(m·s²)
🇺🇸 US Standards (NIST)
NIST SP 811 – Guide for the Use of the International System of Units
NIST SP 330 – The International System of Units (SI)
Standard PSI: 1 psi = 6,894.757293168 Pa (exact)
Standard Atmosphere: 1 atm = 101,325 Pa (exact, ISO 2533)
🔧 Engineering Standards
ISO 1000:1992 – SI units and recommendations
ASME Y14.38 – Abbreviations and Acronyms for Use on Drawings
ICAO Standard Atmosphere – Aviation pressure reference (101,325 Pa at MSL)
Bar: 1 bar = 100,000 Pa = 10⁵ Pa (metric system)
Torr: 1 Torr = 133.322368421… Pa (1/760 of standard atm)
🌡️ Temperature-Specific Conversions
Mercury Density (0°C): 13,595.1 kg/m³ (NIST fluid tables)
Water Density (4°C): 999.972 kg/m³ (maximum density point)
Water Density (60°F): 999.001 kg/m³ (15.556°C)
Standard Gravity: gₙ = 9.80665 m/s² (exact, ISO 80000-3)
✅ Key Exact Conversions (Standards-Based)
Unit
Pascal Equivalent
Standard
1 atm
101,325 Pa
ISO 2533
1 bar
100,000 Pa
ISO 1000
1 psi
6,894.757293168 Pa
NIST SP 811
1 Torr
133.3223684211 Pa
ISO 80000-4
1 kgf/cm²
98,066.5 Pa
Technical atm
1 inHg (32°F)
3,386.38 Pa
NIST tables
📌 Note on Precision:
All conversions maintain up to 15 significant figures of precision. For critical applications requiring traceable measurements, consult your national metrology institute (e.g., NIST, NPL, PTB) for calibration standards.
⚙️ AUTOMATIONFORUM.CO
Your Trusted Source for Automation Power Tools & Solutions
The Pressure Unit Converter is a high-quality engineering calculator that can accurately convert pressure between different units in industrial, laboratory, and calibration settings. It can handle more than 50 different pressure units and follows well-known worldwide standards as ISO 80000 4, NIST SP 811, ISO 2533 Standard Atmosphere, and BIPM’s SI unit definitions. This isn’t a simple internet converter. It was made just for instrumentation engineers, calibration technicians, process engineers, mechanical engineers, HVAC professionals, and automation specialists that need results that can be traced and are accurate.
What is a Pressure Unit Converter and Why it is Critical for Engineers
One of the most important process factors in industrial automation is pressure. It’s important to convert pressure units correctly whether you establish alarm limits in a DCS, configure a transmitter, scale a PLC analogue input, or make a calibration certificate. Even slight rounding mistakes can cause systems to be incorrectly scaled, documents to be deceptive, or safety issues in important systems. This professional pressure calculator gets rid of these hazards by utilising Pascal as the standard unit of measurement and conversion factors that follow standards.
Why a Professional Pressure Unit Converter is Necessary
In real-world engineering, pressure levels are given in different units depending on where you are, what the industry norms are, and what the manufacturer says. For instance:
Bar and kilopascal are two units of measurement that are used a lot throughout Europe.
A lot of people in the US use psi
Pascal and Torr are typically used in scientific labs, and inches of water column are often used in HVAC systems.
Aviation uses the normal environment as a guide.
Calibration labs employ mmHg and kgf/cm².
Engineers might have to use rounded estimates if they don’t have a dependable pressure conversion calculator that is based on standards. These approximations can cause inaccuracies to build up in calculations about:
Flow measurement
Density compensation
Differential pressure transmitters
Control valve sizing
Boiler pressure calculations
Hydraulic system design
A competent pressure unit converter makes sure that the results are always the same and can be traced back, which is important for documentation, audits, and compliance.
How the Pressure Unit Converter Works Using Pascal as the Base Unit
This calculator utilises an approach that is both technically sound and mathematically stable. The SI derived unit of pressure, Pascal, is used as a reference for all pressure units.
One Pascal is the same as one Newton per square metre.
There are two steps to the conversion process:
Step 1 The value in Pascal is equal to the input value times the From Unit conversion factor.
Step 2 The final answer is the value in Pascal divided by the To Unit conversion factor.
The calculator doesn’t make chained conversion mistakes because it uses Pascal as the standard base unit. This method makes sure that everything is correct, consistent, and easy to add more units in the future.
The calculator can handle more than 50 different pressure units from different groups.
SI Pressure Units
Pascal, kilopascal, megapascal, gigapascal, hectopascal, millipascal, micropascal, nanopascal, picopascal, femtopascal, and attopascal are all units of pressure.
These units are commonly employed in scientific research, laboratory settings, and contemporary industrial instrumentation.
Metric Pressure Units
Bar, millibar, microbar.
In European technical documents, industrial process facilities, and hydraulic systems, the word “bar” is often employed.
Imperial Pressure Units
Psi, ksi, pound force per square inch, pound force per square foot, and kip force per square inch are all examples of this.
People in the US and in mechanical design calculations use these a lot.
Atmosphere Pressure Units
The standard atmosphere and the technical atmosphere.
The standard atmosphere is 101325 Pascal, and it is often used in aviation, meteorology, and laboratory reference systems.
Mercury Based Pressure Units
Torr, millimetre mercury at 0 degrees Celsius, centimetre mercury at 0 degrees Celsius, inch mercury at 32 degrees Fahrenheit, and 60 degrees Fahrenheit.
In vacuum systems, laboratory manometers, and pressure calibration setups, these units are very significant.
Water Column Pressure Units
Millimetre water at 4 degrees Celsius, centimetre water at 4 degrees Celsius, inch water at 4 degrees Celsius, foot water at 4 degrees Celsius, inch water at 60 degrees Fahrenheit, and foot water at 60 degrees Fahrenheit.
HVAC systems, duct pressure measurement, and differential pressure applications all use water column units a lot.
Technical Force Based Pressure Units
Force in kilograms per square centimetre, grams per square centimetre, and kilograms per square metre.
People typically utilise these in older engineering drawings and some parts of the industrial sector.
CGS Pressure Units
Dyne per square centimetre.
This unit is sometimes used in scientific study and calculations.
International Standards Compliance and Traceability
This pressure unit converter is in line with accepted standards, so the results are accurate and can be traced.
ISO 80000 4 talks about mechanical quantities and units, such as pressure.
NIST SP 811 tells you how to utilise the International System of Units.
The standard atmospheric value of 101325 Pascal is set by ISO 2533.
For conversions based on force, the standard gravity of 9.80665 meters per second squared is utilised.
Using conversion factors based on standards makes sure that the results may be utilised with confidence in calibration reports, engineering documents, and places that are controlled.
A lot of the time, engineering needs very high precision. You can choose how many decimal places the calculator shows, from zero to twelve. It can also read scientific notation, like 1.5e6 or 3.2E 4.
The calculator automatically converts to exponential style for very small or very large numbers to keep them easy to read and accurate.
Single mode is meant for quick engineering maths. The user types in a number, picks the source unit, picks the target unit, changes the precision if necessary, and then clicks convert.
The unit and the outcome are both clearly shown. When this option is turned on, the steps for converting are shown, along with the intermediate Pascal value.
This is great for commissioning teams, field engineers, and maintenance workers.
Example 3 Bulk Conversion for Transmitter Calibration
Suppose a transmitter is calibrated at 0, 25, 50, 75, and 100 psi. Using bulk mode, these values can be converted to kilopascal instantly and exported to CSV for inclusion in a calibration report.
Professional Pressure Unit Conversion for Engineers
The Pressure Unit Converter is a strong engineering calculator that follows ISO and NIST standards and is made for use in real-world industrial settings. It has everything you need for professional pressure conversion, including support for more than 50 pressure units, high precision control, temperature-specific adjustments, single and bulk conversion modes, step-by-step computation transparency, and the ability to export to CSV.
This is more than just a simple converter for instrumentation engineers, calibration technicians, process engineers, and automation professionals. It is an engineering tool based on standards that was made to be accurate, compliant, operate well, and keep documentation reliable.
This pressure unit converter gives you the accuracy and traceability you need in current engineering settings if you work in industrial automation,process control, laboratory measurement, or calibration engineering.
A pressure unit converter is a professional engineering calculator used to convert pressure values between different units such as Pascal, bar, psi, kPa, atm, Torr, and mmHg. It ensures accurate and standards-based conversion using SI definitions. It is widely used in industrial automation, calibration labs, HVAC, and process engineering.
Why is an ISO and NIST compliant Pressure Unit Converter important?
An ISO and NIST compliant pressure converter follows internationally recognized unit standards and reference values. This ensures traceable, reliable, and audit-ready results for calibration and engineering documentation. It reduces errors caused by rounded or non-standard conversion factors.
How does a Pressure Unit Converter ensure high accuracy?
A professional pressure unit converter uses Pascal as the base SI unit for all calculations. It converts input values to Pascal first and then converts to the target unit to avoid chained errors. This method ensures mathematical stability and precision up to multiple decimal places.
How to convert unit of pressure?
To convert pressure units, first convert the given value into Pascal, the SI base unit of pressure. Then divide the Pascal value by the conversion factor of the target unit. Using a professional pressure unit converter eliminates rounding errors and ensures standards based accuracy.
What is 70 kg in psi?
Pressure cannot be converted directly from kilograms to psi because kilogram is a unit of mass, not pressure. If you mean 70 kilogram force per square centimeter, then 70 kgf per square centimeter equals approximately 995 psi. Always confirm whether the value refers to mass or pressure before converting.
How many psi is 2.5 pressure?
If 2.5 refers to 2.5 bar, then 2.5 bar equals approximately 36.26 psi. If it refers to 2.5 MPa, then it equals about 362.6 psi. The unit must be clearly specified before conversion.
Is 1 bar equal to 10 psi?
No, 1 bar is not exactly 10 psi. 1 bar equals approximately 14.5038 psi. The value 10 psi is only a rough approximation and should not be used in engineering calculations.
What is 40 to 60 PSI in bar?
40 psi equals approximately 2.76 bar. 60 psi equals approximately 4.14 bar. So the range 40 to 60 psi is roughly 2.76 to 4.14 bar.
What is a millibar?
A millibar is a metric unit of pressure equal to one thousandth of a bar. 1 millibar equals 100 Pascal in SI units. It is commonly used in meteorology, laboratory work, and low pressure industrial applications.
Refer the below link for theFree Instruments Calibration Procedures: 60+ Step-by-Step Methods for Pressure, Temperature, Flow & Level