- Critical Role of Heat Load Calculation in Instrumentation Panels
- Instrumentation Panel Heat Load Calculator
- What is an Instrumentation Panel Heat Load Calculator?
- Why Heat Load Calculation Is Mandatory in Instrumentation Panel Design
- Who Should Use the Instrumentation Panel Heat Load Calculator?
- Key Parameters Used in the Instrumentation Panel Heat Load Calculator
- How to Use the Instrumentation Panel Heat Load Calculator – Step-by-Step
- How Panel Heat Load Calculation Works – Engineering Logic Explained
- Standards and Engineering References for Panel Heat Load Calculation
- Advantages of Using an Instrumentation Panel Heat Load Calculator
- Common Industrial Applications of Panel Heat Load Calculation
- Frequently Asked Questions (FAQ) on Panel Heat Load Calculation
Critical Role of Heat Load Calculation in Instrumentation Panels
Instrumentation and control panels are the most important parts of plant automation in today’s process industries. These panels have delicate electronic parts such PLCs, DCS controllers, power supply, relays, safety systems, analyzers, communication modules, and devices for industrial networking. While they are running, all of these parts constantly create heat.
If the heat produced isn’t correctly measured and eliminated, the temperatures inside the panels can go above safe levels. This can cause frequent failures, unexpected shutdowns, communication mistakes, and long-term dependability problems. This is when an Instrumentation Panel Heat Load Calculator becomes an important tool for engineers.
AutomationForum’s Instrumentation Panel Heat Load Calculator is made to help engineers figure out the overall heat load inside an enclosure and how much cooling is needed. It follows IEC and IEEE requirements and supports best practices in engineering, so it may be used for professional design, EPC documentation, and real plant applications.
PLC Control Panel Inspection Checklist – Field-Ready Guide: Running Inspection Checklist of PLC Components in Control Panels
Instrumentation Panel Heat Load Calculator
Instrumentation Panel Heat Load Calculator
AUTOMATIONFORUM.CO
Your Trusted Source for Automation Power Tools & Solutions
ENCLOSURE DETAILS
PANEL DIMENSIONS (mm)
THERMAL & SITE DATA
This calculator provides an engineering estimate. Final equipment selection shall consider solar load, enclosure sealing, air leakage, and manufacturer recommendations.
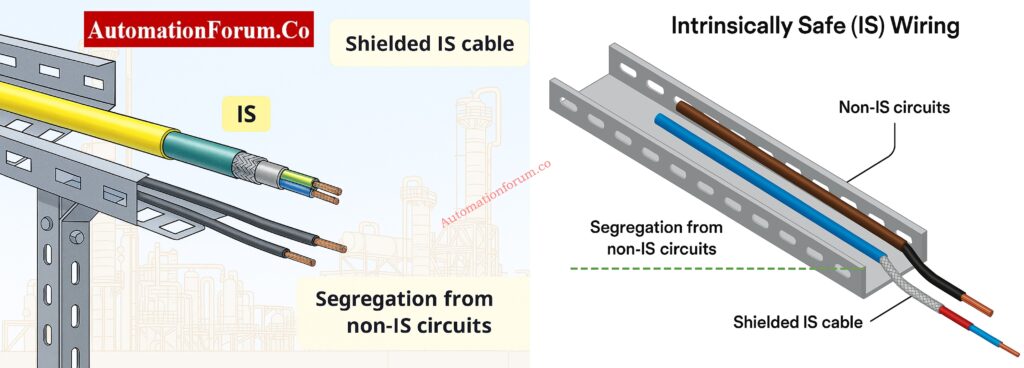
Why Cable Shield Grounding Is Done at PLC Panel Side – Explained: Why the Cable Shield is Grounded Only at the PLC or Control Panel Side
What is an Instrumentation Panel Heat Load Calculator?
An Instrumentation Panel Heat Load Calculator is a specialized engineering tool that figures out how much heat is made within an electrical or instrumentation enclosure and how much cooling is needed to keep the temperature inside safe.
The calculator takes into account both:
- Equipment that makes heat inside
- Heat transfer from the outside owing to the weather
The output is given in a number of different engineering units:
- Wattage (W)
- Kilowattage (kW)
- British Thermal Units per hour (BTU/hr)
- Tons of Cooling (TR)
This makes the calculator perfect for choosing:
- Air conditioners for panels
- Exchangers of heat
- Fans with filters
- Cooling systems that use both air and water
PLC Remote I/O Card Failures – Root Cause Analysis & Solutions: Root Cause Analysis of PLC Remote I/O Panel (Point I/O Panel) Cards Failure Issues
Why Heat Load Calculation Is Mandatory in Instrumentation Panel Design

In current panel engineering, calculating the heat load is not optional. It is a basic necessity for the design.
Consequences of Poor Heat Load Estimation
Underestimated Heat Load
- Heat Load Was Not Enough
- PLC CPUs and I/O cards getting too hot
- Power supply shutdown or derating
- Ethernet switches that don’t work for communication
- Panel AC trips a lot
- Shorter lifespan of electronic parts
Oversized Cooling Systems
- More money spent on capital
- More power use
- Risks of condensation inside panels
- The system doesn’t work well.
A correctly figured heat load makes sure that the system cools down effectively, uses energy efficiently, and lasts for a long time.
Wellhead Control Panel – Design, Function & Field Applications: Wellhead Control Panel
Who Should Use the Instrumentation Panel Heat Load Calculator?
This calculator is meant for people who work with industrial automation systems at all stages of their life cycle.
Primary Users
- Instrumentation Design Engineers
- Control System Engineers
- Electrical Engineers
- EPC Engineering Teams
- Panel Builders and System Integrators
- Maintenance and Reliability Engineers
Typical Industrial Applications
- PLC control panels
- DCS marshalling cabinets
- Analyzer shelters and cabinets
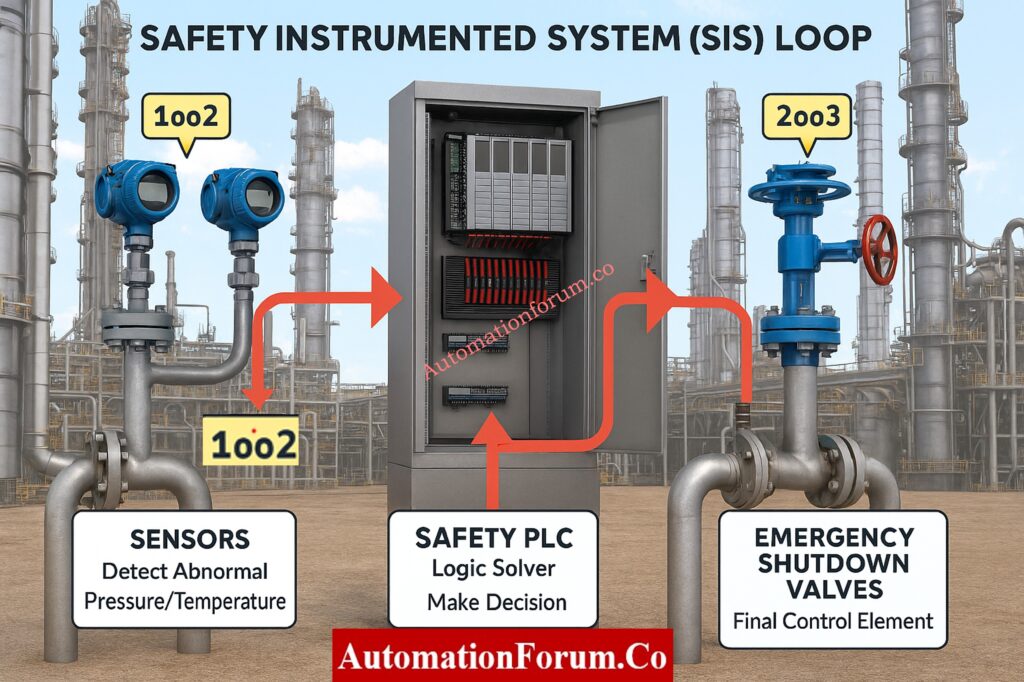
- Safety Instrumented System (SIS) panels
- Field junction boxes with electronics
- MCC instrumentation compartments
What Is a Fire Alarm Control Panel (FACP)? – Basics Explained: What is an FACP? (Fire Alarm Control Panel)
Key Parameters Used in the Instrumentation Panel Heat Load Calculator
The calculator uses real-world technical parameters that have a direct effect on how the panel’s temperature changes.
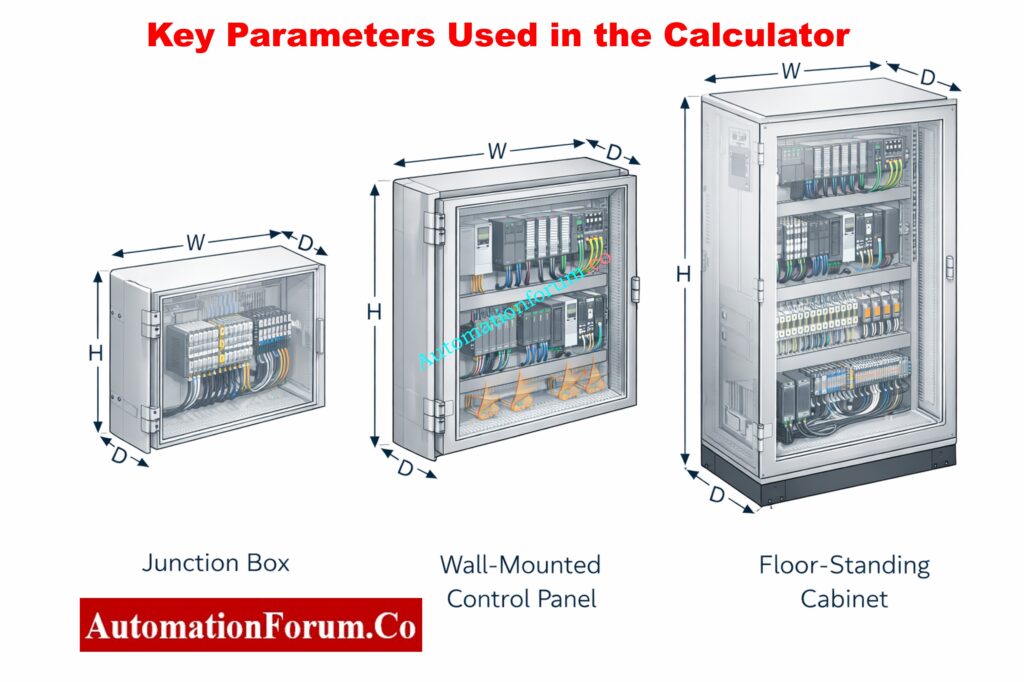
1. Enclosure Type
The kind of enclosure impacts how much surface area it has and how well it can get rid of heat. Types that are supported include:
- Junction Box
- Wall-Mounted Panel
- Floor-Standing Cabinet
Each type has different ways of letting air move and holding heat.
2. Enclosure Material
Material selection significantly impacts heat transfer:
- Painted Steel
- Stainless Steel
- Aluminium
In thermal calculations, the U-value (total heat transfer coefficient) of each material is variable.
3. Mounting Configuration
The method of mounting affects natural convection and heat rejection:
- Free standing
- Wall mounted
- Floor mounted
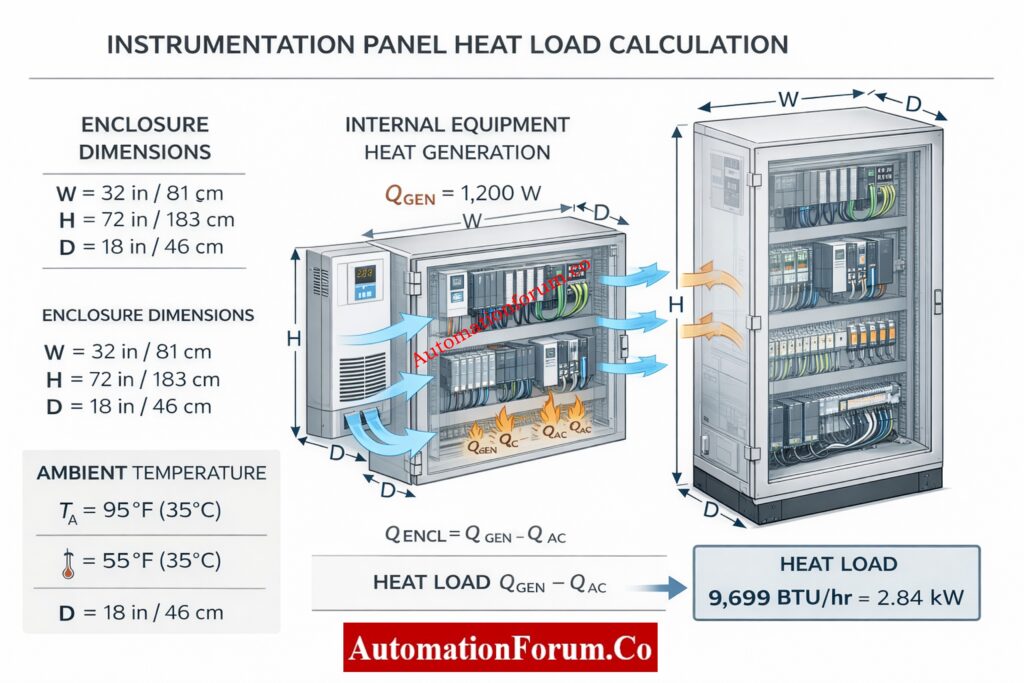
4. Panel Dimensions (Width × Height × Depth)
The size of the panels impacts the external surface area, which in turn affects how well heat moves from the enclosure to the outside.
5. Internal Equipment Power Dissipation
This includes heat generated by:
- PLC CPUs and I/O modules
- Power supplies
- VFD control electronics
- Instrument transmitters
- Network switches and gateways
Most of the time, manufacturers list power dissipation in watts, which should be added up for all the equipment that is already there.
6. Ambient and Internal Temperature Conditions
- Maximum ambient (outside) temperature
- Desired internal operating temperature
The difference in temperature (ΔT) causes heat to move through the walls of the enclosure.
7. Installation Altitude
The higher you go, the less air there is, which makes cooling less effective. The calculator uses a standard altitude compensation factor, which is very significant for plants that are higher up.
8. Safety Factor
A safety factor takes into account:
- Future expansion
- Load uncertainties
- Aging of cooling equipment
- Real-world operating variations
The usual range for safety factors is between 1.1 and 1.25.
Control Panel Door Earth Bonding Procedure – Safety Guide: Panel Door Earth Bonding Procedure: Ensuring Safety and Reliability
How to Use the Instrumentation Panel Heat Load Calculator – Step-by-Step
Step 1: Enter Enclosure Details
Choose the sort of enclosure, the material it is made of, and how it will be mounted. The image of the enclosure changes in real time, which helps engineers see how the panel is shaped.
Step 2: Input Panel Dimensions
Please provide the width, height, and depth in millimeters. Controls for incrementing and decrementing make it easy to enter data correctly and stop typical mistakes.
Step 3: Enter Thermal and Site Data
Provide:
- Total internal equipment power (W)
- Maximum outside temperature
- Desired internal temperature
- Site altitude
- Safety factor
Inline tooltips show engineers the best engineering values to use.
Step 4: Calculate Heat Load
Click “Calculate Heat Load” to quickly get:
- Required cooling capacity summary
- Detailed calculation breakdown
- Final heat load values in W, kW, BTU/hr, and TR
PLC Panel Installation & Commissioning Checklist – Free Download: Comprehensive PLC Panel Installation and Commissioning Checklist (Downloadable)
How Panel Heat Load Calculation Works – Engineering Logic Explained
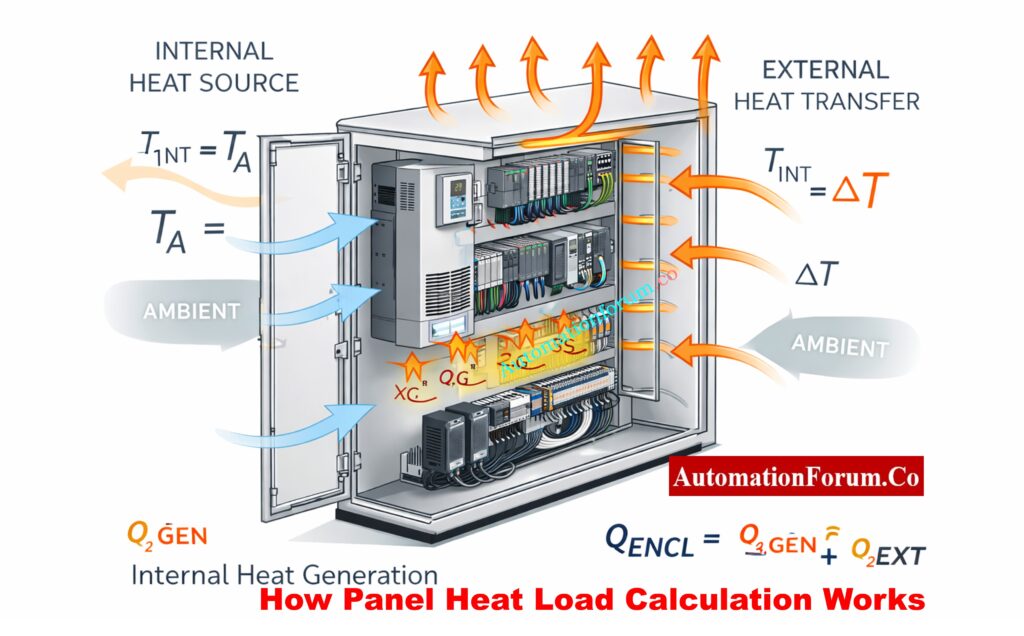
The calculator follows a structured engineering methodology.
1. Internal Heat Load Calculation
The internal heat load is the total of all the power losses in the equipment:
Internal Heat Load (W) = Σ Equipment Power Dissipation
2. Enclosure Surface Area Calculation
To find the entire external surface area, use the formula:
Surface Area = 2 × (WH + WD + HD)
Where:
- W = Width (m)
- H = Height (m)
- D = Depth (m)
3. Temperature Difference (ΔT)
ΔT = Outside Temperature – Desired Internal Temperature
For heat transmission, only temperature changes that are positive are taken into account.
4. External Heat Load Calculation
To figure out how much heat is transmitted through the walls of an enclosure, use this formula:
External Heat Load = Surface Area × ΔT × U-value
The U-value changes according on the material of the enclosure and how it is mounted.
5. Altitude Correction Factor
To take into account the fact that air is less dense at higher altitudes:
Altitude Factor ≈ 1 + (Altitude / 1000 × 0.03)
6. Safety Factor Application
To make sure the system works reliably, the calculated heat load is multiplied by the safety factor that was chosen.
7. Total Heat Load
Total Heat Load = (Internal + External Heat Load) × Altitude Factor × Safety Factor
8. Unit Conversion
We turn the resulting heat load into standard engineering units:
- 1 W = 3.412 BTU/hr
- 1 TR = 3.517 kW
PLC Panel FAT Procedure – Step-by-Step Acceptance Test Guide:Factory Acceptance Test (FAT) of a PLC Panel: A Step-by-Step Basic Guide
Standards and Engineering References for Panel Heat Load Calculation
The Instrumentation Panel Heat Load Calculator meets industry standards that most people agree on:
IEC Standards
- IEC 61439-1 and IEC 61439-2: Low-voltage switchgear assemblies
- IEC 60529: Levels of protection (IP rating)
- IEC 60068—Testing for the environment
IEEE Standards
- IEEE 141 (Red Book) – Power distribution in industry
- IEEE 3007 Series: Power systems for businesses and factories
- IEEE 493: How reliable industrial systems are.
Refer the below link for the PLC Power Supply Calculator – Complete Guide for Accurate PLC Power Sizing
Advantages of Using an Instrumentation Panel Heat Load Calculator
- Stops panels from getting too hot and breaking down
- Helps with the right size of the panel AC
- Makes the system more reliable and keeps it running longer
- Lessens the need for trial-and-error design
- Makes computations that are suitable for documentation
- Good for EPC, OEM, and plant engineering groups.
Types of Automation Control Panels Used in Industrial Design: Various panels involved in automation design?
Common Industrial Applications of Panel Heat Load Calculation
- Making new PLC or DCS panels
- Adding more devices to existing panels
- Choosing new air conditioners for the replacement panel
- Fixing control panels that are too hot
- Getting engineering documents ready for the client to sign off on
The Instrumentation Panel Heat Load Calculator is a useful, engineering-grade tool that helps with the design of correct panel cooling in industrial automation systems. It gives accurate heat load estimations that follow IEC and IEEE technical standards by taking into account the shape of the enclosure, the materials it is made of, the temperature and humidity of the environment, the height of the installation, and safety margins.
This calculator is more than simply a convenience for instrumentation and control engineers. It is an important design tool that makes equipment more reliable, lessens downtime, and makes sure that operations stay stable over time in industrial settings.
Fire Alarm Control Panel vs Sub Panel- Key Differences Explained: What is Fire Alarm control panel? What is Sub Fire Alarm Control Panel?
Frequently Asked Questions (FAQ) on Panel Heat Load Calculation
How to calculate heat load of a panel?
To find out how much heat an electrical or instrumentation panel can handle:
- Find out how much power (in watts) all of the devices in the panel use (PLCs, power supply, relays, switches, etc.).
- Let’s say that all of this power turns into heat.
Convert watts to BTU/hr using:
Heat Load (BTU/hr) = Watts × 3.41
- Use the size and material of the enclosure to add external heat transfer induced by high ambient temperature.
- If necessary, use safety and altitude correction parameters.
The total panel heat load is the sum of the heat inside and outside the panel.
How to calculate heat load formula?
The formula for calculating the basic heat load for panel and HVAC systems is:
Heat Load (Q) = U × A × ΔT
Where:
- Q = Heat load (Watts or BTU/hr)
- U = Heat transfer coefficient of enclosure
- A = Surface area of enclosure
- ΔT = Temperature difference between outside and inside
Most of the time, the overall heat load for instrumentation panels is figured out like this:
Total Heat Load = Internal Heat Load + External Heat Load
How to calculate main panel load?
To figure out the load on the main electrical panel:
Write down all the loads that are connected, such as lights, instruments, PLCs, and power supplies.
Find out how much power each load needs:
Power (Watts) = Voltage × Current
To find the overall panel load, add up all the watt values.
If necessary, use the diversity or demand factor.
This calculation finds out how much electricity is needed, whereas the heat load calculation finds out how much cooling is needed.
What is 141 in heat load calculation?
The number 141 is a quick way to figure out how much heat a room or panel can hold.
Formula:
Heat Load (BTU) = Length × Width × Height × 141
Where the measurements are in meters.
This approach gives an approximate idea of how big an office area or a small equipment space should be. It shouldn’t be used to figure out exactly how big a panel AC should be for industrial use.
How to calculate heat formula?
Heat calculation depends on the application:
1. For equipment or enclosures (conduction):
Q = U × A × ΔT
2. For fluids or air (sensible heat):
Q = m × Cp × ΔT
Where:
- m = Mass flow rate
- Cp = Specific heat capacity
- ΔT = Temperature change
For control panels, equipment power dissipation + enclosure heat transfer is the most accurate approach.
Mimic Panel in Industrial Automation – Purpose & Applications: What is mimic panel?


 1")