- Heartbeat Technology in Smart Instrumentation
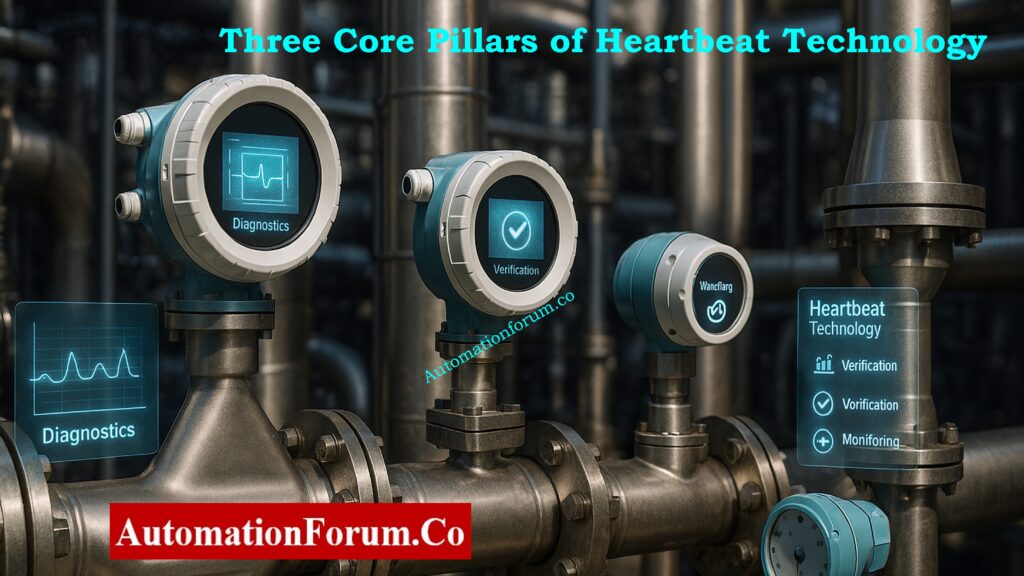
- Three Core Pillars of Heartbeat Technology
- Working Principle of Heartbeat Technology
- Heartbeat Diagnostics – Continuous Monitoring and Early Fault Detection
- Heartbeat Verification – Online Integrity Proof Without Process Shutdown
- Heartbeat Monitoring – Predictive, Condition-Based Optimization
- Features and Advantages of Heartbeat Technology for Modern Plants
- Applications of Heartbeat Technology Across Industries
- Challenges and Limitations of Heartbeat Technology
- Real Industry Case Studies Using Heartbeat Technology
- Why Heartbeat Technology is Essential for the Future of Smart Plants
- FAQs – Heartbeat Technology in Process Instrumentation
Heartbeat Technology in Smart Instrumentation
Endress+Hauser’s Heartbeat Technology is a sophisticated self-diagnostic and verification framework integrated into contemporary flow, level, analytical, and pressure instruments. Predictive maintenance, automated integrity verification, and continuous internal monitoring are made possible without removing the device from the process or disrupting plant operations.
Three Core Pillars of Heartbeat Technology
Heartbeat Diagnostics – Continuous Internal Self-Checking
A system that constantly checks itself and automatically analyzes the health of a device, finds abnormal signals, finds installation problems, and warns maintenance teams before a measurement failure gets worse.
Heartbeat Verification – Online, Traceable Integrity Validation
A built-in, traceable way to check that an instrument is still working properly and meets its original factory specifications without needing calibration tools or stopping the process.
Heartbeat Monitoring – Predictive, Condition-Based Insights
Predictive, condition-based insights using long-term trend analysis of buildup, corrosion, sensor drift, and mechanical wear. This lets you plan maintenance before problems happen.
Instant Failure Rate (λ) Calculation – Smart Tool for Instrumentation Engineers: Failure Rate (λ) Calculator for Process Instrumentation and Industrial Maintenance
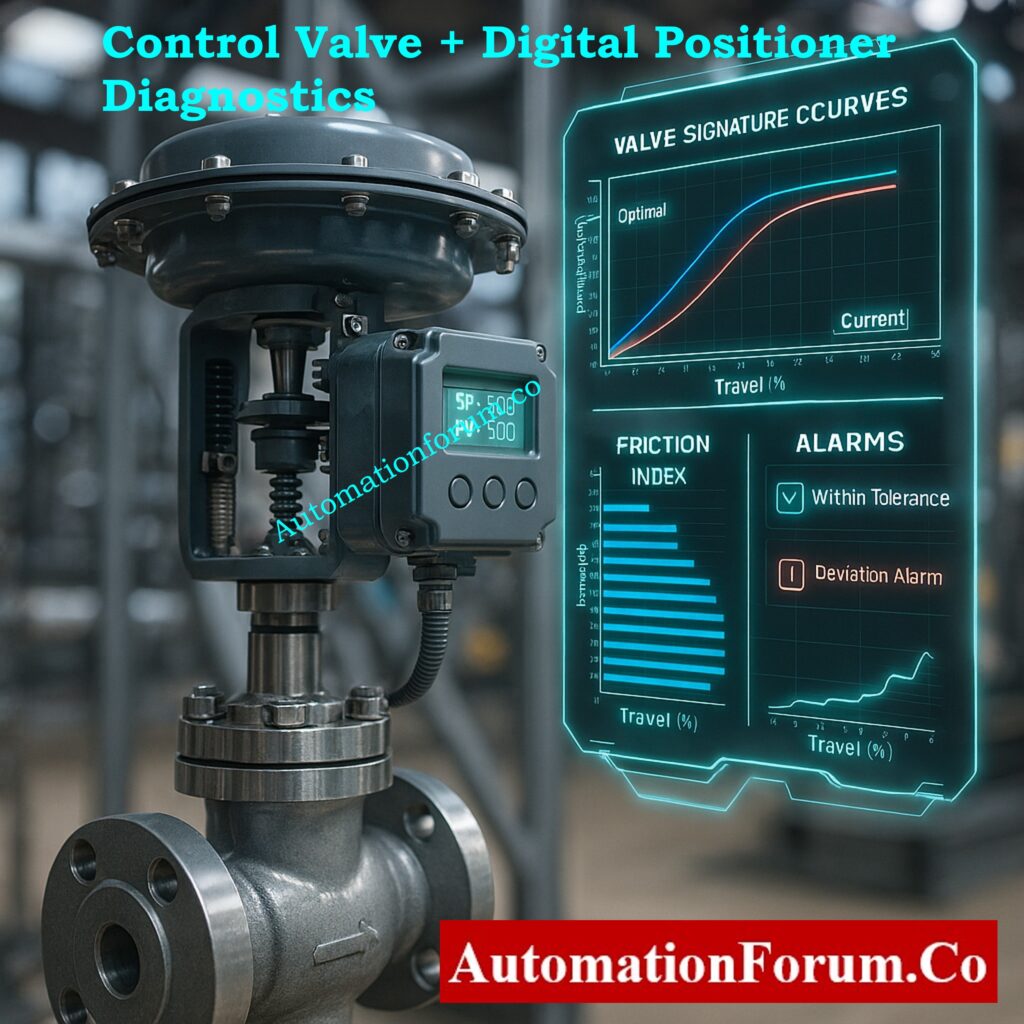
Working Principle of Heartbeat Technology
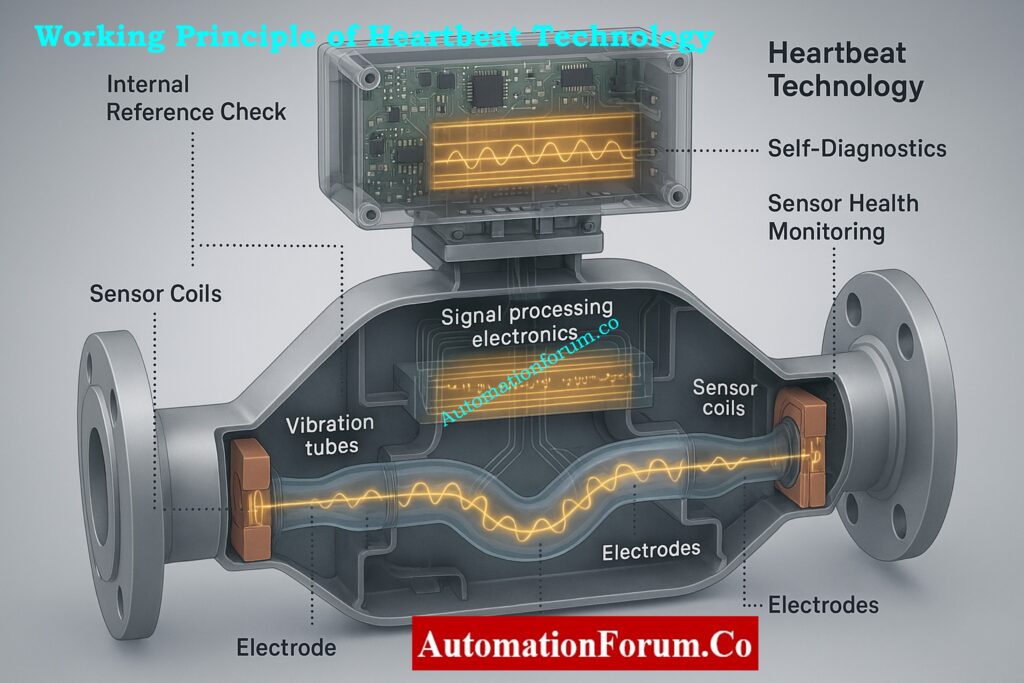
Internal Reference Signatures and Baseline Comparisons
Internal, traceable reference values that reflect optimal sensor conditions are used in the manufacture of every instrument. The device can do the following thanks to these reference signatures:
- By comparing real-time inductive characteristics to baseline values that represent factory-calibrated conditions, you can assess sensor coil performance.
- To find early indications of coating, corrosion, or insulation failure, keep an eye on electrode and contact conductivity.
- By comparing signal processing chains, A/D converters, and internal amplifiers to predetermined benchmark responses, you can monitor the stability of electronic circuits.
- To guarantee measurement accuracy under fluctuating thermal loads, evaluate temperature compensation components.
Permanent Self-Diagnostics Executed Throughout Device Operation
Heartbeat-enabled devices perform ongoing internal diagnostics, frequently assessing over 80 to 150 internal parameters, enabling them to:
- Determine early-stage sensor degradation before it compromises safety-critical loops or measurement accuracy.
- Find anomalous signal patterns that point to electrode contamination, buildup, entrained air, or process turbulence.
- Check the stability of the internal mechanical assemblies, coils, electrodes, and pick-up sensors.
- Analyze noise levels and electrical interference patterns to verify the health of the wiring and grounding.
- To identify mechanical stress, resonance shifts, or outside forces affecting the instrument, keep an eye on the vibration modes.
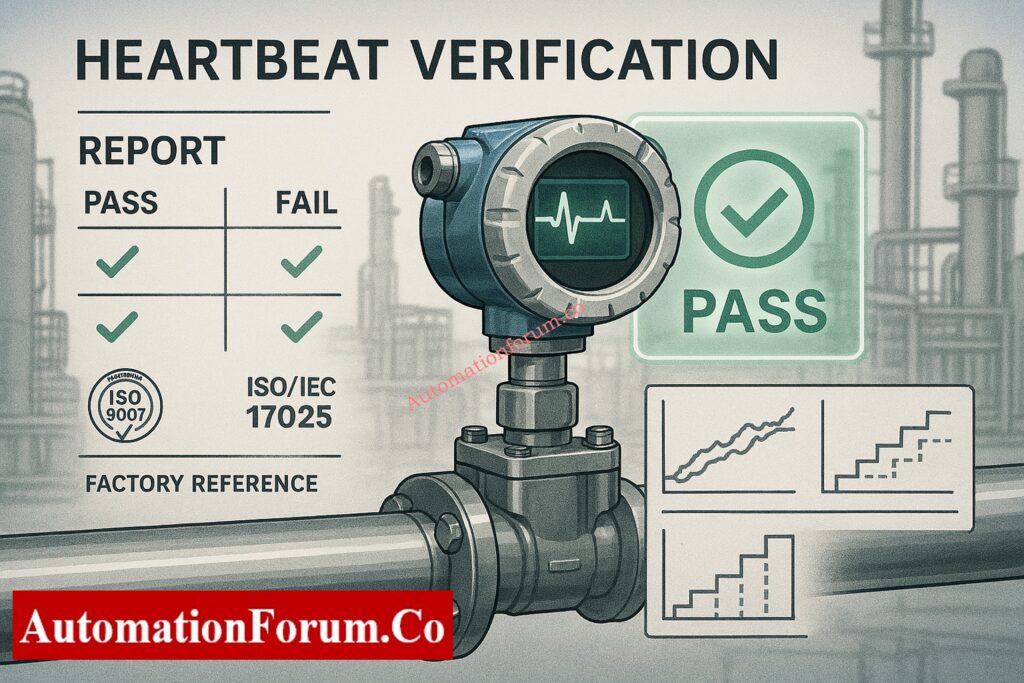
Automated Verification Sequence for Compliance and Integrity Proof
When initiated locally or via DCS/AMS:
- The device performs a structured, algorithm-driven verification routine that checks the entire measurement chain from sensor to electronics.
- To make sure the device still functions as it did when it was first manufactured, internal reference signals are compared to factory signatures.
- Tube stiffness, electrode condition, coil inductance, and signal amplification response are all assessed in terms of mechanical and electronic integrity.
- A fully traceable digital PASS/FAIL report that complies with ISO 9001, ISO 17025, and NAMUR NE 107 standards is produced.
- Pharmaceutical, chemical, and energy applications benefit greatly from verification since it doesn’t disrupt or halt the process.
Heartbeat Monitoring for Predictive Maintenance & Early Fault Prevention
Predictive maintenance is made possible by long-term trend analysis by tracking:
- Over time, buildup and coating accumulation raise measurement error and signal the need for cleaning.
- corrosion development within electrodes or sensor surfaces, which aids in prioritizing replacement prior to catastrophic failures.
- Changes in Coriolis tube stiffness and vibration damping frequently indicate wear and tear or an approaching mechanical fracture.
- anomalies associated with the process, such as entrained gas, variations in viscosity, temperature instability, or variations in density.
- general trends in sensor health that assist plants in transitioning from routine maintenance to condition-based maintenance techniques.
Refer the below link to Stop PLC Failures Early – Proactive I/O Maintenance Strategies for Maximum Uptime
Heartbeat Diagnostics – Continuous Monitoring and Early Fault Detection
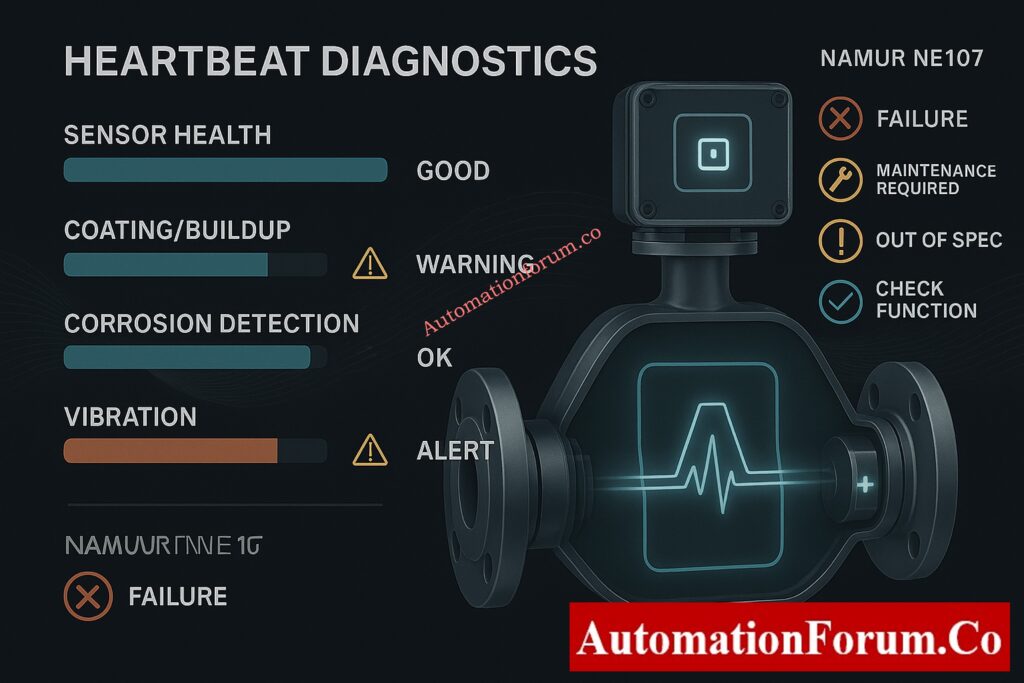
Common Diagnostic Indicators
- Buildup or coating on electrodes or sensing components that progressively lowers measurement accuracy and indicates cleaning is necessary.
- Gas pockets or air entrainment within the flow path can skew readings and possibly harm downstream equipment or pumps.
- Sensor surface corrosion or chemical attack can lead to progressive signal degradation and possible safety-loop malfunctions.
- Signal drift that is trending above thresholds could be a sign of environmental effects, process contamination, or component aging.
- deterioration of electronics or unstable circuitry brought on by aging hardware, heat, or vibration.
- Thermal stress or temperature overload may have an impact on sensor longevity or measurement linearity.
- Inadequate grounding, excessive vibration, or improper sensor orientation are examples of improper installation conditions.
- Signal quality abnormalities can be used to identify electrical noise, electromagnetic interference, or grounding problems.
Benefits of Using Heartbeat Diagnostics
- prompt identification of unusual device and process conditions, avoiding unplanned shutdowns and failures.
- Internal sensor health is continuously visible, allowing for quicker troubleshooting and more intelligent maintenance choices.
- decreased possibility of measurement errors, particularly in applications involving safety instruments, dosage, and custody transfer.
- Message classification that is unambiguous and consistent (Failure, Out of Specification, Maintenance Required, Check Function).
- Comprehensive diagnostic logs are kept for performance analysis, compliance, and audits.
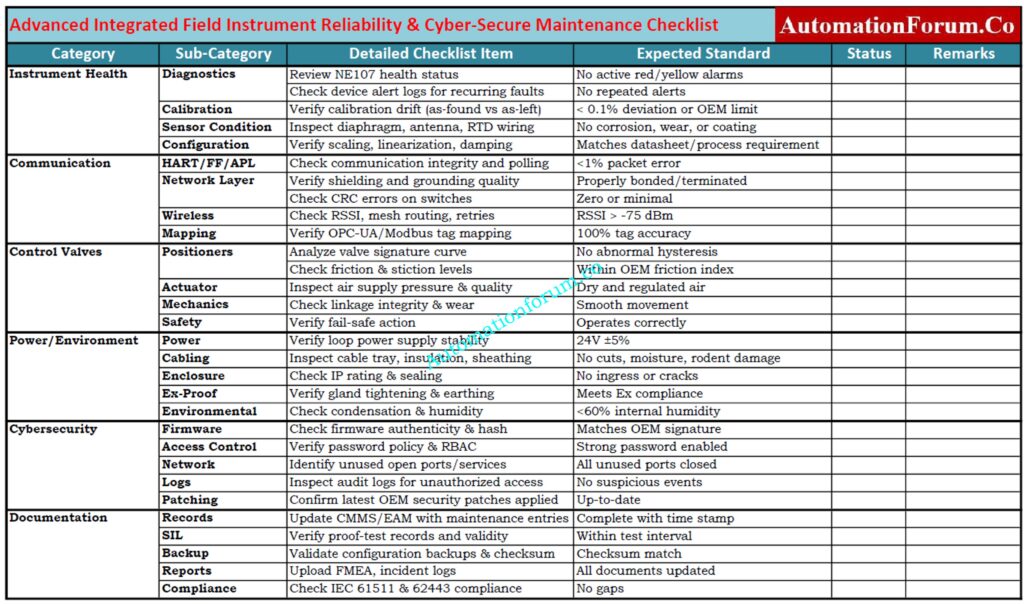
Ultimate Smart Plant Instrument Reliability & Cyber-Secure Maintenance Checklist: Advanced Integrated Field Instrument Reliability & Cyber-Secure Maintenance Checklist for Smart Process Plants
Heartbeat Verification – Online Integrity Proof Without Process Shutdown
Advantages of the Built-In Verification Function
- makes sure the device still satisfies the original manufacturer’s requirements without taking it out of service.
- It is perfect for continuous processes because it saves time and does not require calibration setup.
- supports GMP, FDA, and regulated industry compliance by offering fully traceable verification documents.
- lowers lifecycle costs by reducing calibration frequency and maintenance workload.
- enhances process reliability by supporting risk-based calibration techniques.
What Verification Can Reveal
- If left unnoticed, sensor fatigue or mechanical wear can develop into catastrophic failures.
- Deviations in tube stiffness in Coriolis meters that point to corrosion, fatigue, or stress from the process.
- Conductivity measurements are impacted by electrode wear or coating formation in magmeters.
- Engineers can identify early electronic degradation with the aid of analog and digital signal path drift.
- mechanical or structural abnormalities, especially in hostile or hot conditions.
Refer the below link to Track These 10 Critical Metrics – Reliability Engineer’s Essential Maintenance KPIs
Heartbeat Monitoring – Predictive, Condition-Based Optimization
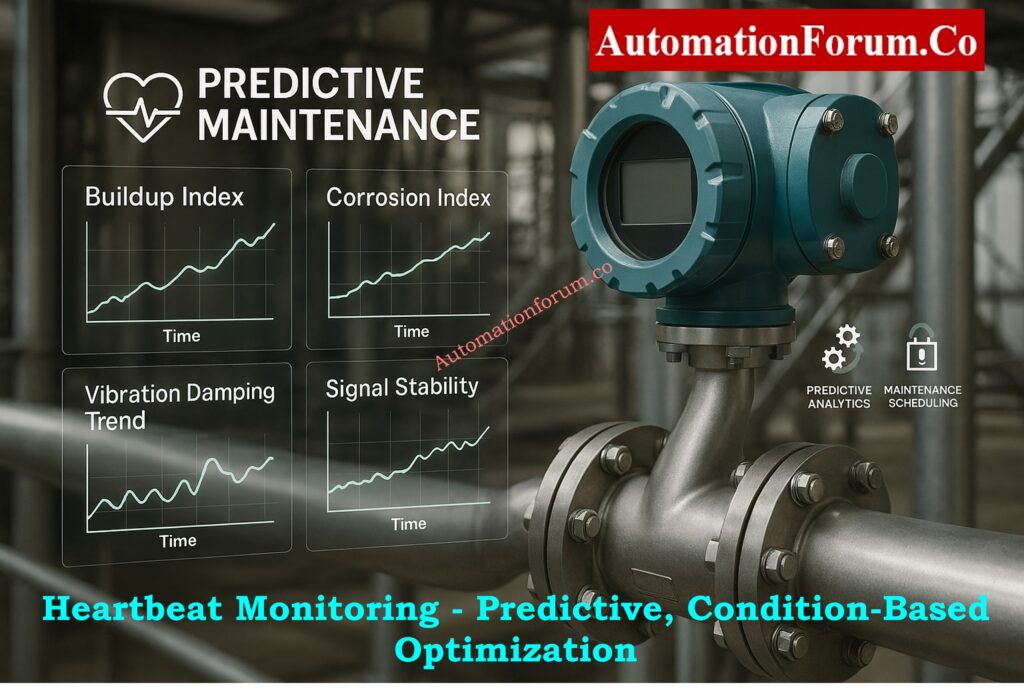
Key Monitoring Metrics Explained
- Buildup Index: Monitors scaling and fouling patterns that affect energy consumption and flow accuracy.
- Corrosion Index: Extends equipment life and prevents failures by giving an early warning of chemical wear.
- Signal Stability Index: Process disruptions such as entrained gas, cavitation, or turbulence are identified by the Signal Stability Index.
- Process Health Indicators: Examine density, viscosity, flow behavior, and other dynamic process parameters as process health indicators.
Advantages of Predictive Maintenance Through Heartbeat Monitoring
- reduces downtime and prevents product contamination by enabling plants to proactively plan cleaning schedules.
- ensures that maintenance is only carried out when necessary by optimizing turnaround planning.
- allows for early sensor replacement, avoiding unplanned shutdowns or measurement failures.
- lowers the cost of spare inventory because instrument wear is more predictable.
- enhances process stability and operational efficiency, particularly in environments with continuous production.
Boost Plant Reliability – Expert Cyber-Secure Instrument Maintenance Checklist: Advanced Integrated Field Instrument Reliability & Cyber-Secure Maintenance Checklist for Smart Process Plants
Features and Advantages of Heartbeat Technology for Modern Plants
Key Smart Features Built Into Heartbeat
- Deep-level embedded diagnostics for failure prediction and real-time device condition visibility.
- Online verification that guarantees production continuity and audit readiness while requiring no process interruption.
- traceable reports that support documentation and regulatory compliance and are compatible with international quality systems.
- Future-ready maintenance strategies are made possible by the device’s built-in predictive analytics.
- Long-term internal reference signatures guarantee consistent performance over the course of the instrument’s life.
- NAMUR NE 107 standardized diagnostics, guaranteeing uniformity among various systems and assets.
- seamless integration of asset management, DCS, and PLC that enhances system visibility.
Operational and Lifecycle Advantages
- greatly increased measurement accuracy, lowering risk in crucial processes.
- significant decrease in unscheduled downtime due to early fault detection and repair.
- reduced maintenance costs by doing away with pointless field service and calibration visits.
- longer calibration intervals, particularly in regulated sectors where documentation is crucial.
- increased safety, especially in situations where a malfunctioning instrument could endanger people or the environment.
- Improved process transparency allows operators to swiftly make well-informed decisions.
Perfect Your Fieldbus Installations – EPC Engineer’s Complete Best Practices Guide: Foundation Fieldbus Installation and Best Practices – Complete Guide for EPC and Maintenance Engineers
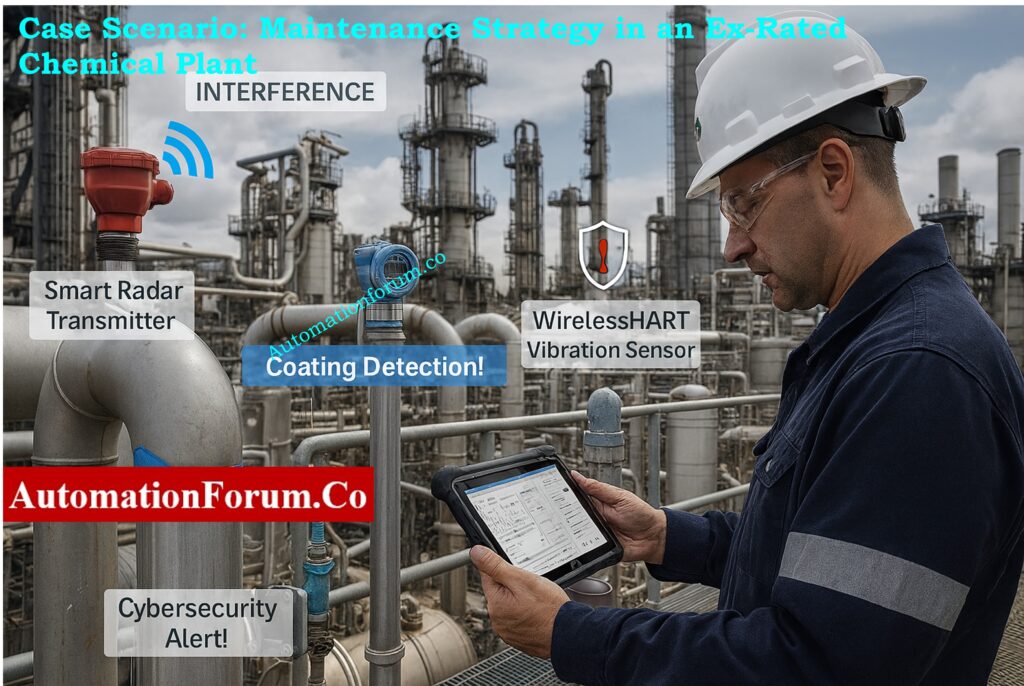
Applications of Heartbeat Technology Across Industries
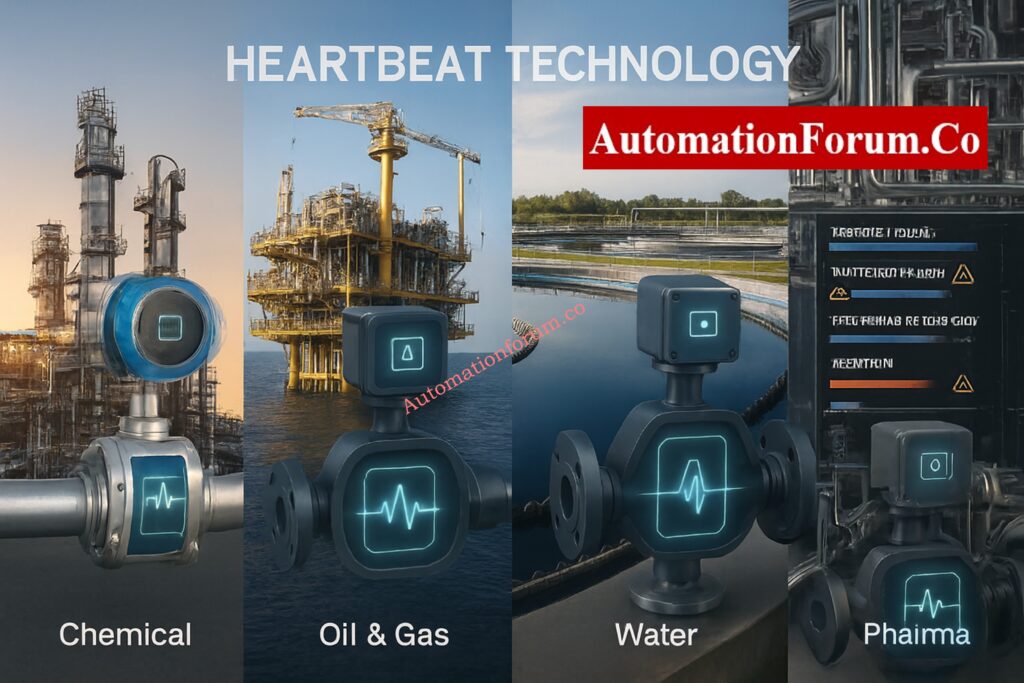
Chemical & Petrochemical
- In aggressive media, accurate measurements are maintained through real-time buildup and corrosion monitoring.
- Safety instrumented functions (SIF) are more reliable when sensor drift is detected early.
Oil & Gas
- Continuous verification signals ensure the accuracy of oil and gas custody transfers.
- Predictive diagnostics is useful for offshore installations because maintenance access is restricted.
Water & Wastewater
- Measurement deviation is avoided by flowmeters that detect sediment accumulation.
- In high-volume metering applications, fewer calibration requirements result in lower costs.
Food & Beverage
- Strict adherence to quality standards is ensured by hygienic process monitoring.
- Forecasting fouling in milk, syrup, and viscous products decreases downtime and increases batch consistency.
Pharmaceutical
- Regulatory audits are easily supported by pharmaceutical GMP-compliant verification reports.
- Product integrity is guaranteed by accurate ultrapure media measurement.
Power & Energy
- Monitoring cooling water flow guarantees boiler and turbine safety.
- Pump failures and system outages can be avoided with the use of predictive alerts.
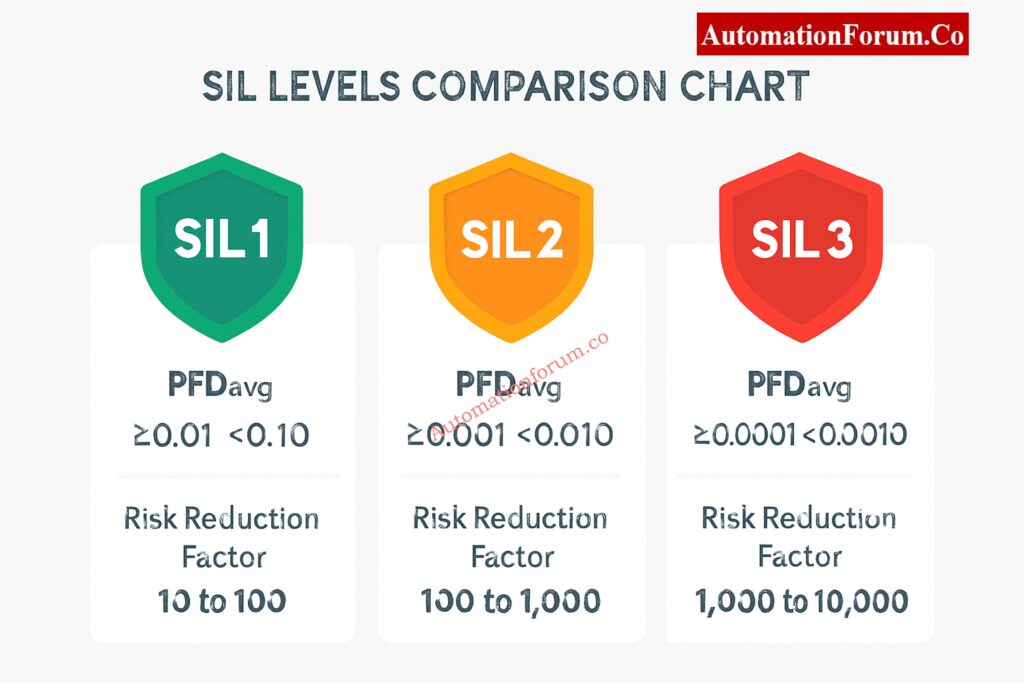
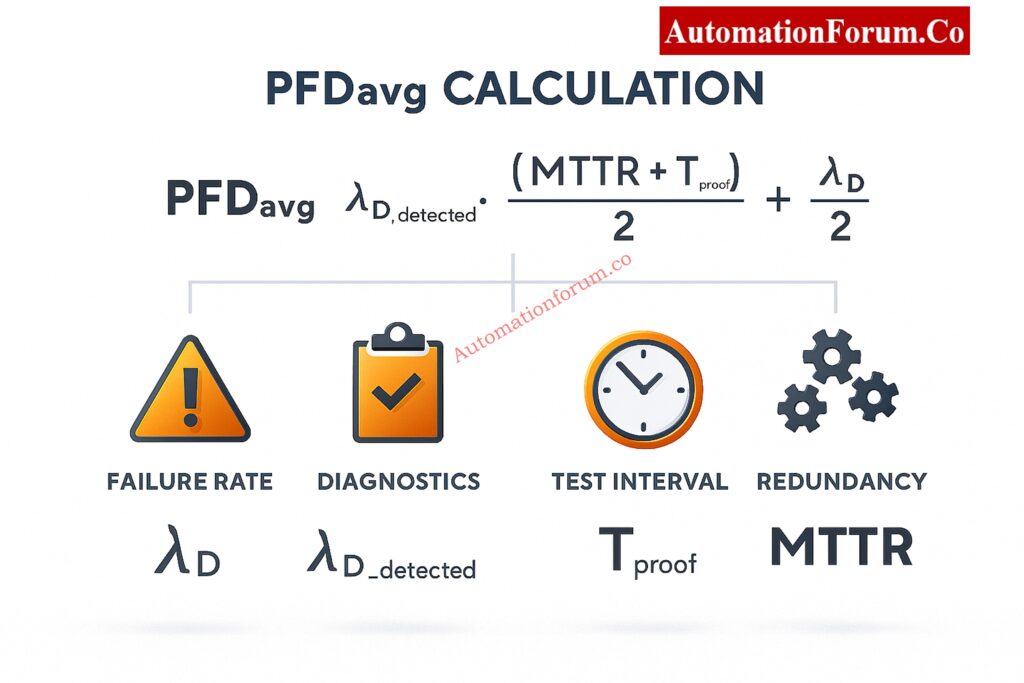
Calculate PFDavg Fast – Complete SIL Verification Guide + Free Online Tool: SIF PFDavg / SIL Verification – Complete Guide + Online Calculator
Challenges and Limitations of Heartbeat Technology
- Verification checks integrity but not absolute accuracy, so it is not a complete replacement for calibration.
- Multi-brand interoperability is limited because it is only available in Endress+Hauser devices.
- requires knowledgeable staff to set up predictive maintenance plans and analyze trends.
- higher initial cost, but investment is usually outweighed by lifecycle savings.
PLC Control Panel Health Check – Essential Running Inspection Checklist: Running Inspection Checklist of PLC Components in Control Panels
Real Industry Case Studies Using Heartbeat Technology
Use Case 1: Wastewater Buildup Prevention
- Heavy sediment accumulation was anticipated by trend data weeks in advance, enabling prompt cleaning and avoiding legal infractions.
- Additionally, Heartbeat Monitoring allowed the maintenance team to minimize needless manual inspections and optimize cleaning schedules by quantifying the rate of buildup progression.
Use Case 2: Coriolis Tube Fatigue Detection
- Changes in vibration stiffness signaled approaching tube fatigue, allowing for a safe replacement prior to failure.
- Additionally, the diagnostics showed unusual vibration patterns brought on by upstream process disruptions, which enabled engineers to fix piping vibration problems and increase the new sensor’s lifespan.
Use Case 3: Food Industry Calibration Reduction
- Verification reports made it possible to increase calibration intervals from six months to twenty-four months, which significantly decreased costs.
- By offering traceable evidence of instrument integrity and cutting down on audit preparation time, the digital verification history improved GMP audit documentation.
Use Case 4: Power Plant Cooling Optimization
- preventing pump trips and unplanned outages by keeping an eye on detected entrained air and particulate load.
- Additionally, the monitoring trends enabled proactive filter maintenance and stabilized cooling system efficiency by assisting operators in correlating cooling water fluctuations with upstream filter performance.
Decode HART Transmitter Health – What Your Field Device is Really Saying: HART Transmitter Diagnostics: What Your Field Device is Telling You
Why Heartbeat Technology is Essential for the Future of Smart Plants
Plants need the following tools as industrial automation advances toward Industry 4.0:
- Self-diagnosing
- Predictive and smart
- Capable of real-time reporting
- Easily integrated into digital ecosystems
Digital twins, sophisticated analytics, and intelligent maintenance systems are all supported by Heartbeat Technology, which turns instruments into self-verifying, health-aware assets.
By combining diagnostics, verification, and predictive monitoring into a single intelligence layer, Heartbeat Technology makes it possible for plants to run more safely, reliably, and affordably. It is a fundamental technology for both the future digitalized process industries and contemporary smart instrumentation.
Test Your Temperature Transmitter Skills – Advanced Troubleshooting Challenge: Temperature Transmitter Troubleshooting Quiz – Advanced Diagnostics for Industrial Applications
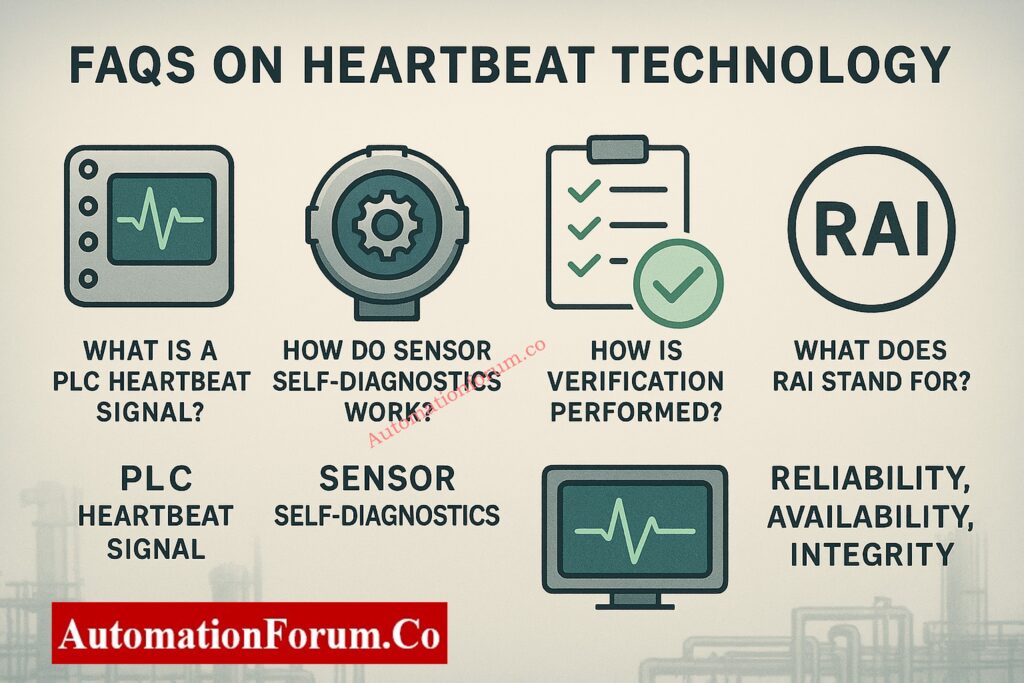
FAQs – Heartbeat Technology in Process Instrumentation
What is Heartbeat Technology?
Endress+Hauser created Heartbeat Technology, a sophisticated built-in diagnostics and verification system that continuously checks an instrument’s internal health, confirms its integrity when needed, and provides predictive maintenance information without interfering with measurement.
What is RAI and Heartbeat Technology?
Key performance goals in process industries are referred to as RAI (Reliability, Availability, and Integrity). By enhancing instrument reliability through self-diagnostics, expanding availability through online verification, and preserving integrity through traceable internal reference checks, Heartbeat Technology directly supports RAI.
What is the heartbeat signal in PLC?
In a PLC, a heartbeat signal is an alternating, periodic digital signal that verifies the integrity of communication between two systems or devices. Alarms or safety measures are triggered if the heartbeat stops, indicating a communication breakdown or device malfunction.
What is heartbeat detector technology?
The term “heartbeat detector technology” describes devices (typically infrared, microwave, or radar-based) that use micro-vibrations from breathing and heartbeats to identify the presence of a living person. The phrase can also refer to algorithms used in instrumentation that use periodic diagnostic pulses to determine the “presence” or status of a device.
What is the heartbeat of a process machine?
The key signal, parameter, or diagnostic indicator that represents the machine’s operational health such as vibration trend, temperature stability, or critical process variable is referred to as the “heartbeat” of a process machine. The phrase also describes ongoing self-diagnostics that maintain the machine’s safe operation in contemporary smart instrumentation.
Master Control Valve Fault-Finding – Advanced HART & Fieldbus Diagnostics Quiz: Closed-Loop Control Valve Troubleshooting: HART, Fieldbus and Diagnostics Skills Quiz


 1")