Electromagnetic flowmeters are the most important tools in process industries. They monitor the volumetric flow of everything from drinking water to hazardous chemicals. For the process to work well, be safe, and bill correctly, they must be reliable. Advanced troubleshooting abilities are not just helpful for instrumentation specialists; they are essential. The test at hand puts you in real-life, complicated situations that go beyond simple inspections. It tests your understanding of safety procedures, electrical diagnostics, and how different processes interact with one other. You will need a multimeter, a sharp mind, and a strong dedication to safe work procedures in some scenarios. Get ready for a tough, hands-on test of your skills.
In instrumentation EPC (Engineering, Procurement, and Construction) projects, installing cable trays is very important for making sure that signals are sent reliably, that people are safe, and that systems work well for a long time. Unlike power cables, instrumentation cables generally transmit low-level signals, making them very sensitive to electromagnetic interference (EMI), mechanical stress, and incorrect routing techniques.
incorrect installation procedures in instrumentation cable trays can cause signal problems, make maintenance more frequent, create safety risks, and even waste a lot of time and money on projects. This document lists the most typical mistakes that EPC teams should not make while installing instrumentation cable trays to make sure the plant runs smoothly, is safe, and is in compliance.
What is an Instrumentation Cable Tray?
An instrumentation cable tray is a structured channel that holds and organizes signal, control, and communication cables in manufacturing facilities. Instrumentation trays are usually different from power tray systems in that they are:
Dedicated and separated from power trays to keep signals from getting mixed up.
Made with the right amount of shielding, spacing, and grounding in mind.
Set up to allow for future growth without interfering with current operations.
Common types of trays used in instrumentation projects include:
Ladder trays: Ladder trays are useful for long cable runs that need good airflow.
Perforated trays: Trays with holes in them are good for medium loads and some protection.
Solid-bottom trays: Solid-bottom trays are good for protecting delicate signal cables from dust and moisture.
Wire mesh trays: Wire mesh trays are great for flexible routing in data centers or control rooms.
Common Mistakes in Instrumentation Cable Tray Installation
Mistake #1: Mixing Instrumentation and Power Cables in the Same Tray
One of the worst mistakes you can make on an EPC project is to run low-voltage instrumentation cables and high-voltage power cables in the same tray. This causes inductive coupling and EMI, which can make signals noisy, readings wrong, and systems unstable.
Best Practice: Always keep your instrumentation, control, and power lines in separate trays or compartments. If you have to share trays, make sure there is enough physical space between them and use shielded connections.
Mistake #2: Improper Tray Type Selection
Choosing the improper type of cable tray for the environment can cause problems with reliability over time. For example, employing trays with holes in them in regions where there is a lot of dust or humidity could cause corrosion and a loss of signal.
Best Practice:
In places where things can corrode, including chemical industries and coastal refineries, use stainless steel trays.
Use trays with solid bottoms for delicate instrumentation cables that are exposed to EMI.
Choose ladder trays for hefty multi-core wires that need good air flow.
Mistake #3: Inadequate Planning and Poor Layout Design
Sometimes require complicated routing between process units, cable junction boxes (JBs), and Distributed Control System (DCS) panels. Not preparing ahead can lead to:
Overcrowding
Sharp bends that damage cable insulation
Difficult future maintenance
Best Practice:
Do thorough routing studies at the engineering phase.
Follow the cable requirements for the minimal bending radius.
Mistake #5: Incorrect Support Spacing and Fastening
If the tray supports aren’t right, the tray can sag, vibrate, and eventually fall apart. Even a little sagging in instrumentation trays can put stress on cables and cause grounding problems.
Best Practice:
Install supports as per specifications (e.g., 1.5–2 meters spacing depending on tray type).
Brackets, clamps, and bolts that don’t rust should be used.
Don’t mix support materials, like an aluminum tray with steel supports without insulation pads.
Mistake #6: Ignoring Grounding and Bonding
Ground loops and EMI can easily get into instrumentation cables. If cable trays aren’t properly grounded or bonded, they can send misleading signals, cause the system to trip, or even break the instrument.
Best Practice:
Make sure that the tray length is always grounded.
Use certified conductors to adequately bond all parts of the tray.
Follow rules like NEC Article 392 and IEC 61537.
Mistake #7: Poor Segregation Between Analog and Digital Cables
If you put 4-20 mA analog signal cables and digital communication wires (such Fieldbus, Profibus, Ethernet, etc.) in the same tray, they could interfere with each other and make noise.
Best Practice:
Keep separate trays or drawers for your analog and digital cords.
Keep high-speed communication connections away from power circuits and variable frequency drives (VFDs).
Follow the DCS vendor’s advice on how to separate cables.
Mistake #8: Using Low-Quality Materials and Hardware
Using cheap trays, joints, or fasteners makes it more likely that:
Corrosion and tray collapse will happen in places where chemicals or the outdoors are present.
Sharp edges can damage cables before they are needed.
Regular maintenance and unexpected downtime.
Best Practice:
Choose trays with the right anti-corrosion coating, such as hot-dip galvanized, epoxy, PVC-coated, or stainless steel.
Use good grommets, cable ties, and fasteners.
Before buying anything for an EPC project, undertake vendor audits.
EPC Project Perspective: Why Avoiding These Mistakes Matters
In significant EPC instrumentation projects, avoiding these mistakes makes:
Guarantee that the project is finished on schedule without having to do expensive rework.
Minimal noise interference with reliable DCS/PLC performance.
Following NEC, IEC, and project safety rules.
Cut down on maintenance and cable replacement to lower the cost of the life cycle.
Installing cable trays properly isn’t just about holding wires up; it’s also about making sure signals are reliable, plants are safe, and systems stay intact over time.
Installing an instrumentation cable tray needs careful planning, engineering discipline, and following the rules. EPC teams can avoid typical problems such as incorrect segregation, overloading, poor grounding, and low-quality material consumption, ensuring:
Frequently Asked Questions (FAQs) on Cable Tray Installation
What are the requirements for cable tray installation?
When installing cable trays, they must be strong, safe, and easy to get to. Use the right sort of tray, keep the support spacing between 1.5 and 2 meters, separate the power, control, and instrumentation cables, and make sure the grounding and bonding are done correctly. Leave 30 to 40 percent of the room free for future growth. For compliance and reliability, follow standards like IEC 61537 and NEC 392.
What is the IEC standard for cable tray installation?
IEC 61537 is the principal IEC standard for cable management systems for ladder and cable trays. It lays out rules for mechanical load testing, electrical continuity, corrosion resistance, and how to install things. EPC projects generally use it along with IEC 60364 to make sure that all electrical installations are safe.
What are the 5 basic cable tray types?
Ladder Tray: For heavy-duty industrial wires that need optimum air flow.
Perforated Tray: For control and signal lines in general.
Solid-Bottom Tray: For cables that need full protection.
Wire Mesh Tray: For flexible routing in control rooms.
Channel Tray: For short runs or small clusters of cables.
What are the disadvantages of cable trays?
Cable trays can rust in bad weather if they aren’t protected, need to be checked often, and can create EMI if they aren’t kept separate. They also don’t look very good and need to be properly grounded and covered in outdoor or chemical plants.
Vented trays, also known as perforated trays, can’t hold as much weight, let in dust and moisture, and may get weaker over time in corrosive situations. They aren’t great for heavy or high-voltage cables, but they perform well for light control or instrumentation circuits.
Why must conductors be installed in groups in a cable tray?
Grouping conductors keeps the route neat, makes sure the current is evenly distributed, and cuts down on electromagnetic interference. It also assists with identification, tagging, and future maintenance in EPC projects.
How many cables can fit in a cable tray?
The size of the tray, the thickness of the cable, and the fill factor all matter. Industry standards say that the tray should not be more than 70% full, keeping 30% of its capacity free for future growth or changes.
What is a major advantage of cable tray systems?
Cable trays are a versatile, safe, and cheap solution to organize cables. They make installation easier, make it easier to access for maintenance, support future modifications, and keep power and instrumentation wire separate and organized.
What is the ideal spare capacity to leave in cable trays?
It is best to leave 30–40% of the space free for future instrument extensions.
We designed an EPC Cable Tray Installation Checklist that EPC engineers and site teams can use right away to make sure that installations are safe and up to code. This application makes it easy to keep track of the best practices for design, procurement, installation, inspection, and maintenance.
For safety, efficiency, and quality control in industrial plants and process industries, it is very important to be able to detect pressure accurately. One of the most common things to measure in automation is pressure. Pressure gauges and pressure transmitters are both quite popular for this purpose.
But this is a problem that almost every instrumentation expert or technician has had to deal with in the field:
A pressure gauge and a pressure transmitter are both connected to the same process tap, but they give different readings.
This makes you ask a very critical question: Which one should you trust?
It’s not as easy as declaring “the gauge is wrong” or “the transmitter is drifting.” To fix the problem, on the other hand, you need to take an organized approach. In this essay, we’ll go into great detail about:
Why the readings on a pressure gauge and a transmitter might not match
How to systematically fix problems with differences
The function of calibration and reference standards
Why Do Pressure Gauges and Transmitters Sometimes Disagree?
It appears obvious at first that two instruments linked to the same process tap should show the same pressure. But in reality, differences are common
Some important causes are:
Calibration Drift
Transmitters are electronic devices that can lose their accuracy over time, while mechanical gauges can lose their accuracy due to wear and tear or vibration.
Accuracy Class
Most of the time, gauges are accurate to within 1-2% of full scale, although transmitters can be accurate to within 0.1% or greater. This discrepancy can be big, depending on the range of pressure.
Hydrostatic Head Effect
The liquid column creates pressure discrepancies if the gauge and transmitter are at different heights.
Impulse Line Issues
If there are blockages, air pockets, or leaks in the tubing, it might cause readings to be wrong or take a long time.
Step 1: Isolate and Test with a Reference Standard
When it comes to metrology, the most important thing to remember is to never accept a measurement until it has been checked against a reference.
If two instruments don’t agree, the first thing to do is to compare them to a calibrated reference standard.
How to Do It:
Take the process tap out of the system.
Connect an outside pressure source, like a hand pump or a deadweight tester, to both the gauge and the transmitter.
Use a digital pressure calibrator with excellent precision as a reference.
Slowly add pressure and check the readings on all three devices at different places in the range (zero, mid-span, and full-scale).
The digital calibrator is like a “referee.” It’s possible that the gauge is out of calibration if it shows deviation. If the transmitter’s signal drifts away from the reference, it needs to be fixed or adjusted.
Instead of guessing, this exam gives a clear, objective response.
Step 2: Check Installation and Process Conditions
Sometimes the problem isn’t with the instruments themselves, but with how they are set up.
Elevation Difference
In liquid service, even a little change in height can change the readings. Hydrostatic head will cause a transmitter located 1 meter below a gauge to observe an extra 0.1 bar (around 1.45 psi).
Impulse Line Orientation
If impulse lines are not routed correctly, they may trap air (in liquid service) or condensate (in gas/steam service).
This causes readings that are wrong or take too long to come in.
Mechanical Stress
If gauges are exposed to vibration or pulsating pressure, their pointers can get damaged or “flutter.”
In these circumstances, you should put in a snubber or dampener.
Even when the instruments are set up correctly, discrepancies in how they are installed can cause readings to be wrong.
In liquid pressure applications, a variation in height is one of the most typical causes. If the pressure gauge is higher or lower than the transmitter, a hydrostatic pressure head (or drop) is created.
For example:
For instance, a gauge that is located below the transmitter will display a larger pressure due of the weight of the liquid column above it.
On the other hand, if it’s mounted above, it might read a little lower.
Even modest changes in height can make a difference for water. For example, a vertical height of 10 cm is equal to around 10 mbar (0.145 psi) of pressure difference. Other elements that affect installation are:
Design and route of the impulse line: Signal lag or pressure loss can happen when lines are too long or not straight.
Orientation: If a transmitter is installed wrong (such upside down), it can trap air or fluids and change the data.
Effects of temperature: Extreme heat or cold can harm the electronics in gauge bourdon tubes or transmitters.
It’s usually a good idea to look over the installation plans and make sure that the instruments are installed appropriately, vented or drained properly, and exposed to the identical process conditions.
Step 4: Look for Blockages or Leaks
The connections between instruments are generally the weakest parts of a process system.
Blockages: An impulse line may be partially blocked by scale, rust, or process debris, which can make one instrument lag behind.
Leaks: Even a small leak can make the needle on a gauge go back toward zero over time.
Problems with the valves: The root valves, manifold valves, or gauge cocks may not be fully open, which might cause measurement mistakes.
To do a fast field check, vent the line and see if both instruments always go back to zero.
Step 5: Understand Instrument Accuracy and Limitations
Not all instruments are created equal in terms of accuracy and stability.
Most of the time, a pressure gauge is a basic machine. Its bourdon tube or diaphragm moves when pressure is applied, and the needle points to the value on a dial. Gauges are tough and easy to read, but they can break down, have hysteresis, and make parallax mistakes. Depending on the quality and class of the gauge, their accuracy is usually within ±1% to ±2% of full scale.
A pressure transmitter, on the other hand, changes pressure into an electrical signal and sends it to a control system. Transmitters of high grade can be accurate to within ±0.04% or better. But they need to be calibrated every so often to stay accurate, and they may wander over time because the sensors get older, the temperature changes, or the electrical parts wear out.
In a variety of circumstances, the transmitter is more accurate, although it can still drift.
Therefore:
So, don’t assume the gauge is faulty just because it’s mechanical.
Don’t assume that the transmitter is correct just because it is digital.
Sometimes, the difference isn’t because of the instruments themselves, but because the method is always changing.
For instance:
The gauge pointer may move up and down when there are pressure pulsations or surges in the line, but the transmitter (which electronically averages signals) may indicate a steady value.
Changes in temperature can make gas or liquid that is trapped expand, which changes the reading.
When equipment nearby vibrates, it can change the readings on the gauge.
In certain situations, putting in a snubber, pulsation dampener, or capillary system might make the readings more stable and make the instrument last longer.
Knowing how the process works can help you avoid making mistakes that look like instrument errors.
Step 7: Review Calibration and Maintenance Records
Looking at the instrument’s calibration history is an important aspect of any troubleshooting effort.
Look at the last time each instrument was calibrated and the conditions it was in. If the transmitter hasn’t been calibrated in a long time (months or years), drift is very likely. Also, if the gauge hasn’t been changed or checked recently, mechanical fatigue could be making it less accurate.
A good calibration management program makes sure that both types of instruments work within acceptable tolerance limits.
In many plants, the pressure gauge is merely a local indicator, while the transmitter sends the control signal to the system. But if the operator uses the gauge to make decisions, it needs to be taken care of just as carefully as the transmitter. Complete Pressure Transmitter Commissioning Checklist for Field Engineers: Pressure Transmitter Commissioning Checklist
Step 9: Verify Environmental and Process Effects
Temperature, humidity, and vibration are some of the environmental elements that can have a big impact on how accurate an instrument is.
For example:
If the temperature around a pressure gauge is too high, the bourdon tube inside it may expand, which can cause drift.
Transmitters close to vibrating machinery may have unstable signals.
Fittings and seals can break down in corrosive environments, which can cause leaks.
To mitigate these effects:
To reduce vibration, use gauges with casings filled with liquid.
Install transmitters with the right mounting brackets and insulation.
Use protective housings or shields in places where the weather is bad.
These steps not only cut down on reading errors, but they also make the instruments more reliable and last longer.
Step 9: Make an Informed Decision
You can be sure which instrument is right once the verification and inspection processes are done.
If the transmitter and the calibrator are in the same area, but the gauge is not, the gauge should be recalibrated or replaced. If both readings match the calibrator but not the service, check the installation height, line blockage, or process conditions.
Always make the choice based on test results, not on what you think.
Scenario 1: The Transmitter Is Right – Condensate in Impulse Line
A pressure gauge and transmitter are both put on the same tap in a high-pressure steam condensate return line. The gauge says 42 bar, and the transmitter says 39.8 bar.
The transmitter looks strange at first. But when you use a digital pressure calibrator to verify both instruments, they are both completely in calibration.
Upon further examination, it is clear that the transmitter is connected via a long horizontal impulse line that holds condensate. The hydrostatic head from this column of liquid makes the transmitter read lower while it is working.
After draining and rerouting the impulse line with the right slope, both readings are now 39.8 bar.
Conclusion: The transmitter was right; the wrong discrepancy was caused by a bad impulse line installation and too much condensate buildup, not by calibration drift.
Scenario 2: The Gauge Is Right – Ground Loop Affecting Transmitter
Operators discovered that the DCS measurement (from the transmitter) indicated 156 bar but the local gauge always showed 150 bar in a hydraulic test circuit that was working at about 150 bar.
Calibration checks showed that both instruments were correct, but the difference still existed. The investigation found that the signal was not properly grounded at two spots, which caused a ground loop that caused a voltage offset in the 4-20 mA loop.
The DCS value steadied at 150 bar, which matched the gauge, when the grounding was fixed to a single-point shield termination.
Conclusion: The gauge was right, and the transmitter output error was caused by electrical noise and double grounding, not sensor imperfection.
Key Takeaways from These Advanced Scenarios
Not all differences are caused by calibration drift; installation design, dynamic process behavior, and electrical integrity are also important factors.
A transmitter may seem wrong during process upsets, but it could be showing true transient situations that a mechanical gauge can’t pick up.
On the other hand, a transmitter can give false information if there are problems with the signal conditioning or grounding that change the measurement, even if the sensor itself is correct.
To do a true root-cause analysis, you need to know how to troubleshoot both mechanical and electrical problems, as well as how process dynamics affect instrumentation.
Refer the below link for the Top Factors Affecting Pressure Transmitter Accuracy – What Every Engineer Should Know
Some people could say that a slight variance in readings is not important. But in a lot of cases, accuracy is important for safety, quality, and efficiency.
Safety: If the measurements in boilers, reactors, or pipes are wrong, there is a risk of overpressure.
Process Control: If the transmitter readings are wrong, the DCS/PLC may not work as well as it should.
Compliance: Many industries, like oil and gas, pharmaceuticals, and food processing, have severe calibration rules that they have to follow.
If not taken care of, even a “simple” pressure gauge might be a weak link.
Future Trends – Digital Gauges and Smart Transmitters
Technology is closing the distance between gauges and transmitters.
Digital pressure gauges now provide better accuracy, built-in data logging, and the ability to send data wirelessly.
Smart Transmitters have diagnostics, prompts for self-calibration, and the ability to be monitored from afar using IIoT platforms.
In the near future, there may be less differences between instruments as they become self-verifying. But for now, engineers still have to use systematic troubleshooting.
It can be disturbing as well as hazardous to leave things alone when a pressure gauge and transmitter show contradictory readings. But if you take your time and test against a reference, verify the installation, look at the impulse lines, and think about how accurate the instrument is, you may be sure of which measurement to believe.
It’s not safe to guess when it comes to measuring pressure. You can only trust something if you check it, calibrate it, and use good technical judgment. This is true for a boiler, a chemical reactor, or even just a basic conduit.
The correct answer is not “gauge versus transmitter”; it is the one that matches the reference standard.
Why Accurate Oxygen Measurement Matters in Process Industries
Accurate oxygen measurement is very important in the modern process industries to make sure that combustion is efficient, that safety is maintained, and that emission criteria are satisfied. The Zirconia Oxygen Analyzer is one of the most accurate, stable, and reliable analyzers available, even at high temperatures.
We’ve made an easy-to-use but powerful Zirconia O₂ Analyzer Nernst mV Output Calculator (Excel Tool) to make the complicated Nernst-based voltage calculations that these analyzers use easier. This free calculator does all the math for you, so engineers, technicians, and learners may quickly find out the mV output of a zirconia oxygen sensor under any process scenario.
A zirconia oxygen analyzer uses a solid-state electrochemical cell to find out how much oxygen is in a process gas. The main part of the sensor is a ceramic element made of zirconium dioxide (ZrO₂) with porous platinum electrodes on top. When heated to between 600 and 1000 degrees Celsius, zirconia becomes an oxygen-ion conductor.
The sensor makes an electrical potential (voltage) that changes based on the difference in oxygen partial pressure between:
The reference gas is commonly air, which has 20.9% oxygen.
The sample gas (process or flue gas with different amounts of oxygen)
The Nernst equation regulates this potential difference. It is the scientific basis for all oxygen measurements that use zirconia.
The Nernst Equation Behind Oxygen Measurement
The Nernst equation shows how the voltage changes with the oxygen concentration:
Where:
E = EMF (Electromotive Force) in millivolts (mV)
R = Universal gas constant (8.314 J/mol·K)
T = Absolute temperature in Kelvin
F = Faraday constant (96,485 C/mol)
Pₒ₂(ref) = Oxygen partial pressure of the reference gas
Pₒ₂(sample) = Oxygen partial pressure of the process gas
In normal circumstances, the reference gas is always the same (usually ambient air with 0.2095 atm O₂), while the sample oxygen content changes based on how the combustion or process is going.
The sensor’s voltage (E) output is directly related to the logarithmic ratio of the two oxygen partial pressures. It changes with temperature.
The sensor’s voltage (E) output is directly related to the logarithmic ratio of the two oxygen partial pressures. It changes with temperature.
Introducing the Zirconia O₂ Analyzer Nernst mV Output Calculator
This Excel tool will tell you exactly how many millivolts a zirconia oxygen sensor will put out based on the temperature and the amount of oxygen in the air. This calculator gives you quick, accurate answers whether you’re constructing combustion control systems, calibrating analyzers, or learning about how to measure oxygen.
Key Features of the Calculator
Automatically calculating the Nernst voltage for a set of process and reference conditions
Quick access to preset settings including Air, Flue Gas, and Pure O₂
You can set the oxygen fraction or temperature to whatever you want.
Changing the temperature from °C to K in real time
Easy-to-use user interface with clear formatting and fields that are automatically calculated
No macros or add-ins are needed; it works in regular Microsoft Excel.
Excellent for engineers, technicians, and students that work with process and combustion control
Refer the below link for the For Reliable and Precise Oxygen Measurement: 9 Step Zirconia Oxygen Analyzer Calibration Procedure
It can be a pain to solve the Nernst equation by hand, especially when the temperature changes and the relationships are logarithmic. This calculator takes away the guesswork and gives you exact numbers right away.
Saves time: No manual formula work or logging computations
Better Correctness: Lessens mistakes in process design and calibration calculations
Helps Training: Great for teaching Nernst ideas in the classroom or at work. It also makes troubleshooting easier. Helps check the operation of the analyzer during service or maintenance.
Increases Process Efficiency: Allows for fast O₂ analysis for adjusting combustion and improving emissions
The Zirconia O₂ Analyzer Nernst Calculator has a clear and logical approach. This is how to utilize it:
1. Input Gas Selection
In Cell B3, use the dropdown menu to choose the gas setting you want:
Air (21% O₂)
Flue Gas (5% O₂)
Pure O₂ (100%)
For easy setup, each preset automatically fills in the correct oxygen partial pressure.
If the amount of oxygen in your process gas is different, just overwrite the cell and type in your own value.
2. Set the Temperature
For example, 700°C, 800°C, or 900°C, enter the operating temperature in °C. The calculator automatically converts this to Kelvin (K) internally using the formula:
T(K)=T(°C)+273.15
3. Reference Gas Input
The reference gas is set to air (0.2095 atm O₂) by default, however you can change it if your analyzer uses a different reference atmosphere, like controlled calibration gas.
4. Get Instant Results
After the data is supplied, the calculator uses the exact values for R, F, and temperature correction to figure out the Nernst EMF (mV) output. The answer is the voltage output that the zirconia cell should give under the given conditions.
Practical Examples of Zirconia Analyzer Calculations
Here are some real-life instances of how this calculator can help:
Example 1: Measuring Flue Gas Oxygen
Conditions:
Reference Gas = Air (0.2095 atm O₂)
Sample Gas = Flue Gas (0.05 atm O₂)
Temperature = 800°C (1073 K)
Calculated Output: The calculator says about +46 mV, which means that the flue gas has less oxygen than the reference air. This helps operators get the air-to-fuel ratio just right for good combustion.
Example 2: Process Gas with 10% Oxygen
Conditions:
Reference Gas = Air
Sample Gas = 0.10 atm O₂
Temperature = 750°C (1023 K)
Calculated Output: The mV output is positive but smaller (around 29 mV), which is what you would expect since the difference in O₂ partial pressure is also less.
Example 3: Pure Oxygen as Sample Gas
Conditions:
Reference Gas = Air (0.2095 atm O₂)
Sample Gas = 1.00 atm O₂
Temperature = 700°C (973 K)
Calculated Output: The calculator shows a negative mV result (-48 mV) because the sample gas has more oxygen than the reference gas.
These outputs are what a genuine analyzer would do, and they can be used to check calibration data or field measurements.
Industrial Applications of Zirconia Oxygen Measurement
This Nernst-based oxygen computation works in several fields:
Industry
Application
Purpose
Power Generation
Boiler and furnace flue gas analysis
Combustion optimization
Petrochemical Plants
Process heater monitoring
Energy efficiency & emission reduction
Cement Industry
Kiln O₂ measurement
Product quality and fuel savings
Steel Production
Furnace gas control
Reducing atmosphere control
Glass Manufacturing
Furnace O₂ balance
Clarity and defect prevention
Environmental Monitoring
Stack emissions
Compliance and reporting accuracy
The Excel application lets professionals in all of these fields understand and model how O₂ measurements change without having to buy expensive simulation tools.
For calibration verification, compare the real analyzer voltage to the theoretical Nernst output.
Training and Education: Show technicians how to use zirconia analyzers to turn oxygen levels into quantifiable voltages.
Combustion tuning means adjusting the air-fuel mix in boilers, kilns, or incinerators to make them work better.
Sensor Diagnostics: Compare field data to computed findings to quickly find drift or a problem.
Refer the below to Ensure Accuracy and Long-Term Sensor Performance: Step by Step Preventive Maintenance Procedure for Zirconia Type Oxygen Analyzer with Checklist
1. What is the typical output range of a zirconium dioxide oxygen sensor?
A zirconium dioxide (ZrO₂) oxygen sensor usually gives an output voltage between 0 and 1 volt (V), depending on how much oxygen is in the sample gas compared to the reference air.
At high oxygen concentration (lean mixture), the output voltage is low (0.1 V or less).
At low oxygen concentration (rich mixture), the voltage increases up to 0.9 V.
The output of industrial zirconia analyzers can also be scaled to 4=20 mA, which is the same as the oxygen concentration or the predicted partial pressure.
2. What is the voltage of the zirconia oxygen sensor?
The Nernst equation, which connects the difference in oxygen partial pressures on both sides of the zirconia cell, is what makes the zirconia oxygen sensor’s voltage output. Typical voltage range:
For ordinary automotive or combustion applications, the typical voltage range is 0.0 to 1.0 V (millivolt level precision).
The sensor EMF can be anywhere from 0 to 1200 mV, depending on the temperature (typically between 600 and 800°C) and the amount of oxygen in the air.
The logarithm of the ratio of the partial pressure of oxygen is what this voltage is based on.
3. What is the working principle of a zirconia O₂ analyzer?
The electrochemical Nernst principle is what makes a zirconia oxygen analyzer work. The sensor has a ceramic element made of zirconium dioxide (ZrO₂) on both sides that is covered in porous platinum electrodes. When zirconia is heated to more above 600°C, it can carry oxygen ions.
Here’s how it works:
One side of the sensor is open to a known reference gas (air), and the other side is open to the process gas.
Oxygen ions flow through the zirconia because the concentration of oxygen is different.
This passage of ions creates an electromotive force (EMF) that can be measured.
After that, the Nernst equation is used to figure out the oxygen concentration or partial pressure in the sample gas from the EMF.
This approach makes zirconia analyzers very dependable for controlling combustion, keeping an eye on flue gas, and working in an inert atmosphere.
4. What is the chemical reaction of the oxygen sensor?
The chemical process that happens at the electrode surfaces of a zirconia oxygen sensor is an electrochemical redox reaction that involves oxygen molecules and ions.
At the cathode (reduction side):
O2+4e−→2O2−
At the anode (oxidation side):
2O2−→O2+4e−
As a result of these processes, oxygen ions move through the zirconia electrolyte, creating a voltage potential that depends on the difference in oxygen partial pressures between the two sides.
5. What is the output of the oxygen sensor?
A zirconia oxygen sensor gives off a voltage (EMF) signal that comes from the Nernst equation.
In practice, the sensor output can be anything from a few millivolts to roughly 1200 mV, depending on the amount of oxygen and the temperature at which it is working.
6. What is the ppm level of an oxygen analyzer?
A zirconia oxygen analyzer can find oxygen levels from very low levels (trace ppm) to very high levels (100% oxygen). Typical measuring ranges include:
Common measuring ranges are 0 to 1000 ppm O₂ for situations that are inert or decreasing.
0.1% to 25% O₂ (for controlling flue gas or combustion)
Some analyzers can automatically switch between ranges depending on the procedure.
The ppm capability depends on the temperature of the sensor, the design of the cell, and the calibration reference gas.
7. What is the voltage of the O₂ sensor?
The voltage of the O₂ sensor is the electromotive force (EMF) that the oxygen partial pressure differential creates across the zirconia electrolyte.
For standard automobile O₂ sensors, the range is 0.1 to 0.9 V.
For industrial zirconia oxygen analyzers, the voltage can go up to 1200 mV (1.2 V), depending on the temperature of the sensor and the composition of the gas.
This voltage stabilizes quickly at high temperatures (around 700 – 800°C), making it possible to monitor the amount of oxygen in combustion gases or process streams in real time and with great accuracy.
The Zirconia Oxygen Analyzer Nernst mV Output Calculator is more than just an Excel sheet; it’s a useful engineering tool that connects what you learn in class with what you do in the field. This calculator makes complicated calculations easy and gives you a quick, dependable answer, whether you’re trying to enhance combustion efficiency, keep an eye on flue gas, or calibrate an oxygen analyzer.
It has built-in defaults, accurate constants, and a straightforward layout that make it easy to grasp how oxygen concentration and voltage are related.
Download it today to learn more about zirconia-based O₂ measurement and how to use the Nernst equation in real life.
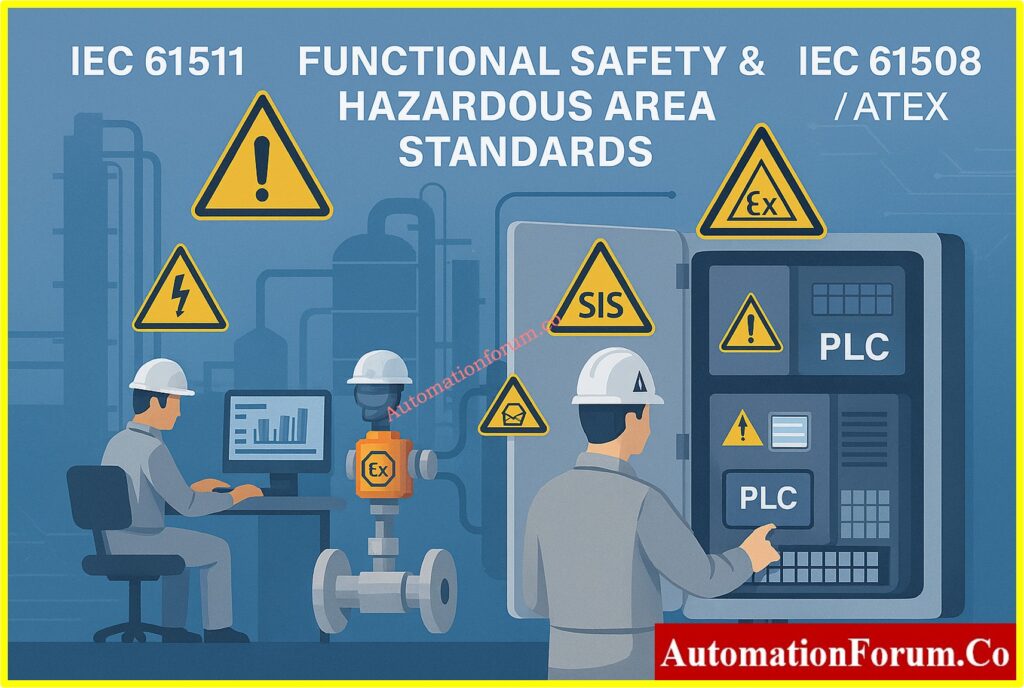
Standards are the language of trust in the fast-paced world of process and industrial automation. Instrumentation & Control (I&C) engineers depend on international standards a lot to make sure that systems are safe, work with other systems, are efficient, and are ready for the future. This is true whether they work in oil and gas, power generation, petrochemicals, water treatment, or manufacturing.
Without these standards, each plant would run on its own, with gadgets that don’t work together, unsafe installations, and designs that aren’t particularly effective. For an instrumentation engineer, learning these standards isn’t just something they do in school; it’s the basis of their work.
This article looks at the most important standards for instrumentation and control from IEC, ISO, ISA, IEEE, NFPA, API, ATEX, and NAMUR. This will be your go-to resource for understanding I&C standards since we will talk about their breadth, importance, and how they may be used in real-world situations.
Why Standards Important in Industrial Instrumentation
Before we go into the details of specific standards, let’s tackle the basic question: Why are standards so important in industrial automation?
Safety: Process industries work in dangerous places, like places with explosive gases, poisonous chemicals, and high-pressure pipelines. Standards like IEC 61511 and IEC 60079 make sure that safety is built into every layer.
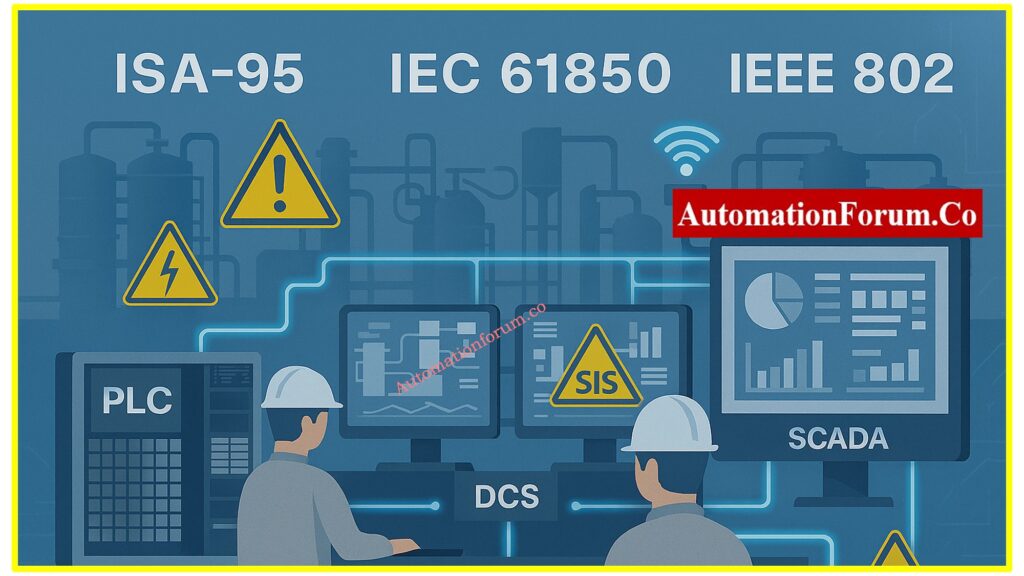
Interoperability: Interoperability means that devices made by various companies must be able to talk to each other without any problems. Standards like IEC 61850, IEEE 802.x, and ISA-95 make ensuring that systems may work together without being locked into a single vendor.
Quality & Reliability: ISO and IEC standards make sure that design, calibration, and testing are all done the same way, which makes systems more reliable over time.
Regulatory Compliance: Compliance with the law: In some places, standards like ATEX and NFPA are required to make sure that the company follows all domestic and international rules.
Future-readiness: Digitalization, IIoT, and cybersecurity risks are all things that can happen in the future. Modern standards like IEC 62443 and IEC 62828 help keep plants safe.
In summary, standards provide engineers peace of mind since they know their systems are based on frameworks that have been tested.
IEC (International Electrotechnical Commission) Standards
The IEC is probably the most important group for engineers who work with instruments. Some important IEC standards are:
IEC 60079 – Electrical Equipment for Explosive Atmospheres (Ex): If you work with flammable gases, vapors, or dusts, you must follow IEC 60079. This series of standards sets rules for electrical equipment that will be used in places where there is a chance of an explosion. It talks about everything from how to classify equipment (Ex d, Ex e, Ex i, Ex n, etc.) to how to install it and what the inspection criteria are.
Instrumentation engineers who operate in the oil and gas, chemical processing, or pharmaceutical industries need to know about Zone classification (Zone 0, 1, and 2 for gases; Zone 20, 21, and 22 for dusts) and how to choose the right equipment to avoid catastrophes.
IEC 61131 – Programmable Controllers (PLC): PLCs are very important for modern industrial automation, and IEC 61131 gives them a standard way to be programmed and used. Part 3 of this standard is very important since it lists five programming languages: Ladder Diagram (LD), Function Block Diagram (FBD), Structured Text (ST), Instruction List (IL), and Sequential Function Chart (SFC).
Engineers may write code that is easy to maintain and move around by using these standardized programming methods. This also makes it easier for teams from different countries to work together on projects when each team may have its own programming style.
IEC 61508 – Functional Safety of E/E/PE Systems: IEC 61508 is the basic standard for the functional safety of electrical, electronic, and programmable electronic safety-related systems. It presents the idea of Safety Integrity Levels (SIL 1 to 4), which measure how reliable safety functions need to be.
This standard is used in all industries and is the basis for variants that are special to a certain industry. For instrumentation engineers, it gives them the tools they need to develop systems that consistently and predictably stop or lessen dangerous events.
Operation and Maintenance: Keeping safety performance high over time
Modification and Decommissioning: Making sure modifications are safe
I can say for sure that IEC 61511 is necessary because I have read it a lot. It goes into great detail about how to implement functional safety, from risk and hazard assessment to proof testing and change management. Not only should every instrumentation engineer who works on process safety know this standard, they should also study it in depth.
IEC 61850 – Communication Networks for Power Utility Automation: IEC 61850 sets the rules for communication and data models for substation automation for instrumentation engineers who work in power production, transmission, and distribution. It allows protective relays, meters, and control systems from multiple suppliers to work together, which is a big step forward from proprietary protocols.
IEC 62381 – Factory Acceptance Test (FAT) for Automation Systems: This standard tells you how to test automation systems before they are delivered to a site. Saves time and stops mistakes that cost a lot of money.
IEC 62443 – Cybersecurity for Industrial Automation & Control: Cybersecurity has become a major issue as industrial systems grow more networked. IEC 62443 is a complete set of rules for making and keeping industrial automation and control systems (IACS) safe. It talks about security throughout the system’s life cycle and sets security levels, zones, and conduits for network segmentation, which are all important things for modern instrumentation engineers to know.
IEC 62828 – Smart Sensors: This standard sets standards for digital interfaces for smart sensors used in industry. Very important for engineers who want to work in Industry 4.0 and IIoT.
Key takeaway: The most important thing to remember is that IEC standards form the basis for I&C engineering around the world. They make sure that all industries are safe, work together, and are reliable.
ISO (International Organization for Standardization) Standards
ISO standards help with quality management, calibration, and measuring methods for instruments. Some important examples are:
ISO 9001 – Quality Management Systems: ISO 9001 principles are used to make sure that engineering projects are of high quality, even though they are not exclusive to instrumentation. Instrumentation engineers can help with continuous improvement projects and keep up with documentationstandards if they know the principles of quality management.
ISO/IEC 17025 – Testing & Calibration Laboratories: Sets standards for what calibration labs need to know and be able to do. This standard must be followed by labs that calibrate transmitters or gauges.
ISO 5167 & ISO 2186 – Flow Measurement Standards: In process industries, it is very important to quantify flow accurately. These standards set the rules for differential pressure flow meters, such as orifice plates, venturi tubes, and nozzles. Using the right tools makes sure that measurements are accurate and that custody transfer and process control applications follow the rules.
ISO 15926 – Data Integration for Oil, Gas & Process Industries: It’s hard to integrate data across lifecycle phases and disciplines in big factories. ISO 15926 gives a standard way to model process plant data, making it easier for engineering tools, asset management systems, and operational platforms to share data.
Key takeaway: The main point is that ISO makes sure that measurements are correct and that quality is managed, so that data is accurate and reliable.
American Standards (ANSI / ISA / API / NFPA / NEMA)
The U.S. has made a lot of progress in setting standards for instruments, and many of them are used around the world:
ISA-5.1 – Instrument Symbols & Identification: Instrumentation engineers all speak this standard language. ISA-5.1 tells you what the symbols and characters used in Piping and Instrumentation Diagrams (P&IDs) mean. Engineers that know this standard may properly express their design goals to others in different fields and companies all around the world.
ISA-18.2 – Alarm Management: Too many alarms might cause problems in the process. ISA-18.2 gives you a complete set of rules for how to build, set up, and keep up alarm systems that work. It stresses how important it is to rationalize alarms, cut down on false alarms, and make sure that operators only get useful, actionable information.
API 551-555 – Process Measurement & Analyzers: The American Petroleum Institute’s 550-series standards give clear instructions on how to use process analyzers, control systems, and measurement technologies that are particular to oil and gas and petrochemical applications. These practical standards give useful advice on how to put things into practice that goes beyond just general rules.
NFPA 70 (NEC) – National Electrical Code: NFPA 70 sets the rules for electrical installations for instrumentation engineers in North America. Article 500 is very important for dangerous places. To make sure that installations are safe, you need to know how NEC Class/Division and Zone categorization systems work.
NFPA 72 – Fire Alarm & Signaling Systems: Very important for engineers that work on safety systems and integrating fire detection.
NEMA Standards – Industrial Control Equipment
The National Electrical Manufacturers Association (NEMA) sets criteria for industrial control equipment, such as enclosure ratings (NEMA 4, 4X, etc.) that instrumentation engineers must choose based on the conditions in which the equipment will be used.
Key takeaway: The main point is that U.S.-based standards like ISA, API, NFPA, and NEMA are very useful and are often used in projects around the world.
NAMUR (a German user association for automation technology in process industries) provides practical guidelines and best practices.
Focus on user needs rather than just manufacturer requirements.
Widely used in Europe, especially in chemical and pharmaceutical industries.
Recommendations like NAMUR NE43 (transmitter fault signal) are applied globally.
Key takeaway: NAMUR ensures standards stay practical and user-driven, not just theoretical.
How Engineers Apply Standards in Real Projects
It’s one thing to know the standards; it’s another to use them correctly. Instrumentation engineers apply standards in a number of ways in real-world projects:
During the design phase, making sure that P&IDs follow ISA-5.1 and that safety systems are made according to IEC 61511.
When buying things, you need to make sure that the equipment is ATEX/IECEx certified for dangerous regions.
During Installation: Following NFPA 70 (NEC) and EN 60079 for wiring in areas where explosions could happen.
During Commissioning: Following IEC 62381 to do FAT/SAT to make sure the system works as it should.
During Operation: Putting into place alarm management (ISA-18.2) and cybersecurity (IEC 62443) techniques.
During Maintenance: Making sure that calibration labs follow ISO/IEC 17025 and proof testing according to IEC 61511.
To put it simply, standards aren’t just “books on a shelf.” Engineers utilize them every day to develop, run, and keep factories running smoothly.
Future Trends in Instrumentation Standards
Standards are changing quickly, just like industrial automation. Engineers need to keep an eye on these new areas:
Digital Twins: Standards will change over time to make sure that the data between real-world objects and their digital copies is the same.
IEC 62828 and IEEE 1451 are two steps toward making IIoT devices that can be plugged in and used right away.
Cybersecurity Integration: As cyber threats becoming more advanced, IEC 62443 will need to be updated.
AI in Automation: Standards will soon spell out the best ways to use AI for predictive maintenance and finding problems.
Green and Sustainable Engineering: There will be more focus on keeping track of emissions, using less energy, and being responsible for carbon.
This means that young engineers will always be learning. Keeping up with changing expectations is no longer a choice; it’s the key to moving up in your job.
IEC 61511 is one of the most important standards that should be mentioned. It talks about the functional safety lifecycle of SIS in process industries, such as hazard and risk assessment (HAZOP, LOPA).
If you operate in oil and gas, petrochemicals, or power plants, you need to study IEC 61511.
Instrumentation and control standards are what make modern industrial automation possible. These standards affect the job of every engineer every day. They include everything from making sure people are safe in explosive environments (IEC 60079, ATEX) to digital integration (ISA-95, ISO 15926) and cybersecurity (IEC 62443).
Young engineers can gain reputation and skills by learning these standards. For professionals with expertise, remaining up to date is important for compliance, safety, and efficiency.
Standards are more than just rules. They represent the combined knowledge of thousands of engineers from around the world and a strategy for plants that are safe, reliable, and ready for the future.
FAQ on Key Instrumentation & Control (I&C) Standards
What are the standards of instrumentation?
International standards for instrumentation, such as IEC, ISO, ISA, IEEE, NFPA, ATEX, and NAMUR, set rules for how to keep process control systems safe, design them, calibrate them, test them, communicate with them, and integrate them.
What does a controls engineer need to know?
A controls engineer needs to know how to program PLCs and DCSs, follow instrumentation standards, read P&IDs, work with safety systems (IEC 61511), industrial communication protocols, troubleshoot, and put automation systems together.
What skills do instrumentation engineers need?
Instrumentation engineers need to know how to monitor processes, use control systems like PLC/DCS, tune loops, make P&IDs, follow safety requirements, calibrate equipment, fix problems, be aware of cybersecurity, and write project documentation.
What is ICA in instrumentation?
Instrumentation, Control, and Automation (ICA) is the name for the tools, systems, and technologies used to measure, control, and automate industrial processes.
What does I&C technology involve?
To make sure that industrial plants run safely, reliably, and efficiently, I&C technology includes sensors, transmitters, control valves, PLC/DCS systems, SCADA, safety systems, communication networks, and software integration.
Why is IEC 61511 important for instrumentation engineers?
IEC 61511 is important because it sets the standards for the whole functional safety lifetime of Safety Instrumented Systems (SIS) in process industries. This makes sure that systems are built, tested, and kept up to date to provide reliable protection.
What is the difference between IEC 61508 and IEC 61511?
IEC 61508 is a general standard for functional safety in all industries. IEC 61511, on the other hand, is only for Safety Instrumented Systems in the process industry and gives engineers practical advice.
What does the ATEX directive cover in instrumentation?
The ATEX directive (2014/34/EU) makes sure that all equipment and safety systems used in the EU’s explosive atmospheres are tested, certified, and safe to use.
How do NAMUR recommendations help instrumentation engineers?
NAMUR recommendations are useful, user-driven rules for automation and instrumentation in process industries. They focus on how well things work in the actual world, such NAMUR NE43 for alerting transmitter faults.
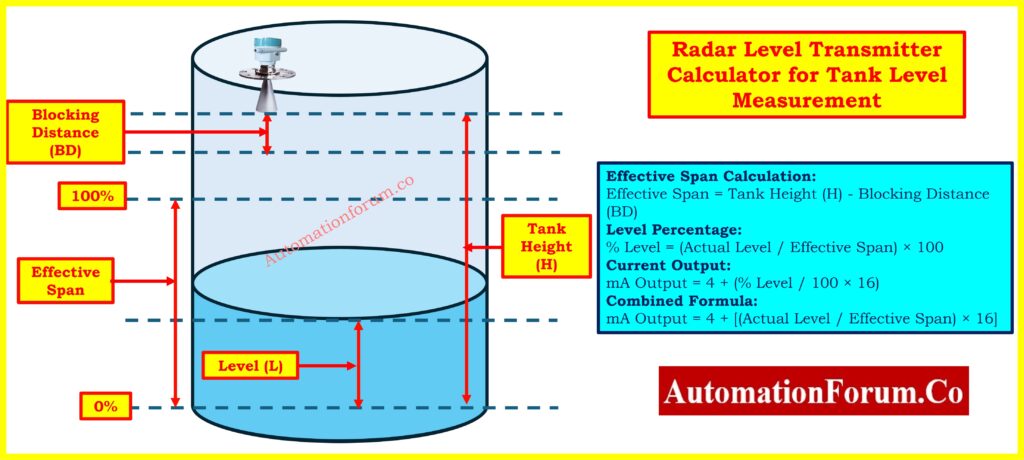
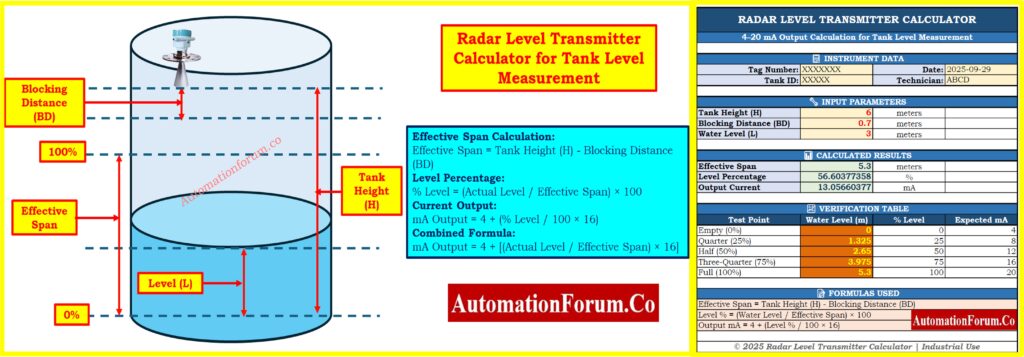
For precise level measurement, radar level transmitters are commonly employed in water treatment plants and process industries. Radar transmitters employ microwave waves to figure out how far away the sensor is from the surface of the liquid. This is different from mechanical floats or pressure-based devices. Then, this measurement is changed into the real water level in the tank and shown as a normal 4-20 mA signal so that it may be used with PLCs, SCADAs, or DCS systems.
This complete guide gives engineers and technicians useful equations they may use to rapidly figure out the 4-20 mA output of a radar level transmitter based on the height of the tank, the distance it needs to be blocked, and the current water level. We also show you how to do the computation step by step so you can double-check field data, make calibration sheets, or fix problems when the real level and transmitter output don’t match.
To make this easier, we’ve created a downloadable Excel calculator that automatically converts tank level into 4-20 mA output considering blocking distance. You can download it below
Blocking Distance (BD) is an important part of radar level measurement that people often forget about. It means the shortest distance from the radar antenna where measurements can’t be made properly. This dead zone is there because the radar sensor needs time to convert from sending to receiving after sending out the electromagnetic wave.
Key Points About Blocking Distance:
Typical Range: 0.1 to 0.5 meters (depends on the radar frequency and the maker)
Frequency Dependence: Compared to lower frequency units (6 GHz or 26 GHz), higher frequency radars (80 GHz) usually have shorter blocking distances.
Installation Consideration: The transmitter must be situated so that the blocking distance stays above the highest fill level that is expected.
Measurement Span: The effective measuring span is the height of the tank less the distance that blocks it.
Configuration: Always set the transmitter to the effective span, not the full height of the tank.
If you don’t pay attention to blocking distance when you set things up:
The transmitter will give you wrong readings when the level is close to full.
When the tank is almost full, you can see error codes or fault situations.
The point of 100% calibration will be inaccurate.
Field measurements won’t match what the transmitter sends out.
Visual Understanding
Referring to the tank diagram:
Top Section: Blocking Distance (dead zone) – can’t be measured
Middle Section: The Effective Span is where the 100% level is set.
Full Range: From 0% (the bottom of the tank) to 100% (the top of the effective span)
Empty Distance: The distance from the water’s surface to the bottom of the tank when it is empty.
How Radar Level Measurement Works
Principle of operation
A radar level transmitter sends out electromagnetic waves with high frequencies, usually 6 GHz, 26 GHz, or 80 GHz. The waves go from the transmitter down to the surface of the water and then return to the antenna. The time it takes for the wave to come back (time of flight) is measured very carefully and turned into a distance measurement.
Level (L) = Tank Height (H) – Measured Distance (D)
But in most industrial settings, technicians and engineers don’t need to figure out how long it takes for something to fly or how long it takes for a wave to travel. What matters instead is how to change the actual level into a percentage and subsequently into the typical 4-20 mA signal that control systems can recognize.
Calculate the effective span: Effective Span = Tank Height – Blocking DistanceEffective Span = 6 – 0.3 = 5.7 meters
This 5.7 meters is your actual measurement range for calibration.
Step 2 – Measure Actual Water Level
Find out the real water level from the bottom of the tank by using a dip tape or a reference measurement. For this example, let’s say the water level is 2.85 meters below the surface.
Let’s figure out the outputs of the transmitter at different water levels, taking into consideration the blocking distance, to make the idea clearer.
Example 1 – Tank Empty
Tank Height: 6 m
Blocking Distance: 0.3 m
Effective Span: 5.7 m
Actual Level: 0 m
% Level = 0/5.7 × 100 = 0%
Output = 4 + (0 × 16) = 4.0 mA
Example 2 – Tank Quarter Full
Tank Height: 6 m
Blocking Distance: 0.3 m
Effective Span: 5.7 m
Actual Level: 1.425 m
% Level = 1.425/5.7 × 100 = 25%
Output = 4 + (0.25 × 16) = 8.0 mA
Example 3 – Tank Half Full
Tank Height: 6 m
Blocking Distance: 0.3 m
Effective Span: 5.7 m
Actual Level: 2.85 m
% Level = 2.85/5.7 × 100 = 50%
Output = 4 + (0.50 × 16) = 12.0 mA
Example 4 – Tank Three-Quarter Full
Tank Height: 6 m
Blocking Distance: 0.3 m
Effective Span: 5.7 m
Actual Level: 4.275 m
% Level = 4.275/5.7 × 100 = 75%
Output = 4 + (0.75 × 16) = 16.0 mA
Example 5 – Tank Full (at 100% Effective Span)
Tank Height: 6 m
Blocking Distance: 0.3 m
Effective Span: 5.7 m
Actual Level: 5.7 m
% Level = 5.7/5.7 × 100 = 100%
Output = 4 + (1.0 × 16) = 20.0 mA
Important Note: The water level can’t go above 5.7 m (the effective span) since the last 0.3 m is in the blocking distance zone, where it can’t be measured.
Accuracy: It doesn’t fluctuate with temperature, pressure, or density, therefore it is more stable than pressure or ultrasonic sensors.
Non-Contact Measurement: There are no moving components, thus there is no wear, no chance of contamination, and very little maintenance is needed compared to mechanical floats or switches.
Dependability: It works even when there is dust, mist, foam, and turbulence. Modern 80 GHz units can go through thin layers of foam.
Standard Integration:4-20 mA output works with all PLCs, DCS, and SCADA systems without the need for specific connections.
Stability Over Time: Keeps its accuracy for years without needing to be recalibrated or drift.
Common Applications
Industrial tanks are used for process water, cooling systems, and boiler feed.
Wastewater Plants: sewage tanks, clarifiers, and digesters
Municipal systems include storing drinking water and building tall structures.
Power Generation: Hydropower reservoirs and boiler feedwater
Chemical plants process water without the possibility of contamination.
Installation Best Practices
Mounting:
Put it at the center of the tank top vertically
Keep the antenna at least 0.5 m away from walls and other things inside.
Do not mount near fill pipelines, agitators, or heating coils.
Configuration:
Check the manufacturer’s distance blocking standard
Set up using the effective span, which is the height of the tank minus the distance it needs to be blocked.
At the bottom of the tank, set 0% and at the height of the effective span, set 100%.
Check with points in between (25%, 50%, 75%)
Common Mistakes to Avoid:
Not taking blocking distance into account in configuration
Putting too much weight on tank walls
The antenna type isn’t suited for the application
Troubleshooting Guide
Issue
Cause
Action
Output <4 mA
Wiring fault, power issue, configuration error
Check wiring, power supply, review config
Output >20 mA
Level exceeded span, multiple echoes
Verify actual level, check blocking distance
Fluctuating reading
Foam, turbulence, EMI interference
Clean antenna, add dampening, check for EMI
Frozen reading
Communication loss, high dampening
Check communication, reset transmitter
This version cuts the text by about 60% while keeping all the important information in a format that is easier to scan.
Radar level transmitters are a very accurate, dependable, and maintenance-free way to measure water levels in both industrial and municipal settings. To get correct field measurements, you need to know what blocking distance is and how to take it into consideration while setting up and calibrating your equipment.
You can do the following with the formula and steps in this guide:
Find out what the estimated 4-20 mA output will be at whatever water level.
Check field readings against what they should be
Make sure your calibration paperwork is correct
Fix problems with differences between the real level and the transmitter output
Make sure the setting takes into consideration the blocking distance.
This guide gives you the practical knowledge you need to work confidently with radar level transmitters, whether you are a field technician doing commissioning, an instrument engineer writing specifications, a maintenance technician fixing problems, or a student learning about process instrumentation.
The most important thing to understand is that the effective span is equal to the tank height minus the blocking distance. All of your percentage and current calculations must be based on this effective span, not the whole tank height.
Always read the manufacturer’s installation and operation documentation for complicated applications or uncommon mounting conditions. You might also want to talk to application engineers for help that is relevant to your site.
Refer the below link for the Guided Wave Radar Level Transmitter Installation Checklist
Level (m) = (c × Δt) / 2 c is the speed of light, and Δt is the time it takes for the radar signal to go back and forth. It figures out how far away the surface of the material is.
How to select a radar level transmitter?
Range: The highest point of the tank is covered.
Medium: Think about the dielectric constant, the temperature, and the pressure.
Environment: The shape of the tank, things that get in the way, and how it is mounted.
Frequency: A higher frequency means a smaller beam and better precision.
Certifications: meeting safety and industry requirements.
What is a radar level transmitter?
A device that emits radar waves to measure liquid or solid levels. The signal reflects from the surface, and the time-of-flight is used to calculate the level.
How to calculate the beam angle?
Beam Angle (θ) ≈ λ / D Where λ is the wavelength of the radar signal and D is the diameter of the antenna. A higher frequency and a bigger antenna make the beam angle narrower.
What is the typical accuracy of radar level transmitters?
Depending on the radar frequency and how it is set up, radar transmitters usually have an accuracy of ±3 mm to ±10 mm. ones with higher frequencies (80 GHz) usually have superior accuracy than ones with lower frequencies (6 GHz or 26 GHz).
Do foam or turbulence affect radar measurement?
Modern radar transmitters, especially those that work at 80 GHz, can go through light to moderate foam and are less impacted by turbulence than ultrasonic devices. But thick foam or dense mist can still make the signal weaker. Turbulence usually doesn’t affect radar much, although it can need more damping in the transmitter settings.
Can radar level transmitters be used for small tanks?
Yes, you can use radar transmitters on small tanks, but you need to make sure that the minimum measuring range parameter is right. Most radar devices need a minimum span of 0.5 m to 1 m. The transmitter might not work right if the height of your tank minus the blocking distance is less than this minimum span.
Test Your Skills with Advanced Radar Level Measurement
Refer the below link toTest Your Skills with our Advanced Radar Level Measurement Quiz for Process Instrumentation Engineers
Digital Output (DO) signals are the backbone of PLC-based automation, controlling actuators, valves, motors, and safety devices in process industries. Troubleshooting DO failures is often complex, involving wiring, field devices, I/O modules, grounding, and power supply integrity. This advanced quiz is designed for experienced engineers and technicians who want to sharpen diagnostic skills in solving DO-related issues. Covering realistic faults, program logic, timing effects, and advanced troubleshooting approaches, the quiz challenges practical knowledge. Attempting these questions will deepen your understanding of isolating faults, improving reliability, and ensuring safe plant operation through effective DO signal troubleshooting.
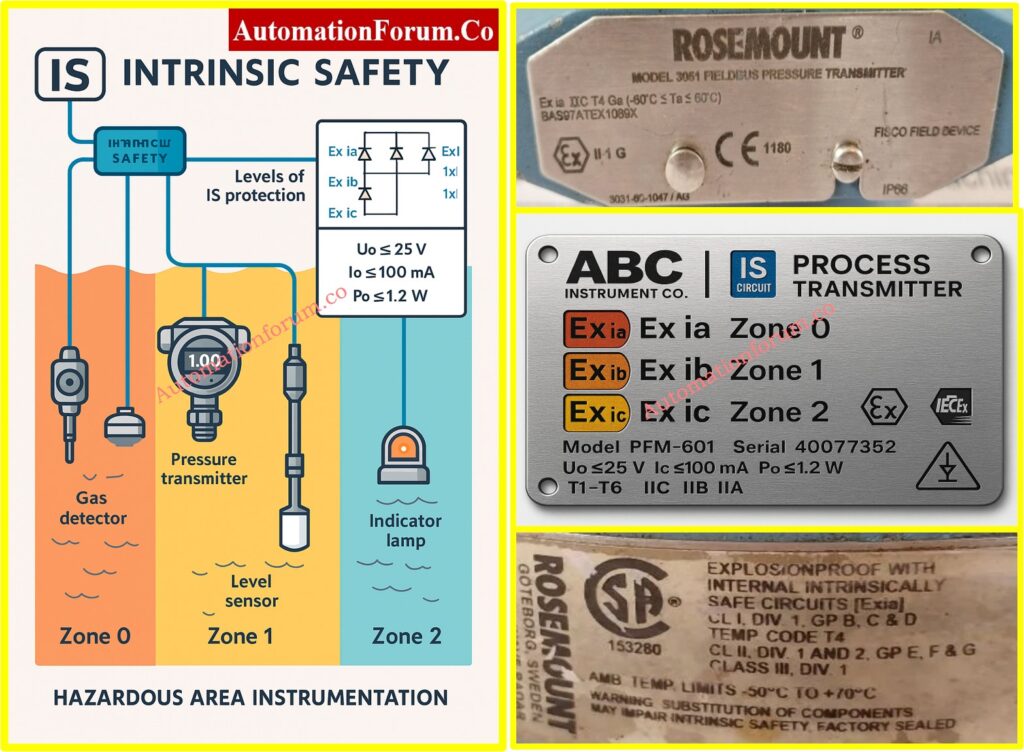
Intrinsic Safety (IS), which is shown as Ex i, is the most common way to protect instrumentation and control systems against explosions in hazardous locations. IS does not depend on containment like explosion-proof (Ex d) or purged/pressurized enclosures (Ex p). Instead, it stops ignition by making sure that the electrical and thermal energy in the circuit is lower than the minimum ignition energy of the gas or vapor that is potentially hazardous.
Principles of Energy Limitation in Hazardous Areas
In practice, this means limiting circuit voltage, current, capacitance, and inductance so that even under normal and fault conditions, the energy remains incapable of causing ignition. Typical IS limits for Group IIC gases such as hydrogen or acetylene are:
Voltage (Uo): ≤ 25 V
Current (Io): ≤ 100 mA
Power (Po): ≤ 1.2 W
IEC 60079-11 Safety Levels
The protection levels defined in IEC 60079-11 are:
Ex ia – withstands two simultaneous faults; highest level of safety.
Ex ib – withstands one fault; medium level of safety.
Ex ic – safe only in normal operation; basic safety level.
These correspond to hazardous area zones:
Zone 0 (continuous hazard) → Ex ia.
Zone 1 (likely hazard) → Ex ib.
Zone 2 (rare hazard) → Ex ic.
By ensuring entity compatibility (Uo ≤ Ui, Io ≤ Ii, Po ≤ Pi, and cable capacitance/inductance ≤ certified values), intrinsic safety simplifies installation and permits live maintenance, while meeting ATEX, IECEx, and IEC 60079 standards.
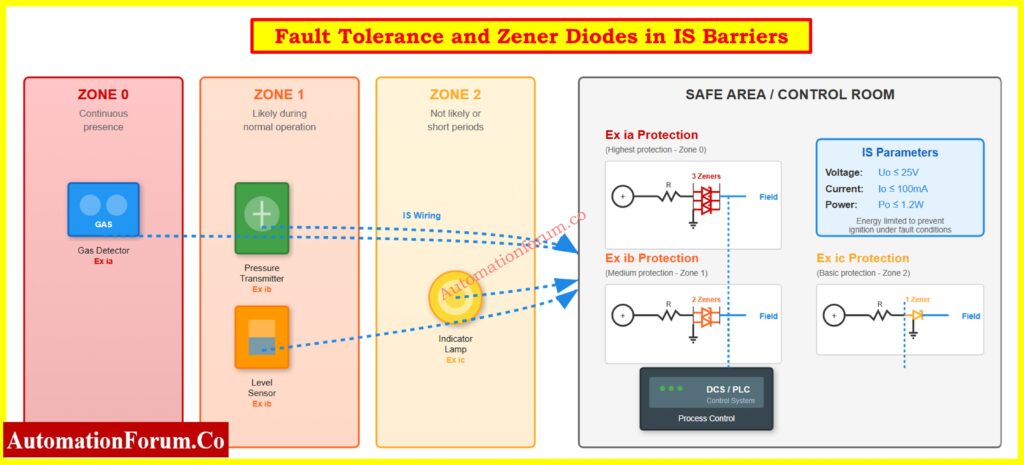
Fault tolerance is the most important part of intrinsic safety design. It makes sure that no unsafe energy gets to the dangerous location, even if the protecting parts fail.
Zener Diodes in IS Barriers
Function: work by clamping overvoltage and sending surplus energy to the ground.
Ratings: The breakdown voltage is usually between 6.8 and 28 V, while the power is between 1 and 5 W.
Selection: Pick a clamp voltage that is a little higher than the standard loop voltage. For instance, a 26 V Zener protects a 24 V loop without causing problems with clamping.
Redundancy: Ex ia uses 3 diodes in parallel (2-fault tolerance), Ex ib uses 2, Ex ic uses 1.
Countable Faults
No fault: Normal condition.
Single fault: Failure of one protective component (e.g., diode short/open).
Two faults: Simultaneous failure of two protective devices.
Ex ia must remain safe in all three conditions; Ex ib in the first two; Ex ic only in normal operation.
Temperature Derating of Zener Diodes
Zener diodes must be derated for ambient temperature. A 1W Zener may provide only 0.5 W at 60°C. This is very important to meet the temperature class (T1-T6) requirements for hazardous gases.
Example Circuit Calculation
Let’s say the barrier output is Uo = 25 V and Io = 100 mA.
Po = Uo × Io = 25 × 0.1 = 2.5 W. But allowable Po ≤ 1.2 W. So, series resistors and fuses must keep the maximum power at 1.2 W.
This mechanism that limits energy makes sure that IS circuits can’t spark or heat up to the point where they can start a fire, even in the worst possible conditions.
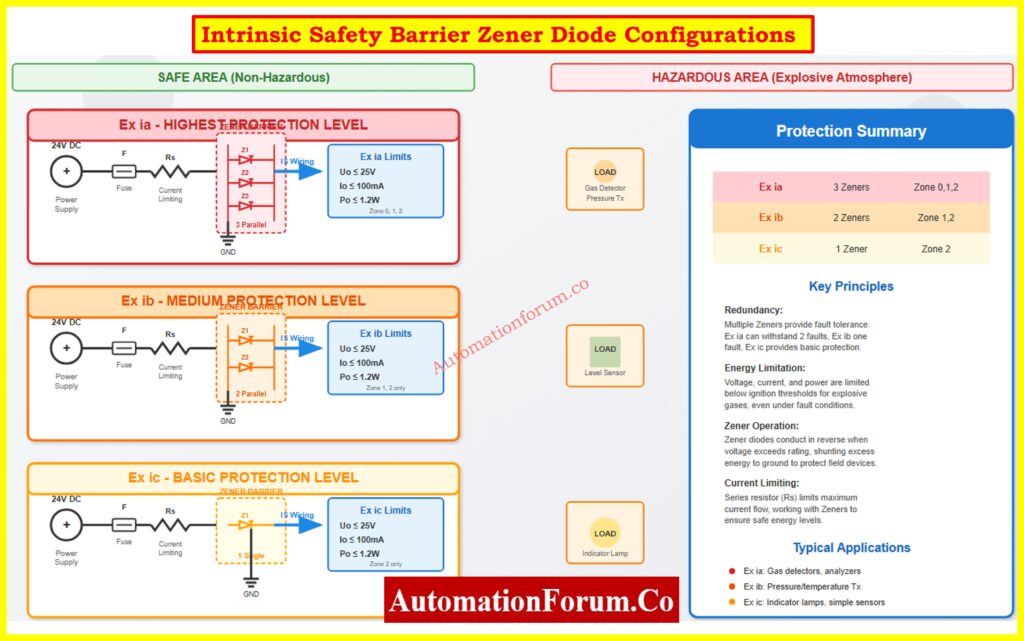
Ex ia is the highest level of safety that comes from inside. To make sure there is redundancy, the protective barrier usually includes three Zener diodes in parallel, along with resistors and fuses. This setup can handle two faults, which means it can still work safely even if two protective elements fail. The main idea is:
“No ignition during normal operation or in the presence of two countable faults.”
The design follows Failure Mode and Effects Analysis (FMEA) from a circuit reliability point of view. This makes sure that every possible failure mode leads to a safe state. Parallel Zener diodes guarantee clamping action even if one or two diodes short or go open circuit.
Technical Specifications
Diode configuration: 3 Zeners in parallel.
Voltage (Uo): ≤ 25 V.
Current (Io): ≤ 100 mA.
Power (Po): ≤ 1.2 W.
Fault Tolerance: Two faults.
Entity Parameters (Group IIC): Co ≈ 83 nF, Lo ≈ 4 mH.
Entity Concept Example
Cable capacitance = 50 nF/km, length = 1.2 km → total capacitance = 60 nF. The installation is safe because Co (83 nF) is greater than 60 nF.
Applications and Characteristics
Hazardous Zones: Good for Zone 0, Zone 1, and Zone 2, where explosive atmospheres may be present all the time or most of the time.
Process Criticality: This is the best choice for safety-critical uses like gas detection systems, tank level monitoring, or chemical dosing devices.
Energy Limitation: Usually limited to 25 V, 100 mA, and 1.2 W at most when there is a defect.
Installation Requirements: It is important to keep intrinsically safe circuits separate from non-IS wiring. This can be done with blue-colored insulation cables and separate terminal blocks.
Certification: For example, “Ga” means that it is suitable for Zone 0, while “Ex ia IIC T4 Ga” means that it is. Safety parameters like Ui (input voltage), Ii (input current), and Pi (power) are included in the documentation.
Real-world Applications: Gas analyzers, guided wave radar level transmitters, and emergency shutdown sensors are used in refineries.
There is always methane at the wellhead and vent zones (Zone 0) of offshore drilling rigs. Even if safety barriers fail, gas detecting systems must still be safe. Ex ia barriers with two-fault tolerance make sure that ignition energy never gets to the hazardous side. This lets personnel carry out live calibration and loop testing, which minimizes down on downtime.
So, Ex ia is the only option for Zone 0 and the best option for essential safety loops when risk tolerance is low.
Refer the below link for the Importance of NAMUR Sensors in Hazardous Areas
Ex ib protection is a medium level of safety and uses two Zener diodes in tandem. This setup makes sure that one fault won’t cause ignition, whether the system is working normally or if only one problem happens. But the system is not guaranteed to be safe if there are two failures.
Safety principle:
“No ignition during normal operation or with one fault present.”
Compared to Ex ia, redundancy is reduced, making Ex ib unsuitable for Zone 0 but fully acceptable for Zone 1.
Technical Specifications
Diode configuration: 2 Zeners in parallel.
Voltage (Uo): ≤ 25 V.
Current (Io): ≤ 100 mA.
Power (Po): ≤ 1.2 W.
Fault Tolerance: One fault.
Entity Parameters (Group IIC): Co ≈ 150 nF, Lo ≈ 8 mH.
Installation Guidelines: Barriers must be properly grounded and kept separate from non-IS circuits. There are guidelines for routing cables that are safe in and of themselves.
Cost-Benefit Analysis: Ex ib systems are usually cheaper than Ex ia systems because they have fewer protective parts and are easier to certify.
Maintenance Considerations: Still needs to be checked on a regular basis, although the margins of reliability are less.
Ex ib is a good solution for Zone 1 classified areas such process units, offshore platforms, and petrochemical industries since it strikes a good compromise between safety and cost. It gives enough safety margins without the cost of Ex ia, unless criticality requires it.
Case Study – Chemical Processing Plant
During charging and venting, vapors are emitted from a reactor hall that is classed as Zone 1. Ex ib barriers connect temperature and pressure transmitters, which makes monitoring trustworthy. One-fault tolerance is plenty because explosive atmospheres aren’t always there. This method strikes a balance between safety and cost-effectiveness, making it possible to use field instrumentation widely without overengineering.
Ex ib is the most common standard for Zone 1 in process plants.
Ex ic is the lowest level of intrinsic safety. It merely uses one Zener diode to limit energy. It stops ignition only when the system is working normally because it doesn’t have any fault tolerance.
Safety principle:
“No ignition in normal operation only.”
Technical Specifications
Diode configuration: Single Zener.
Voltage (Uo): ≤ 25 V.
Current (Io): ≤ 100 mA.
Power (Po): ≤ 1.2 W.
Fault Tolerance: None.
Entity Parameters (Group IIC): Co ≈ 200 nF, Lo ≈ 10 mH.
Limitations
Safe only in normal operation.
No redundancy → unsafe for Zone 0 or Zone 1.
Not acceptable for critical safety loops.
Applications and Characteristics
Hazardous Zones: Only Zone 2 is dangerous because explosive atmospheres happen very seldom and only for brief periods of time (less than 10 hours a year).
Process Criticality: Meant for monitoring that isn’t critical or for extra tasks.
Circuit Simplicity: Needs very little protection circuitry, which makes it cheaper and easier to put into action.
Installation Limits: Not allowed in Zone 0 or Zone 1 because there is no backup.
Typical Applications: Indicator lamps, signal beacons, auxiliary sensors, or monitoring panels where ignition probability is extremely low.
Although cost-effective, Ex ic comes with significant limitations. Engineers must perform careful risk assessment to justify its selection. It is never recommended for process safety functions or critical measurement instruments. Instead, it serves best in secondary instrumentation systems located in marginal Zone 2 areas.
Case Study – Pharmaceutical Clean Room
In a clean room using ethanol-based solvents, small vapor releases create Zone 2 areas near filling equipment. Ex ic protection is acceptable for non-critical devices such as humidity sensors and indicator lamps. Since explosive atmospheres are rare and ventilation is strong, Ex ic provides an economical solution while meeting regulatory standards.
Ex ic is therefore a cost-effective option for low-risk Zone 2 installations.
Parameter Comparison Table: Ex ia vs Ex ib vs Ex ic
This table provides engineers with a complete overview for decision-making, combining electrical limits, protective component count, installation requirements, maintenance schedules, cost considerations, and real-world applicability.
Ex ia is mandatory for Zone 0 or any continuously hazardous area. It provides maximum redundancy and reliability.
Ex ib is good for Zone 1 because it strikes a good balance between safety and cost. For explosive atmospheres that happen only sometimes, single-fault tolerance is enough.
Ex ic only works in Zone 2, which is great for low-risk, non-critical circuits when saving money is the most important thing.
Refer the below link for the Intrinsic Safe Calculation for Instrumentation Design Engineers
Risk Assessment: Look at how likely it is that a fire will start in the specific dangerous area and what will happen if it does.
Process Criticality: Use Ex ia for important shutdowns or monitoring, Ex ib for regular process measurements, and Ex ic for monitoring that isn’t very important.
Cost-Benefit Analysis: Balancing safety with cost higher hazardous zones justify higher investment.
Follow the rules: Make sure you follow IEC 60079-11, ATEX, and IECEx.
Future Growth: Think about how easy it is to scale up and whether the instrumentation would need to work in Zone 0 later on.
Maintenance Capabilities: Choose a level of protection based on the inspection resources you have.
Vendor Availability: Make sure that parts and spares are easy to get and come with the right certifications.
This strategy makes sure that a logical, standards-compliant choice is made that fits within both budget and process safety limits.
Here are some best practices for setting up an IS:
Earthing/Grounding: Make sure that the Zener barriers are properly bonded so that they may still redirect energy.
Choosing Cables: For IS circuits, use blue-insulated cables that are separate from non-IS cabling.
Segregation: To avoid induced faults, route IS and non-IS circuits separately.
Documentation: Keep all loop designs, barrier certificates, and safety specifications up to date.
Inspection: Follow the IEC 60079-17 rules for regular inspections.
Testing: Before placing the system into use, check the loop’s integrity, insulation resistance, and barrier grounding.
Strict adherence makes sure that intrinsic safety integrity is maintained throughout the life of the device.
Intrinsic Safety has a tiered system for protecting dangerous areas that strikes a balance between safety, dependability, and cost. Ex ia makes sure that Zone 0 can survive two faults, Ex ib makes sure that Zone 1 can survive one fault, and Ex ic makes sure that Zone 2 is safe. Engineers make IS loops that meet IEC 60079-11, ATEX, and IECEx standards by following the rules for voltage, current, power, and entity parameters. This makes sure that the installations are safe,
FAQ on Understanding Exia, Exib, and Exic
1. What is the difference between Ex ia, Ex ib, and Ex ic?
Ex ia: The highest level of safety; can handle two faults at the same time; works in Zone 0, 1, and 2.
Ex ib: Medium safety; can handle one mistake; works in Zones 1 and 2.
Ex ic: Basic safety; no fault tolerance; suitable for Zone 2 only. Key difference: Fault tolerance, applicable hazardous zones, and reliability.
2. What is Ex ic?
Ex ic is the basic level of intrinsic safety protection.It only works safely when everything is working normally, and it doesn’t have any fault tolerance. It’s utilized in Zone 2, where explosive atmospheres are infrequent and only last a short time. Indicator lights, alarms, and extra gadgets are some of the most common uses.
3. What is Ex-ia and Ex-ib?
Ex ia: Intrinsically safe equipment that remains safe with two faults; can be used in Zone 0.
Ex ib: Intrinsically safe equipment that remains safe with one fault; suitable for Zone 1.
IEC 60079-11 defines both as intrinsic safety protection levels. They differ in how much fault tolerance they have and where they can be installed.
4. What is the difference between intrinsically safe and ATEX?
Intrinsically Safe (IS/Ex i): A way to protect circuits by limiting the flow of energy so that explosive gases or dust don’t catch fire.
ATEX is a European regulatory directive (2014/34/EU) that covers equipment for hazardous circumstances. It includes IS, flameproof (Ex d), and other ways to safeguard.
The main difference is that IS is a technological protective approach and ATEX is a framework for compliance and certification.
5. What is the full form of ATEX?
ATEX means:
AT = ATmospheres
EX = Explosives
It is a European rule that controls equipment that is meant to be used in places where there are explosions.
6. How to identify intrinsically safe equipment?
Look for:
Markings on the tools, like Ex ia IIC T4 Ga and Ex ib IIB T3 Gb.
Manufacturer documentation: Certificates of conformity (IECEx, ATEX).
Blue IS wiring and segregated terminals in installation.
Low voltage/current limits (≤25 V, ≤100 mA, ≤1.2 W typical for IIC gases).
The loop calibrator is an important equipment for an industrial process control trained instrument technician to use when fixing 4-20 mA current loop circuits. These handheld instruments can measure current, generate current signals, and act like field transmitters. To fix problems quickly and effectively, you need to know how to use their three different modes: Measure, Source, and Simulate.
In the following article, we’re going to utilize a real-life example: A pressure transmitter that has been set up to read between 0 and 750 inches of water column and sends 4-20 mA to a controller that shows 0 to 750.
Linear and reliable: easy to scale (e.g., 12 mA = 50% of range).
Example: A pressure transmitter scaled 0-750 in. W.C. outputs 4 mA at 0 and 20 mA at 750. At 12 mA, the controller reads 375 simple and accurate.
Mode 1 – Measure Mode (Verifying Loop Current)
When to use Measure Mode
Use measure mode when you need to verify what current is actually flowing in an operating loop when troubleshooting unexpected controller readings, suspected wiring problems, or performing routine calibration checks.
Circuit Configuration in Image – Loop Calibrator Acting as an Electrical Load (Measure Mode)
Loop Calibrator acting as an Electrical Load (Measure Mode) Image shows the calibrator in Measure Mode, acting as a passive device. Key elements:
Field Wiring: Two-wire cable carries signal to the controller
Controller’s 250Ω Resistor: Converts current to voltage for the analog-to-digital converter
Controller Display: Shows PV = 300.3, confirming correct signal interpretation
Power Source: The controller’s 24 VDC supply provides all loop power
Critical Connection Details
Polarity matters: Connect the red (positive) lead to the more positive side and black (negative) lead to the more negative side. The calibrator measures current without providing power it’s like an ammeter inserted in series.
For faster testing, if a test diode is installed in the loop, connect the calibrator in parallel with the diode instead of breaking the wire.
Interpreting Results and Troubleshooting Tips
With 300.3 inches applied (40.4% of 750 range), we had expect approximately 10.5 mA. The measured 12.0 mA suggests possible transmitter miscalibration or sensor drift. Since the controller correctly displays 300.3 for 12 mA, the problem lies in the transmitter, not the controller or wiring.
Refer the below link for Understanding the Difference Between Live Zero and Dead Zero in 4 to 20 mA signal
This isolates the controller for independent testing. If the display is wrong, the problem is definitely in the controller, not the transmitter or field wiring.
The technician can stand at the valve with the calibrator, making immediate adjustments while observing valve response far superior to coordinating with a control room operator via radio.
Diagnosing Valve Friction (Step Response)
Source mode is great for finding mechanical problems:
Set the calibrator to 12.000 mA and check that the valve advances to 50%.
Take significant action (±4 mA) The healthy valve should respond.
The picture shows a positioner, not just a regular I/P transducer. Positioners have sensors that give input on the position and adjust the pressure constantly to make sure the valve gets to the right place, taking into account friction and process forces. This gives you a considerably higher level of precision (usually ±0.5% or better).
Simulate mode tests the whole system by acting like a true two-wire transmitter. This is important for setting up new installations, checking them before they start up, and making sure that power sources work when they are under load.
Critical Difference: Simulate vs. Source
Source Mode: The calibrator gives you both current regulation and power from its own battery. Tests signal interpretation but NOT the loop’s power supply.
Simulate Mode: Calibrator regulates current but relies on the loop’s 24 VDC supply for power. Tests the COMPLETE system: power supply, wiring, and input circuit.
Testing complete signal path including power supply
Verifying wiring integrity under load
Pre-startup system checkout
Want to test exactly as a real transmitter operates
Effective troubleshooting isn’t just having a loop calibrator it’s knowing which mode to use. Measure mode tells you what’s happening now. Source mode lets you control exactly what signal a device receives. Simulate mode tests your infrastructure as if a real transmitter were connected. Master these three modes, and you’ll diagnose most loop problems in minutes rather than hours.
FAQs on 4-20 mA Loop Troubleshooting with Loop Calibrators
What is the difference between simulate and source mode in a loop calibrator?
In source mode, the loop gets both current and power. In simulation mode, the loop’s external 24 VDC supply controls the current, making it operate like a two-wire transmitter.
How do you troubleshoot a 4-20 mA loop with a loop calibrator?
Check the wiring and power, then measure the loop current. Use simulate mode to emulate the transmitter and source mode to test controllers or valves until you find the problem.
Can a loop calibrator test control valves directly?
Yes, in source mode it can send a 4-20 mA signal to the valve’s I/P transducer, letting you check valve movement, friction, and positioner performance.
What are common problems in 4-20 mA loops?
Common problems are open circuits, no loop power, scaling mistakes, loud signals, voltage decreases over long runs, or grounding and shielding problems.
What is the difference between source and simulate mA?
Source mA actively drives current and powers the loop; mimic mA regulates current but relies on the loop’s existing supply voltage.
HVAC dampers are very important for making sure that air is distributed safely, efficiently, and reliably in modern building services and industrial facilities. Dampers are put in place to control the flow of air, keep fires from extending, and keep smoke from getting out of hand in case of an emergency. For HVAC dampers to be installed correctly, a method statement must be followed. This is necessary to meet project specifications, safety norms, and international standards like NFPA and UL.
The following article gives a full method description for putting in many kinds of HVAC dampers, such as:
Volume Control Dampers (VCD)
Motorized Volume Control Dampers (MVCD)
Fire Dampers
Fire Rated Motorized Dampers
Smoke Motorized Dampers
Relief Dampers
Instrumentation, MEP, and HVAC EPC design engineers, contractors, and QA/QC teams can use it to make sure that installation is done safely, quickly, and to the right standards.
Objective of the HVAC Damper Installation Method Statement
This method statement sets forth a clear plan for how to install HVAC dampers and what order to do the work in. It makes sure that:
The installation meets all the requirements of the contract and the authorized designs.
Requirements for safety, quality, and the environment are met.
Throughout the life of the project, dampers do their job reliably.
Scope of HVAC Damper Installation Works
This document talks about how to install the following kinds of HVAC dampers:
Volume Control Dampers (VCDs) are used to control the flow of air by hand.
Motorized VCDs with actuators that let the BMS control them automatically.
Fire Dampers are used to keep fires from spreading in ductwork.
Fire-Rated Motorized Dampers combine safety from fire with automation.
Smoke Dampers stop smoke from spreading during crises.
Relief Dampers are used to keep the pressure in the system balanced and the duct safe.
The scope is in line with Health, Safety, and Environment (HSE) Plans, Project Quality Plans (PQP), and Inspection Test Plans (ITPs).
To install something successfully, you need to coordinate across multiple fields:
The project manager is in charge of making sure that resources, equipment, and PQP/PSP compliance are all in order.
Construction Manager: In charge of overseeing the work, testing, and commissioning.
Site Engineer: Makes ensuring that technicians follow the drawings, reports on progress, and guides them.
QA/QC Engineer checks for conformity, raises WIR/MIR, and gets approval from the consultant.
The site foreman is in charge of the workers, gives them assignments, and makes sure they follow the rules.
The Safety Officer makes sure that HSE rules are followed and checks that they are.
Store Keeper: Makes sure that dampers and accessories are stored safely and only given out as needed.
Tools, Equipment, and Safety Precautions
To install a damper safely and correctly, you need the following:
Hand Tools: A toolbox, wrenches, screwdrivers, and a torque wrench.
Power Tools: A drill with bits for concrete.
Equipment for lifting: chain block, crane, and forklift for big dampers.
Tools for measuring: a measuring tape, a spirit level, and a marker.
Digital multimeter and ammeter for checking the actuator are two testing tools.
Wear a safety helmet, gloves, steel-toed shoes, eye protection, and a high-visibility vest.
Safety PPE for Damper Installation Activities
The most important thing to remember while installing HVAC is safety. When installing dampers, workers typically have to operate at heights, move heavy items, and connect electrical and pneumatic actuators. This implies that several dangers must be managed. Important safety steps are:
Trained Personnel Only: People who use power tools, lifting devices, and electrical testing gear must be taught and certified to do so. For instance, only licensed riggers should use cranes or chain blocks, and only professional electricians should work with actuator wire.
Mandatory Use of PPE: PPE is required: Workers must always wear safety helmets, steel-toed boots, gloves, safety glasses, and vests that are easy to see. Face shields and dust masks should also be worn when cutting or grinding ducts.
Barricades and Safety Nets: When dampers are used in risers, shafts, or above ducting, there is a chance that things will fall. Put up caution tapes, barricades, and safety netting around work locations to keep workers and those surrounding safe.
Adequate Lighting: Night shifts, mechanical rooms, and ceiling spaces that don’t get enough natural light should all have enough lighting. There should also be emergency lighting.
Inspected Lifting Equipment: Before using cranes, forklifts, chain blocks, and slings, they must be checked, tested with a load, and marked. Damaged dampers and accidents on the job site are often caused by lifting things the wrong way.
Controlled Site Access: Only workers with valid Work Permits should be able to get to the work area. This makes sure that the HVAC, electrical, civil, and fire safety teams all work together well.
Before you may begin installing in the damper, you need to do a few things first:
Material Verification: Make sure that the consultant/QA-QC team has approved all of the dampers, actuators, and accessories through MIR (Material Inspection Records). The authorized manufacturer and model should match what was submitted for the project.
Drawing and Schedule Approval: Check the most recent IFC drawings, damper schedules, and coordination layouts for approval of the drawing and schedule. Installation must precisely follow these plans to make sure that everything lines up with other services like cable trays and sprinkler pipes.
Site Readiness: Make sure that the duct supports, insulation, and access points are all in place. Before putting in the damper, any civil or electrical work that is still going on should be finished.
Safe Handling and Transport: You should never carry dampers by their blades, actuators, or linkages. Instead, you should use frames or sleeves. Forklifts should have padding on the edges to protect them from harm, and dampers should not be dragged on the floor.
Physical Inspection: Look for dents, bent frames, missing screws, or broken actuators. Even tiny changes can make air leak or cause the actuator to over-torque.
Instrumentation Readiness: The team in charge of instrumentation should check the actuator voltage, signal type (0–10V, 4–20mA, or ON/OFF), and wiring paths. Make sure that the BMS panels are set up to work with the actuator if it supports BACnet or Modbus.
Access for Maintenance: Make sure there are access doors or removable duct sections so that actuators may be checked, fixed, and replaced.
Installation of Volume Control & Motorized VCD Dampers
Cycle Testing Before Installation: Before installation, do a cycle test by turning the blades by hand to make sure they move smoothly and don’t get stuck. This shows that the damper has not been bent.
Positioning in Duct Opening: Put the damper directly in the middle of the duct opening. Don’t twist, rack, or squeeze the frame to make it fit, as this will throw off the alignment of the blades.
Fastening and Alignment: Follow the manufacturer’s directions to attach the damper with screws, bolts, or rivets. To keep the frame from bending, keep the spaces between the pieces uniform and use shims if you need to.
Structural Bracing: For big ducts or systems that move air quickly, use horizontal mullion bracing and vertical supports to keep them from vibrating and being pushed by air pressure.
Actuator Mounting (Motorized VCDs):
For easier access, actuator shafts should stick out around 100 mm from the duct.
When feasible, make sure that actuators are not in the path of the air.
Securely connect the actuator linkage, making sure not to apply too much torque.
Electrical/Control Wiring:
Follow the control schematics to connect the actuator wiring.
Check the polarity of the analog signals (0–10VDC or 4–20mA) for modulating actuators.
Give BMS feedback connections (open/close).
Operational Check:
Turn the damper on and off by hand and using the actuator. All parts must open and close at the same time. Before giving it to someone, any binding must be fixed.
Refer the below link for the 82 Essential Drawings and Documents for Instrumentation and Control Engineers
Fire Dampers, Smoke Dampers & Relief Dampers Installation
Clearance Around Sleeves:
NFPA 90A and the manufacturer’s instructions say that there should be at least ¼ to 1½ inches of space between the damper sleeves and the wall or floor openings. This allows for thermal expansion during fire.
Sleeve Insertion:
insert the damper sleeve into the hole that has been made. On the actuator side, the sleeve extension can’t be more than 16 inches, and on the other side, it can’t be more than 6 inches.
Duct Termination:
Ducts must end at the sleeve and not go all the way through it. Connections should be either breakaway or rigid and authorized by UL.
Retaining Angles:
Install 16-gauge steel retaining angles on both sides of the wall or floor. Use bolts to hold it down, with at least two on each side and 6 inches between them.
Fusible Link & Spring Check:
Check that the fusible links (which normally melt at 165°F / 74°C) and closure springs are working properly. If it’s broken, get a new one.
Actuator Connections (Motorized Dampers):
Connect the wires to the actuators according to the approved schematics.
Check the BMS/fire alarm signals to see if they work for opening and closing the damper.
Make sure that the actuators get the right voltage and frequency.
Smoke Control Integration:
The Fire Alarm System (FAS) must be able to close and open smoke dampers based on smoke detection. Check the fail-safe position (open or closed) according to the design.
Make sure there are doors or removable duct sections that can be opened for inspection and testing on a regular basis.
Consultant Approval:
After the installation is done, you need to get consultant approval by raising Work Inspection Requests (WIR). No duct insulation should be done unless it is approved.
Testing dampers properly makes sure they work well in both normal and emergency situations:
Functional Testing: Manually and with actuators, cycle the dampers. Blades should move freely and not make too much noise or torque.
Testing for Integration: Check the reaction of the actuator from the BMS/DDC panels. Make sure that the open/close signals and feedback connections work properly.
Fire and Smoke Simulation: Check the release of the fusible link for fire dampers. Use fire alarm signals to open and close smoke dampers to make sure they work.
Leakage Testing: Check closed dampers for leaks that are too big according to ASHRAE and project criteria.
Final Documentation: Write down the results in QA/QC checklists, get the consultant’s approval, and make changes to the as-built drawings.
From a controls point of view, dampers are an important aspect of airflow automation loops:
Motorized VCDs: Get control signals from BMS that are either analog (0–10VDC or 4–20mA) or digital (ON/OFF).
Fire/Smoke Dampers: Connected to Fire Alarm Panels so they close automatically when there is a fire.
Feedback Monitoring: The actuator position feedback (either open/close end switches or modulating feedback) is sent back to the BMS.
Critical Facilities: In cleanrooms, data centers, or pharmaceutical facilities, dampers may work with pressure differential transmitters to make sure that the environment is controlled exactly.
Installing HVAC dampers involves accuracy, following safety rules, and following NFPA/UL regulations. A well-organized method statement makes sure that VCDs, motorized dampers, fire dampers, and smoke dampers work properly, keep people safe, and improve airflow control.
EPC engineers, contractors, and project teams can make sure that HVAC systems are installed correctly, are approved for inspections quickly, and work well for a long time by following this instructions.
Refer the below link for the Circular HVAC Duct Air Velocity Calculator for Engineers
HVAC dampers are usually put inside ductwork or at areas where ducts branch off to control the flow of air.
To balance the flow of air, Volume Control Dampers (VCDs) are put in main ducts or branches.
Fire and Smoke Dampers are put in place when ducts go through walls or floors that are fire-rated to stop the spread of fire and smoke.
Most of the time, relief dampers are put close to air handling units (AHUs) or fans to keep pressure variations in check.
Motorized dampers are commonly put in places where BMS controls the airflow automatically.
How do you install dampers?
Damper installation involves:
Pre-check: Make sure the consultant has approved the materials and designs.
Positioning: Put the damper in the duct opening so that it is level and does not twist.
Fastening: Use screws, bolts, or rivets to hold the damper in place with the right amount of space between them.
Bracing is adding supports to keep the frame from vibrating and bending.
If the actuator is motorized, extend the shaft outside the duct for access and attach it according to the wiring schematic.
Testing: For motorized dampers, check the signal response with the BMS or control system while manually cycling the blades.
How to set HVAC dampers?
Manual Dampers (VCDs): Set during system air balancing by moving the blades to get the right CFM (cubic feet per minute) of air in each zone. A handle or quadrant is then used to lock the position.
Motorized Dampers: BMS/DDC panels control them automatically. Control logic, not manual adjustment, sets the actuator to open or close according on temperature, pressure, or fire alarm signals.
What is a HVAC damper?
An HVAC damper is a mechanical part that is put inside ducts to control or stop the flow of air. Dampers can be:
Manual (VCDs): you can change them by hand to balance the airflow.
Motorized: operated by electric or pneumatic actuators and connected to automation systems.
Fire/Smoke Dampers are safety devices that close on their own when there is a fire to keep flames and smoke from spreading.
Relief Dampers are dampers that automatically open and close dependent on the pressure in the system.
When to use HVAC damper?
When you need to, use dampers:
Make sure that air flows evenly throughout rooms or areas.
Combine zone control with automation (BMS/DCS).
Stop fire and smoke from spreading through ducting.
Take away extra pressure from HVAC systems.
Stop the passage of air for maintenance or to keep things separate.
Dampers are very important for keeping the atmosphere under control and keeping people safe in important places like cleanrooms, data centers, and hospitals.
How many dampers on HVAC?
The number of dampers depends on how the system is set up, zoning rules, and safety codes:
Most of the time, each branch duct contains at least one VCD to keep things in balance.
A fire/smoke damper is needed for every wall or floor that is rated for fire.
There is at least one motorized damper in each zone that the BMS controls.
Most of the time, relief dampers are put in for each AHU or fan segment.
In a medium-sized office building, for instance, you might have dozens of VCDs, several fire/smoke dampers, and many motorized dampers, depending on how the ducts are set up and how many zones you want to regulate.


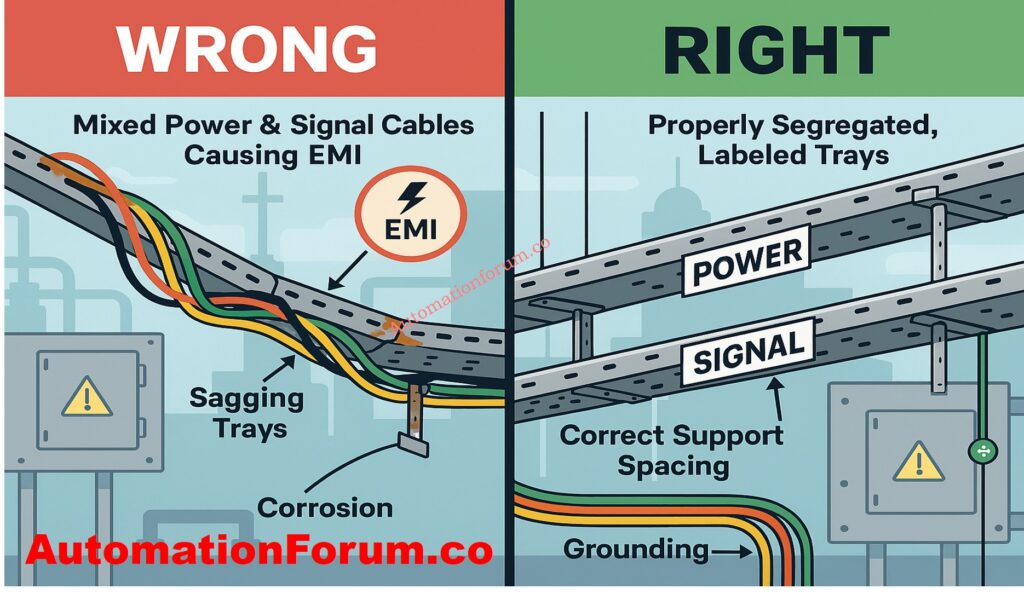
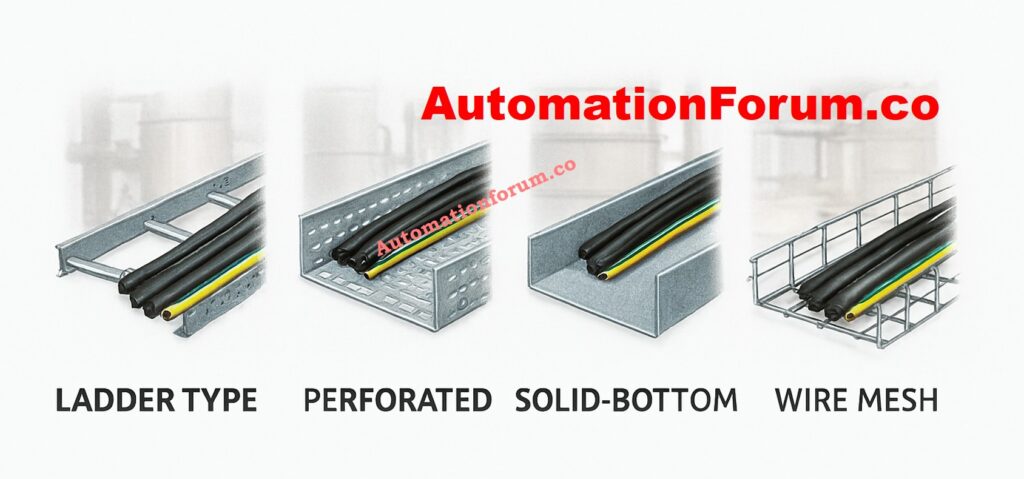
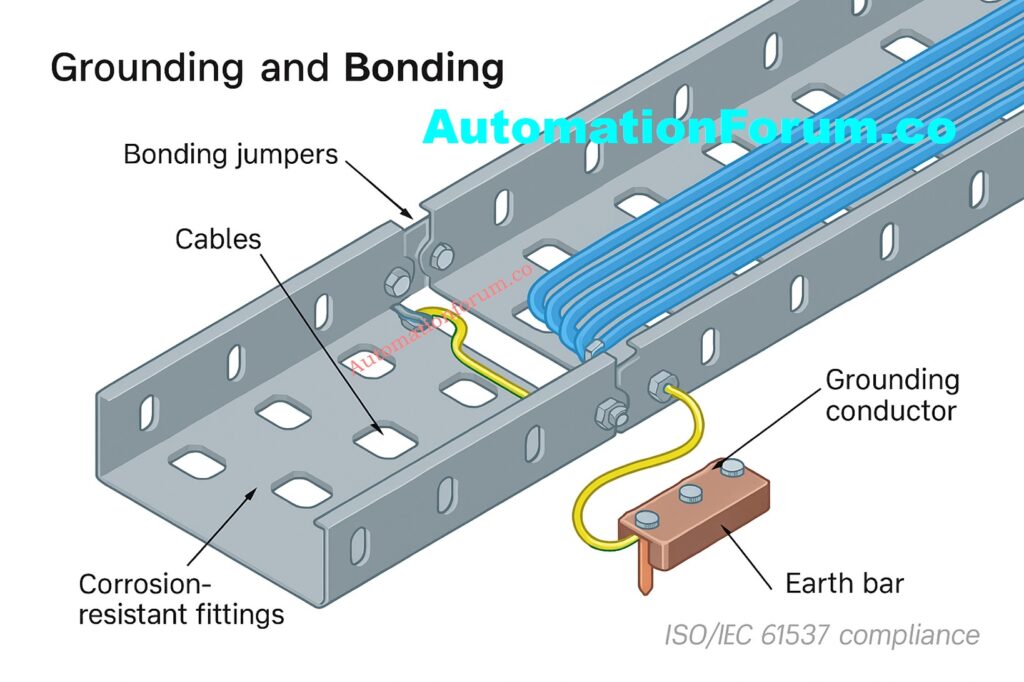
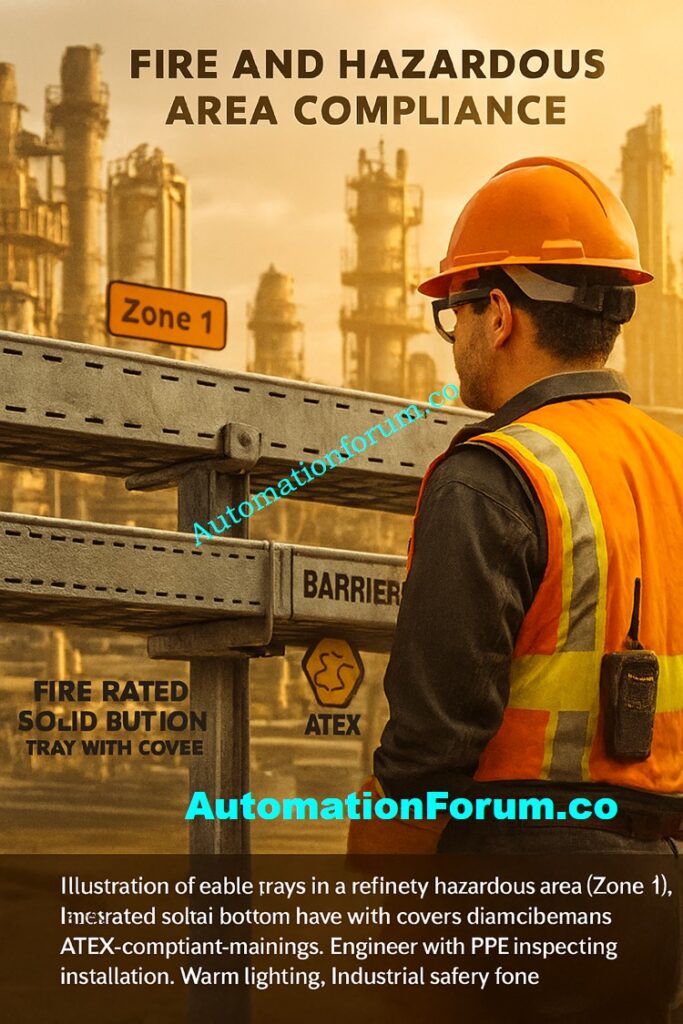


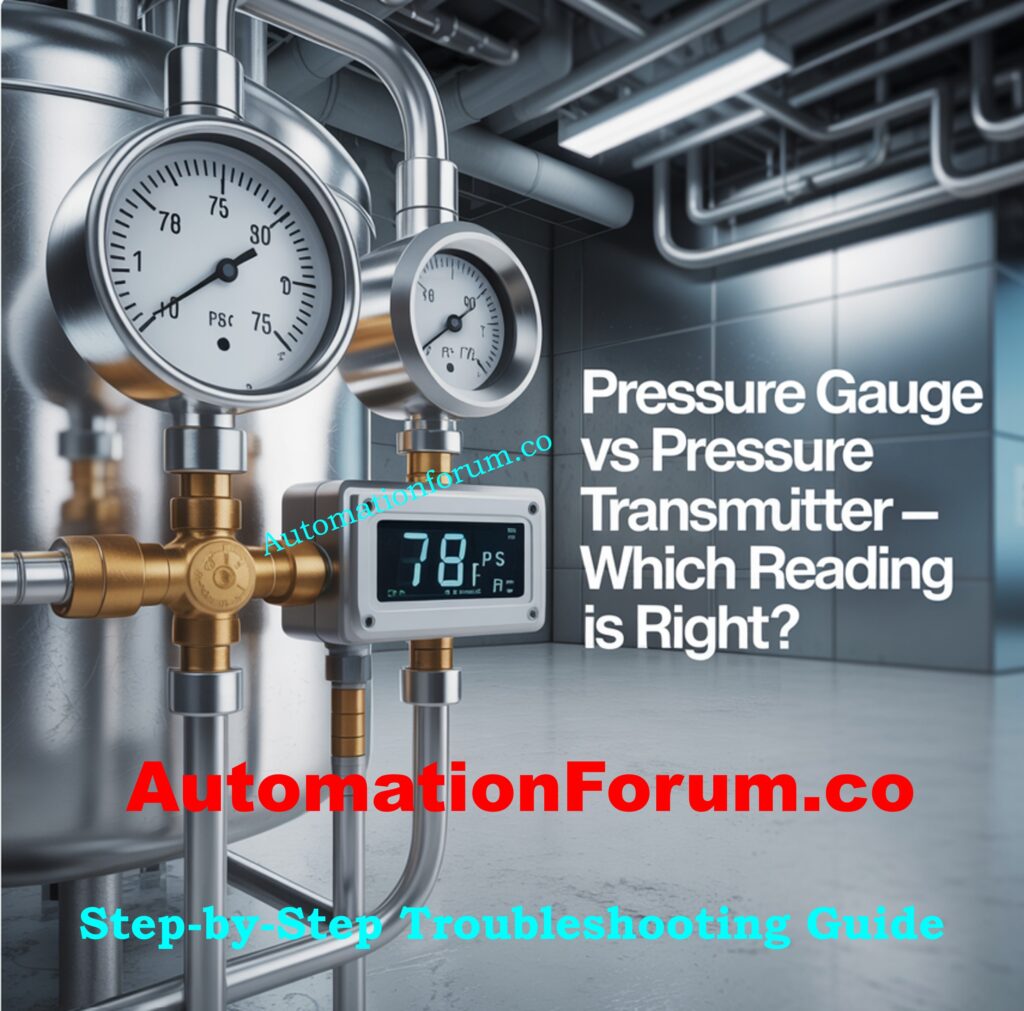
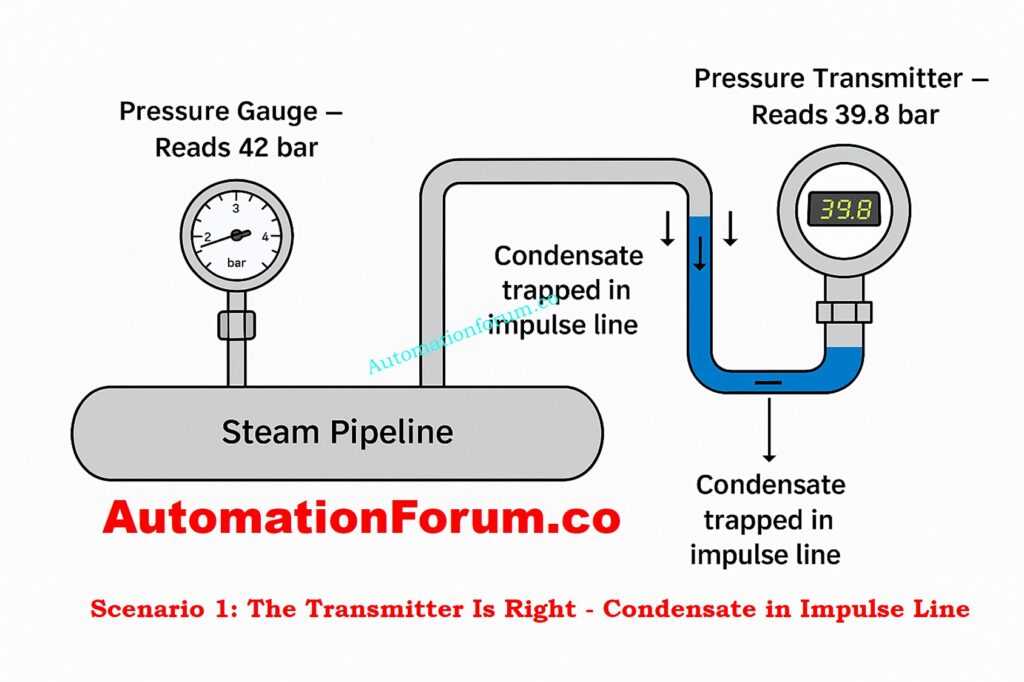
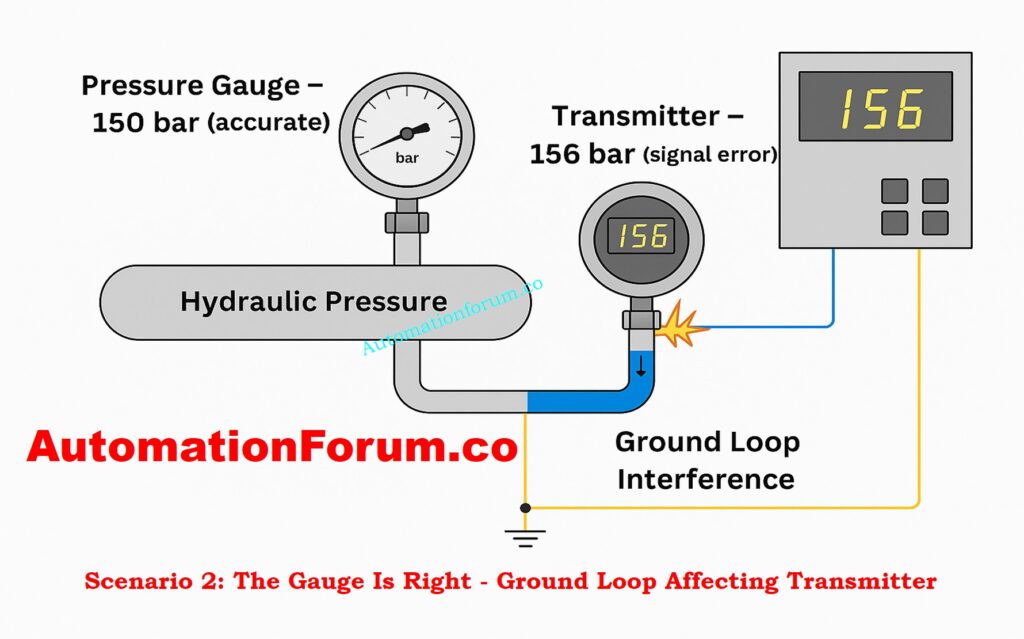

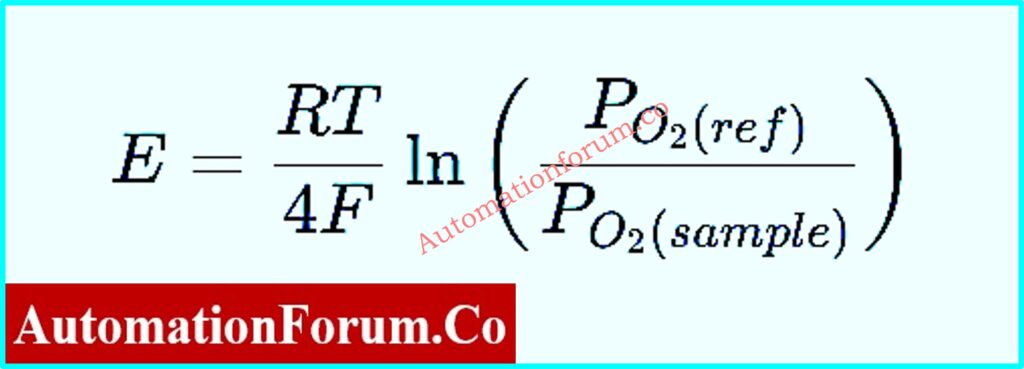
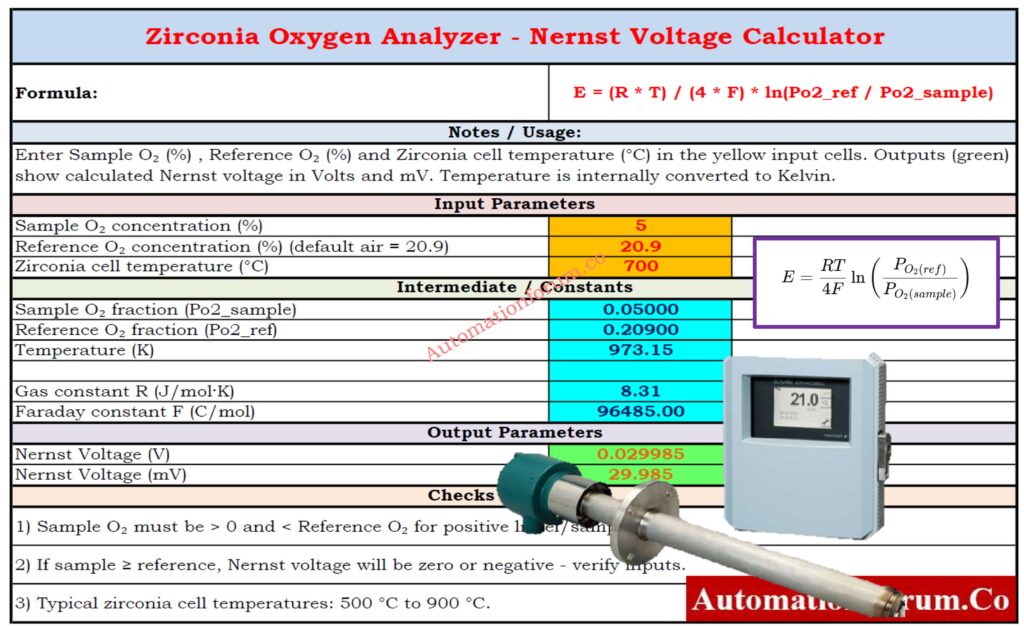
 Standards Every Engineer Should Know 1")