
- Control Valve Cavitation Calculator for Liquid Service Analysis
- What is Control Valve Cavitation and How Does It Occur?
- Why Does Control Valve Cavitation Occur?
- What Is Vena Contracta Pressure in a Control Valve?
- Control Valve Cavitation Calculator Inputs
- How to Calculate Control Valve Cavitation
- What is Sigma Index in Control Valve Cavitation?
- What Is Control Valve Recovery Factor FL?
- What Is Choked Flow in a Liquid Control Valve?
- Control Valve Cavitation vs Flashing
- What Does Safe Liquid Flow Mean in a Control Valve?
- Control Valve Cavitation Calculation Example
- How to Use the Control Valve Cavitation Calculator
- How to Interpret Control Valve Cavitation Calculator Results
- Control Valve Cavitation Troubleshooting
- How to Reduce Control Valve Cavitation
- Control Valve Selection for Cavitation Service
- Common Control Valve Cavitation Calculation Mistakes
- Control Valve Cavitation Engineering Best Practices
- Control Valve Cavitation Frequently Asked Questions
- Conclusion: Control Valve Cavitation Calculator and Cavitation Risk Assessment
Valve Cavitation Calculator
Control Valve Cavitation Analysis Schematic
Process Conditions
Valve Characteristics
Valve Cavitation Analysis Results
Pressure Profile Screening
| Parameter | Value |
|---|
Engineering Calculation Basis
The calculator uses the same screening concepts presented by the referenced valve cavitation tool: the Sigma index, pressure recovery factor, vena contracta pressure and choked pressure drop. Manufacturer coefficients should govern detailed control valve sizing.
Cavitation and Flashing Screening
Control Valve Cavitation Calculator for Liquid Service Analysis
Control valve cavitation is a common concern when a valve handles liquid service with a substantial pressure drop. The problem is not simply the amount of pressure lost between the inlet and outlet. Pressure can fall much lower inside the valve, particularly around the vena contracta, before recovering downstream.
If this local pressure falls below the liquid vapor pressure, vapor bubbles can form. When pressure subsequently recovers, these bubbles can collapse. Depending on the valve design and operating condition, the result can include noise, vibration, trim erosion and unstable operation.
The Control Valve Cavitation Calculator provides a practical screening method using inlet pressure, outlet pressure, vapor pressure, critical pressure and the valve recovery factor FL. It helps engineers examine the pressure conditions inside a liquid control valve before proceeding to detailed valve selection.
What is Control Valve Cavitation and How Does It Occur?
How Cavitation Forms Inside a Control Valve
Cavitation occurs when the local pressure of a flowing liquid falls below its vapor pressure and vapor bubbles form within the flow.
Inside a control valve, the minimum pressure does not necessarily occur at the downstream pressure tapping point. Flow accelerates through the restricted trim area and pressure can reach its lowest value near the vena contracta.
What Happens When Vapor Bubbles Collapse
When pressure recovers downstream, the vapor bubbles can collapse. Repeated bubble formation and collapse can produce severe local forces on valve trim and nearby surfaces.
Common Control Valve Cavitation Symptoms
In the field, cavitation may appear as unusual valve noise, vibration, unstable flow or progressive erosion. Maintenance teams may eventually find damaged trim or erosion in areas exposed to the collapsing bubbles.
Refer the below link for the Control Valve Leakage Calculator
Why Does Control Valve Cavitation Occur?
Effect of Control Valve Pressure Drop
The basic pressure relationship starts with the inlet pressure P1 and outlet pressure P2. Their difference gives the valve pressure drop.
Effect of Valve Geometry and Trim Design
However, the pressure profile through the valve depends on valve geometry and pressure recovery characteristics. Two valves operating with the same liquid, inlet pressure and outlet pressure can therefore experience different cavitation behavior.
The recovery factor FL is important because it represents the pressure recovery characteristics used in the calculator. Valve style, trim geometry and flow direction can influence the actual recovery behavior.
Effect of Valve Pressure Recovery
Vapor pressure is equally important. A liquid at higher temperature generally has a higher vapor pressure, so the same control valve may have a different cavitation condition when process temperature changes.
Test Your Cavitation Troubleshooting Skills With Real Plant Scenarios: Control Valve Cavitation Troubleshooting Quiz
What Is Vena Contracta Pressure in a Control Valve?
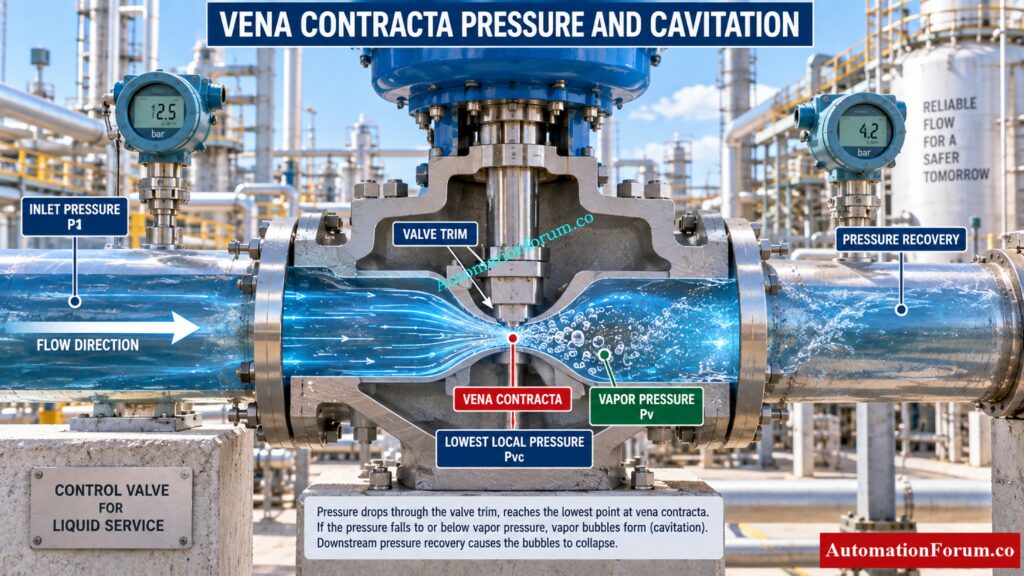
How Vena Contracta Pressure Develops
The vena contracta is the region where the flowing liquid reaches a highly restricted flow area and the local pressure can reach a minimum.
The calculator estimates vena contracta pressure using:
Pvc ≈ P1 − ΔP / FL²
Here, Pvc is the estimated vena contracta pressure.
Vena Contracta Pressure Compared With Vapor Pressure
If calculated Pvc remains above vapor pressure, the entered condition indicates comparatively lower cavitation risk.
If Pvc falls below vapor pressure, vapor formation becomes possible. The calculator then checks the downstream pressure to distinguish between cavitation risk and flashing risk.
This is useful during commissioning because the downstream pressure alone may look acceptable while the pressure near the valve trim is already low enough to produce vapor.
Discover Why Insufficient Torque Causes Serious Valve Actuator Failure: Control Valve Actuator Failure Due to Valve Torque
Control Valve Cavitation Calculator Inputs
| Parameter | Meaning | Engineering significance | Typical source |
| P1 | Absolute inlet pressure | Defines upstream pressure available to the valve | Process data sheet or operating data |
| P2 | Absolute outlet pressure | Determines valve pressure drop | Process design or operating data |
| Pv | Liquid vapor pressure | Determines when vapor formation can begin | Fluid property data at actual temperature |
| Pc | Critical pressure | Used to calculate the critical pressure factor FF | Fluid property data |
| FL | Liquid pressure recovery factor | Influences vena contracta pressure and choked pressure drop | Valve manufacturer data |
Why Absolute Pressure Is Required for Cavitation Calculation
The calculator requires absolute pressure for P1, P2, Pv and Pc. Gauge pressure should not be entered directly into these equations because vapor pressure and critical pressure are absolute pressure quantities.
Why Vapor Pressure Must Match Operating Temperature
Vapor pressure must also correspond to the actual liquid temperature. Using vapor pressure from a different temperature can change the cavitation assessment significantly.
The calculator provides screening FL values for globe valve, high recovery globe, ball valve and butterfly valve service. These values are intended for preliminary assessment. Certified manufacturer data should be used for final sizing and valve selection.
Uncover Why Your Control Valve Hunts Only Automatically: Why Control Valve Hunts in AUTO but Runs Smoothly in MANUAL
How to Calculate Control Valve Cavitation
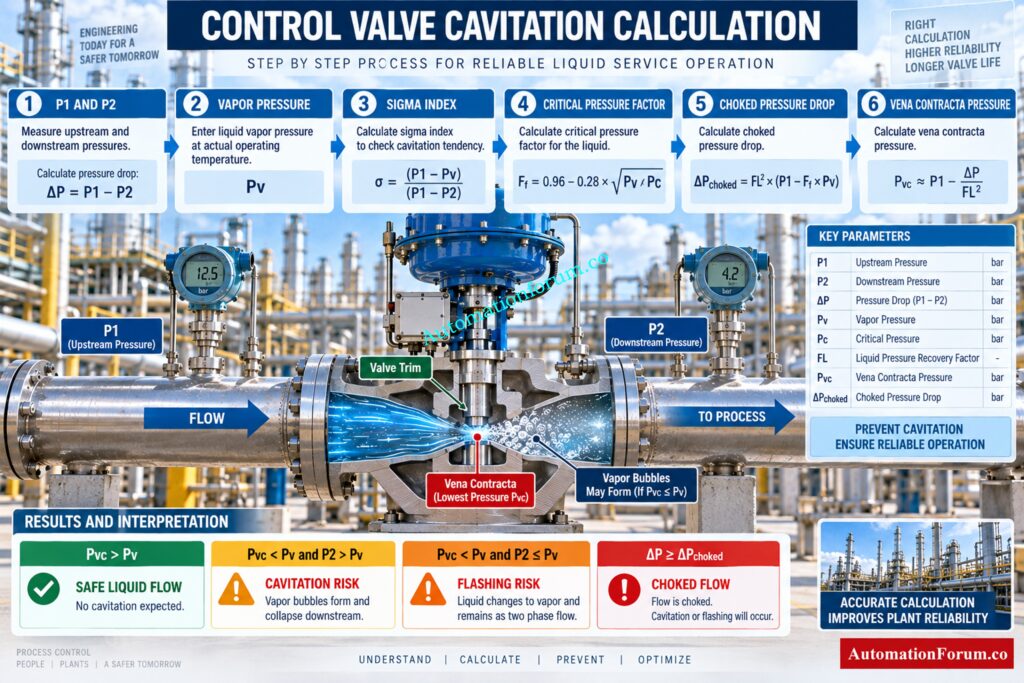
The calculator follows a defined sequence.
First, pressure drop is calculated:
ΔP = P1 − P2
This represents the total pressure difference across the valve.
The sigma index is then calculated:
σ = (P1 − Pv) / (P1 − P2)
The critical pressure factor is calculated using:
Ff = 0.96 − 0.28 × √(Pv / Pc)
The choked pressure drop is then determined:
ΔPchoked = FL² × (P1 − Ff × Pv)
Finally, the calculator estimates the vena contracta pressure:
Pvc ≈ P1 − ΔP / FL²
The calculator then compares these computed values with the process conditions entered to determine the expected flow condition.
Identify Critical Control Valve Failures Before Plant Shutdowns: What Are the Most Common Failure Modes of Control Valves?
What is Sigma Index in Control Valve Cavitation?
The sigma index compares the pressure available above vapor pressure with the pressure drop across the valve.
σ = (P1 − Pv) / (P1 − P2)
A higher pressure drop increases the denominator and therefore tends to reduce the sigma value. A higher vapor pressure also reduces the numerator.
The sigma index is useful for understanding the pressure relationship, but it should not be treated as a universal pass or fail limit. Acceptable cavitation performance depends on valve construction, trim design, manufacturer recommendations and actual service conditions.
For detailed valve selection, the manufacturer’s applicable cavitation criteria should govern the final decision.
Find Out Why Your Fully Closed Valve Still Passes: Control Valve Passing Even When Fully Closed: Causes, Symptoms, Troubleshooting and Solutions
What Is Control Valve Recovery Factor FL?
FL is the liquid pressure recovery factor used to describe how the valve recovers pressure after the restricted flow region.
It has a direct effect on the calculated vena contracta pressure and choked pressure drop. Since FL is squared in the calculator relationships, changes in FL can have a noticeable effect on the result.
The calculator uses approximate screening values for different valve styles. These values should not be treated as universal manufacturer coefficients.
Actual FL can depend on valve geometry, trim configuration and flow direction. During final control valve sizing, certified manufacturer data for the selected valve and trim should be used.
Calculate Pneumatic Air Demand Before Sizing Your Instrument Air: Air Consumption Calculator for Pneumatic Control Valves, Actuators and Instrument Air System Sizing
What Is Choked Flow in a Liquid Control Valve?
Liquid choked flow occurs when the pressure drop reaches the calculated limit at which increasing the pressure drop does not continue to produce proportional additional flow.
The calculator determines this limit using:
ΔPchoked = FL² × (P1 − Ff × Pv)
If the pressure drop is more than or equal to the calculated value the condition obstructed flow will be shown in the calculator.
This matters during valve sizing because simply increasing the pressure drop in the calculation does not necessarily mean that the liquid flow will increase proportionally. Valve sizing and trim selection should therefore consider the possibility of choked liquid flow.
Refer the below link for the Control Valve Flow Characteristic Calculator: Linear, Equal Percentage, and Quick Opening Guide
Control Valve Cavitation vs Flashing
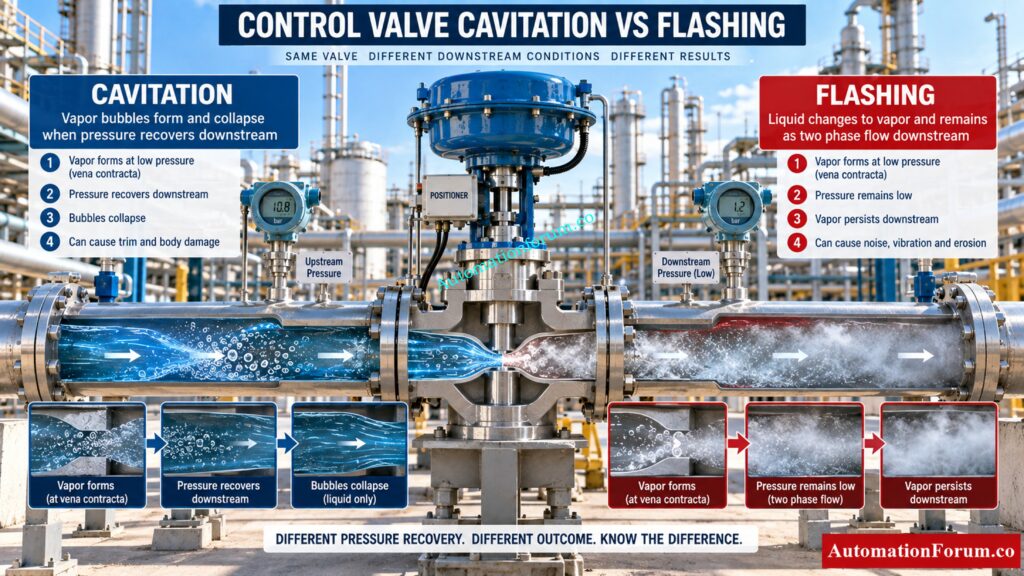
| Condition | Pressure behavior | Vapor behavior | Typical concern | Engineering response |
| Safe liquid flow | Pvc remains above Pv | No vapor formation predicted by the screening calculation | Lower cavitation risk | Verify detailed valve sizing |
| Cavitation risk | Pvc falls below Pv and P2 is above Pv | Bubbles form and can collapse after pressure recovery | Noise, vibration and erosion | Review trim and valve design |
| Flashing risk | Pvc falls below Pv and P2 remains at or below Pv | Vapor can persist downstream | Two phase erosion and flow problems | Review valve and downstream design |
| Choked flow | Actual ΔP reaches or exceeds calculated choked ΔP | Flow becomes pressure limited | Limited additional flow response | Review sizing and trim |
How Vena Contracta Pressure Identifies Cavitation or Flashing
Cavitation and flashing should not be treated as the same condition.
Cavitation occurs when pressure falls below vapor pressure and subsequently recovers above it. Flashing occurs when the pressure remains at or below vapor pressure downstream, allowing vapor to persist.
Master Split Range Operation Across PLC And DCS Systems: Split Range Calculator for Control Valves in PLC and DCS Systems
What Does Safe Liquid Flow Mean in a Control Valve?
If the predicted vena contracta pressure is above the vapor pressure, the calculator establishes safe liquid flow.
This implies a somewhat lower probability of cavitation for the entered conditions. This does not mean the valve is automatically approved for the application.
Real valve performance still is dependant on selected valve, trim, flow direction, process circumstances and manufacturer recommendations.
Choose The Correct Valve Action Before Final Instrumentation Design: When to Choose Forward and Reverse Acting Control Valves for Design Engineer
Control Valve Cavitation Calculation Example
Assume a liquid control valve with the following conditions:
P1 = 20 bar absolute
P2 = 10 bar absolute
Pv = 2.34 bar absolute
Pc = 220.6 bar absolute
FL = 0.90
Step 1 Calculate Control Valve Pressure Drop
ΔP = 20 − 10 = 10 bar
Step 2 Calculate Sigma Index
σ = (20 − 2.34) / (20 − 10)
σ = 1.766
Step 3 Calculate Critical Pressure Factor
Ff = 0.96 − 0.28 × √(2.34 / 220.6)
Ff ≈ 0.9312
Step 4 Calculate Choked Pressure Drop
ΔPchoked = 0.90² × (20 − 0.9312 × 2.34)
ΔPchoked ≈ 14.435 bar
The actual pressure drop is 10 bar, which is below the calculated choked pressure drop.
Step 5 Calculate Vena Contracta Pressure
Pvc ≈ 20 − 10 / 0.90²
Pvc ≈ 7.654 bar absolute
How to Interpret the Calculated Cavitation Result
The predicted vena contracta pressure of roughly 7.654 bar absolute stays higher than the vapor pressure of 2.34 bar absolute.
So the calculator predicts:
SAFE LIQUID FLOW
The computed vena contracta pressure is still higher than vapor pressure for this given scenario. The result indicates lower cavitation risk within this screening calculation.
Calculate Accurate Control Valve Capacity Before Valve Selection: Control Valve Sizing Calculator: Complete ISA S75.01 Cv Calculation Guide for Instrumentation Engineers
How to Use the Control Valve Cavitation Calculator
Enter the upstream pressure as absolute pressure.
Enter the downstream pressure as absolute pressure and make sure it is lower than P1.
Enter vapor pressure corresponding to the actual liquid temperature.
Enter the fluid critical pressure.
Select the valve type or enter a manufacturer FL value when appropriate.
For preliminary screening, the calculator provides approximate FL values. For final engineering verification, replace the screening value with certified manufacturer data.
Run the calculation and review the predicted regime.
Pay particular attention to vena contracta pressure, vapor pressure and choked pressure drop. The final engineering decision should then be checked against detailed valve sizing information and manufacturer recommendations.
Stop Control Valve Hunting By Finding PID Tuning Problems: Control Valve Hunting Due to PID Controller: Causes, Effects, Root Analysis and Complete Troubleshooting
How to Interpret Control Valve Cavitation Calculator Results
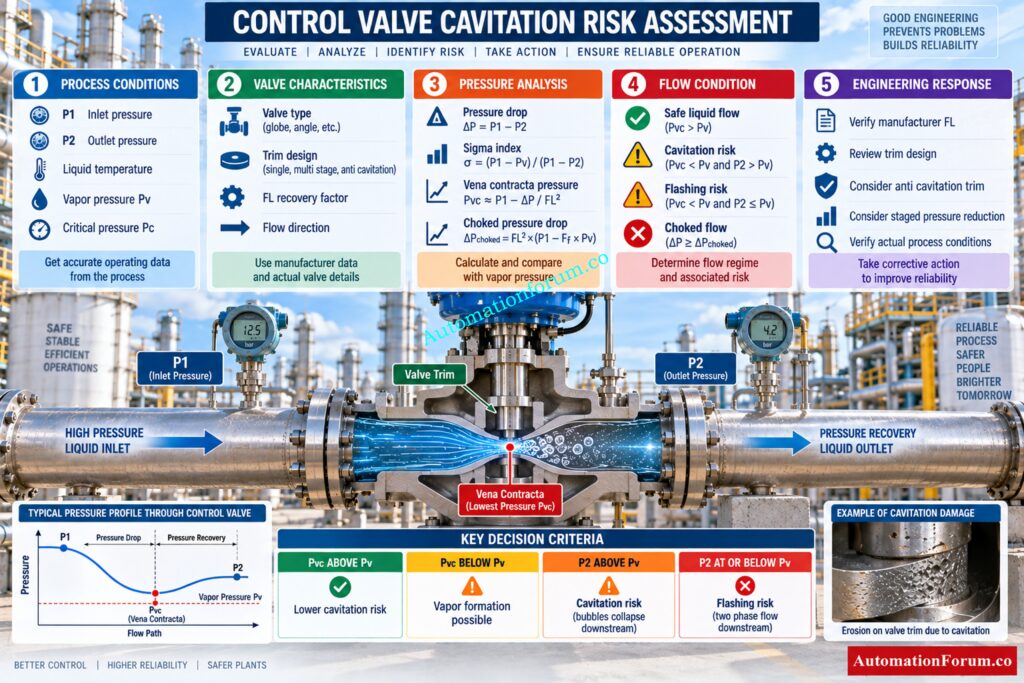
Predicted Flow Regime: Indicates the flow regime the calculator predicts based on the parameters entered.
Pressure Drop: Difference between intake and output pressure.
Vena Contracta Pressure: Calculates the minimal pressure by utilizing the calculator relationship.
Sigma Index: Indicates the pressure relationship between vapor pressure and valve pressure drop.
Liquid Choked Pressure Drop: Calculated pressure drop due to liquid choking.
Choked Pressure Drop: Indicates the calculated pressure drop associated with liquid choking.
Critical Pressure Factor: Represents the calculated Ff value used in the choked pressure relationship.
Control Valve Cavitation Troubleshooting
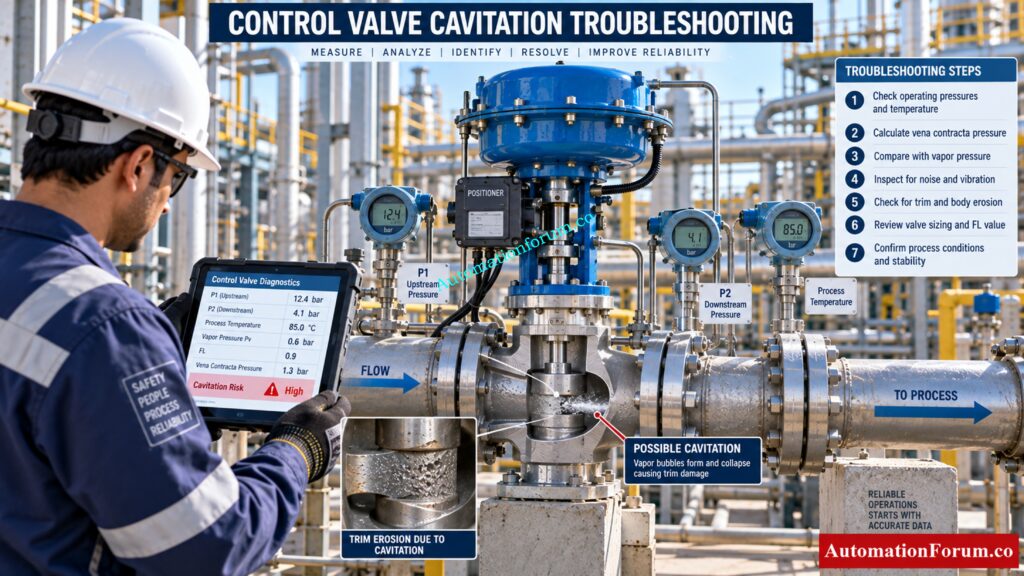
When unexpected valve noise appears, check actual inlet and outlet pressure first. Compare the measured values with the design case rather than assuming that the valve has suddenly developed a mechanical fault.
For vibration, inspect valve trim condition, valve supports, downstream piping and operating stability. Cavitation can create vibration, but loose supports or other hydraulic problems can produce similar symptoms.
If there is trim erosion, compare the position of the damage to the projected pressure recovery region. Check the actual process temperature and pressure.
If erosion is present in downstream piping, check if flashing or two phase flow is continuing after the valve.
For unstable flow, verify process pressure, temperature and valve operating position. A valve operating significantly away from its design condition can behave differently from the original sizing case.
Incorrect vapor pressure is another common source of misleading analysis. Confirm the liquid composition and actual operating temperature.
Finally, verify FL. An approximate value can be useful for screening, but final troubleshooting and valve selection should use the actual manufacturer’s coefficient.
Avoid Commissioning Problems With This Control Valve SAT Guide: Control Valve Site Acceptance Test (SAT) Procedure – Step-by-Step Field Guide
How to Reduce Control Valve Cavitation
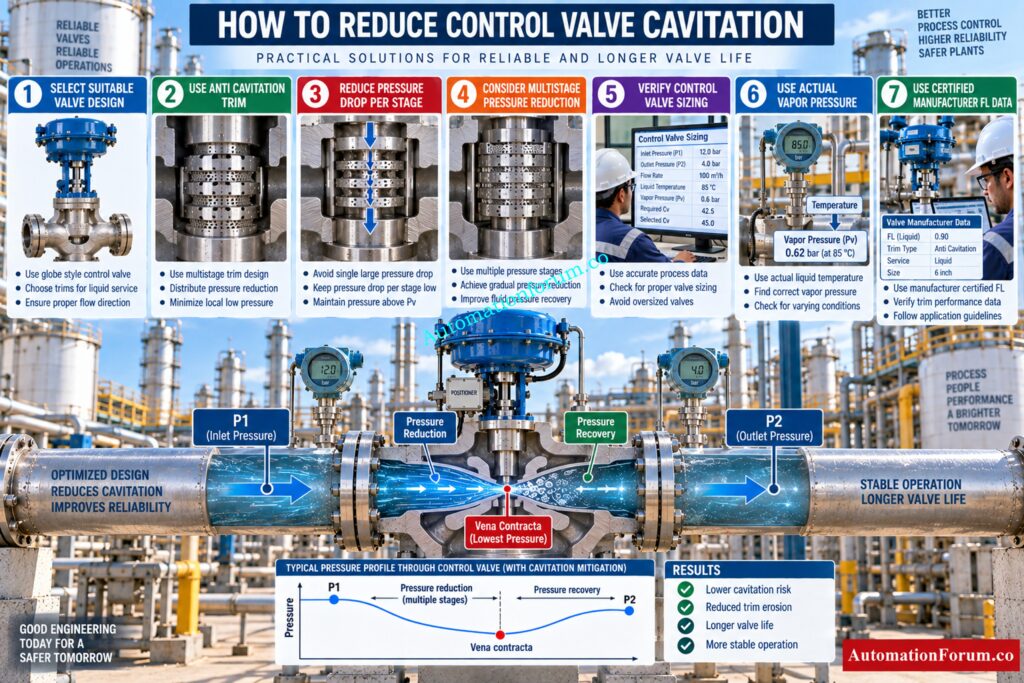
The appropriate solution depends on the pressure drop, liquid properties, flow rate and valve construction.
Possible engineering approaches include selecting suitable valve geometry, using anti cavitation trim, distributing pressure reduction across multiple stages and changing the valve sizing where appropriate.
Increasing downstream pressure may also reduce the severity of the pressure condition when the process design permits it.
For severe service, review the manufacturer’s cavitation data rather than relying only on a basic pressure calculation.
Explore Essential Valve Calculation Tools Every Engineer Should Know: Top Essential Control Valve Calculators and Excel Tools for Instrumentation Engineers
Control Valve Selection for Cavitation Service
Before selecting a valve, review flow rate, liquid properties, operating temperature, vapor pressure, inlet pressure, outlet pressure and total pressure drop.
The valve size, FL, trim geometry and flow direction should also be evaluated. Noise requirements, material compatibility and cavitation resistance may become important for severe liquid service.
Selecting a valve based only on Cv can be insufficient when the valve experiences a large liquid pressure drop. The pressure recovery characteristics and trim design must also be considered.
Predict Excessive Valve Noise Before It Becomes Costly: Control Valve Noise Prediction Calculator – IEC 60534 Based Engineering Tool
Common Control Valve Cavitation Calculation Mistakes
Using gauge pressure directly in the calculation can produce an incorrect result.
Application of vapor pressure from the inappropriate liquid temperature can also greatly affect assessment.
Another typical mistake is to use an approximate FL value for final valve sizing. Screening values are useful for a first screening, but comprehensive computations should be based on confirmed manufacturer data.
Engineers should also avoid confusing cavitation with flashing, ignoring choked flow or treating a calculator result as final valve approval.
Always check whether actual operating conditions still match the original design case.
Find The Real Cause Behind Post Overhaul Valve Passing: How to Troubleshoot a Control Valve Passing Problem after Overhauling: Complete Root Cause Analysis
Control Valve Cavitation Engineering Best Practices
Use absolute pressure consistently.
Obtain vapor pressure at actual operating temperature.
Check the real process pressure drop during commissioning.
Use manufacturer certified FL data for final sizing.
Review vena contracta pressure rather than looking only at downstream pressure.
Distinguish cavitation from flashing.
Check choked flow during liquid valve sizing.
Consider trim design for severe pressure reduction.
Compare calculated results with manufacturer recommendations before final selection.
Prepare Accurate Control Valve Datasheets Without Costly Engineering Errors: How to Prepare Control Valve Datasheets: A Step-by-Step Procedure for EPC Instrumentation Engineers
Control Valve Cavitation Frequently Asked Questions
What is the cavitation formula?
Control valve cavitation analysis commonly uses pressure drop, vapor pressure, recovery factor FL and vena contracta pressure.
In this calculator, the key screening relationship is Pvc ≈ P1 − ΔP / FL².
What is cavitation in a control valve?
Control valve cavitation occurs when local liquid pressure falls below vapor pressure and vapor bubbles form near the valve trim.
When pressure recovers downstream, these bubbles can collapse and cause noise, vibration and erosion.
How to calculate control valve?
Control valve analysis starts with inlet pressure, outlet pressure, vapor pressure, critical pressure and recovery factor FL.
The calculator uses these values to determine pressure drop, sigma index, vena contracta pressure and choked pressure drop.
Determine Correct Control Valve Stroke Requirements Before Installation: Control Valve Stroke Length Calculator
What is rated Cv and calculated Cv?
The rated Cv is the flow capacity of a control valve at its rated condition and the calculated Cv is based on the actual process needs.
Engineers, in sizing and selecting control valves, compare the calculated Cv to the capacity available in the valve.
How to calculate Cv formula?
The Cv of control valve is computed from needed flow rate, pressure drop and fluid characteristics using the suitable liquid or gas sizing relationship.
Final valve sizing should be based on the manufacturer’s sizing technique and certified valve data.
What is Cv maximum?
Maximum Cv is the maximum flow capacity a given control valve can pass at its rated opening and defined conditions.
The actual usable capacity depends on valve size, trim design, pressure drop and the manufacturer’s published data.
What causes control valve cavitation?
Cavitation can occur when pressure at the valve vena contracta falls below the liquid vapor pressure and then recovers downstream.
High pressure drop, liquid temperature, vapor pressure and valve recovery characteristics can all influence the risk.
What is vena contracta pressure?
The vena contracta pressure is the lowest local pressure that the liquid develops in the vicinity of the limited flow region of a control valve.
The computed Pvc can be compared with the vapor pressure to indicate the locations of cavitation or flashing.
Master Field Proven Control Valve Calibration Without Guesswork: Control Valve Calibration Procedures
Why is vapor pressure important?
Vapor pressure is the pressure at which the vapor can begin to develop at a certain temperature.
For a successful control valve cavitation study, it is vital to use the vapor pressure at the actual operating temperature.
What does FL mean in control valve sizing?
FL is the liquid pressure recovery factor used to represent pressure recovery behavior through a control valve.
For final sizing, engineers should use the certified FL value supplied for the selected valve, trim and flow direction.
What is choked flow in a liquid control valve?
Choked flow is the condition when the pressure drop across the valve is equal to the calculated choked pressure drop and further pressure drop will not increase the flow accordingly.
This circumstance must be considered while sizing the liquid control valve to avoid the selection of the wrong valve or trim characteristics.
What is the difference between cavitation and flashing?
Cavitation occurs when vapor forms at low pressure and then collapses when pressure recovers above vapor pressure.
Flashing occurs when downstream pressure remains at or below vapor pressure, allowing vapor to continue through the downstream piping.
Can anti cavitation trim eliminate all cavitation?
Anti cavitation trim is designed to control pressure reduction and reduce the damaging effects associated with liquid pressure recovery.
Its effectiveness depends on process conditions, valve design, trim configuration and the manufacturer’s application recommendations.
Is Cv alone enough for control valve sizing?
Cv alone may not be sufficient for liquid service with a high pressure drop because cavitation, flashing and choked flow can also affect valve performance.
Engineers should review FL, vapor pressure, vena contracta pressure, trim design and actual operating conditions.
How should control valve cavitation be troubleshot?
Check actual inlet pressure, outlet pressure, process temperature and liquid properties before comparing the condition with the original valve sizing data.
Then inspect the valve trim and downstream piping for noise, vibration, erosion or other evidence of cavitation and flashing.
How is control valve cavitation risk calculated?
Cavitation risk can be screened by calculating pressure drop, sigma index and vena contracta pressure and comparing Pvc with liquid vapor pressure.
The final assessment should also consider valve geometry, certified FL data, operating conditions and manufacturer recommendations.
How can control valve cavitation be reduced?
Cavitation can sometimes be reduced by selecting suitable valve geometry, anti cavitation trim or staged pressure reduction.
The correct solution depends on pressure drop, liquid properties, temperature, flow rate and the selected valve design.
Calculate Equal Percentage Valve Behavior With Confidence Before Selection: Equal Percentage Control Valve Flow Calculator
Conclusion: Control Valve Cavitation Calculator and Cavitation Risk Assessment
The Control Valve Cavitation Calculator is useful for preliminary engineering screening of liquid control valve service. It provides a practical way to examine pressure drop, sigma index, critical pressure factor, vena contracta pressure and choked pressure drop.
A lower calculated cavitation risk does not guarantee zero cavitation or final valve suitability. For final control valve sizing and cavitation protection, use accurate process data, applicable engineering standards and certified manufacturer coefficients for the selected valve and trim.
Refer the below link for the Inspection and Test Plan (ITP) for Control Valves
