
Instrument Rangeability & Span Calculator
Verify transmitter LRV/URV settings against sensor limits, calculate span, turndown ratio, ADC resolution, and hysteresis for any process transmitter per ISA-51.1 and IEC 60770 standards.
- Instrument Range Calculator for Pressure, Flow, Level & Temperature Transmitters
- The Importance of Proper Instrument Range Configuration
- What Is Instrument Range?
- What Is Instrument Span?
- Why Correct Instrument Range Selection Is Important
- Understanding Sensor Limits in Industrial Transmitters
- Understanding Transmitter Calibration Range
- Instrument Range vs Calibration Range
- What Does This Instrument Range Calculator Calculate?
- Instrument Range Calculator Input Parameters Explained
- Instrument Range Calculator Results Explained
- Instrument Range Calculation Example
- Instrument Range Visualization Explained
- Signal Scaling Table Explained
- Instrument Range Selection Best Practices
- Frequently Asked Questions on Instrument Range Calculator
- What is the difference between LRL and LRV?
- Why is span important?
- How to calculate instrument range?
- What is the formula for calculating range?
- How to calculate URV and LRV?
- What is a good turndown ratio?
- Why does the calculator perform validation checks?
- Can this calculator be used for different transmitter types?
- Conclusion: Selecting the Right Instrument Range for Reliable Process Measurement
Instrument Range Calculator for Pressure, Flow, Level & Temperature Transmitters
The Importance of Proper Instrument Range Configuration
One of the most critical jobs in industrial instrumentation is selecting the suitable transmitter range. A correctly designed transmitter ensures precise measurements, consistent process control, dependable alarms and longer equipment life. But on the other side, if the calibration range is improper, it can lead to bad control performance, unnecessary maintenance and wrong process data even if the transmitter itself is performing well.
Every pressure, differential pressure, temperature, level, and flow transmitter has a fixed sensor capability defined by the manufacturer. During commissioning, engineers configure the transmitter so that the expected process values are converted into a standard output signal such as 4 to 20 mA. By choosing the appropriate Lower Range Value and Upper Range Value , the measuring potential of the instrument is utilized to the fullest extent with the required accuracy .
The Instrument Range Calculator makes the work easier by bringing all of the engineering calculations into one location. The engineers can verify sensor limits, compute calibrated span, assess the rangeability, calculate turndown ratio, estimate measurement resolution, validate calibration settings and ensure that the selected range encompasses the actual operating process without the hassle of performing multiple manual calculations.
The calculator also provides a graphical representation of the configured range and generates a signal scaling table that can be used during loop checking and commissioning.
Stop Guessing Valve Outputs With This Proven Engineering Method: Split Range Calculator for Control Valves in PLC and DCS Systems
What Is Instrument Range?
Instrument Range Definition
Instrument range is the complete measuring capability of a sensor. The minimum and maximum values that the sensing element can measure when it operates within its set performance limits.
Instrument Range Example
For example, a pressure transmitter with a sensor rated from 0 psi to 250 psi has an instrument range of 0 psi to 250 psi. The manufacturer defines these limits and they cannot be extended by means of software configuration or calibration.
Instrument Range vs Calibration Range
Why Instrument Range Is Important
Selecting a sensor with an adequate range results in enhanced measurement accuracy, greater signal resolution and better process control.
Refer the below link for the Calibration Interval Schedule Procedure for Process Instrumentation Using Risk-Based Method
What Is Instrument Span?
Instrument Span Definition
Instrument spread is the difference between the specified Upper Range Value and Lower Range Value .
Instrument Span Formula
Formula
Span = URV − LRV
Span Calculation Example
Consider a transmitter configured with the following values.
Lower Range Value
20 psi
Upper Range Value
180 psi
Span
180 − 20 = 160 psi
Why Proper Span Selection Improves Accuracy
- Although the sensor can measure from 0 psi to 250 psi, the transmitter converts only the calibrated span of 20 psi to 180 psi into the output signal. Every value within this span is represented proportionally between 4 mA and 20 mA.
- A properly selected span improves control loop performance because it uses more of the transmitter’s measuring capability within the actual operating range.
Why Correct Instrument Range Selection Is Important
Effect on Measurement Accuracy
- Proper range selection is not simply a calibration activity. It directly influences measurement quality throughout the life of the plant.
- Suppose a refinery discharge pressure normally operates between 150 psi and 200 psi.
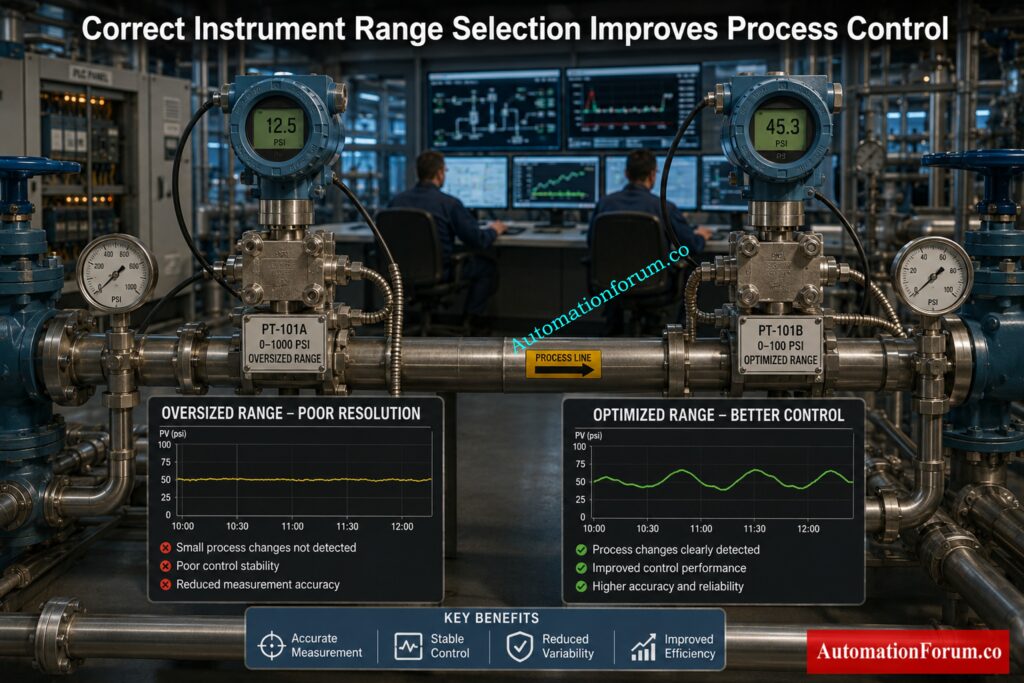
- Using a transmitter calibrated from 0 psi to 400 psi means the process occupies only a small portion of the available measuring range. The measurement is less sensitive, i.e. small changes in pressure are less visible.
- If the same transmitter is calibrated from 140 psi to 220 pressure , the possible resolution is focused in the actual operational range . Operators get better meaningful trends. Controllers respond faster and the process is more stable.
Common Range Selection Mistakes
- Proper range selection also avoids needless transmitter saturation, lowers false alarms, and enhances overall control accuracy.
- Many commissioning problems originate from incorrect calibration values rather than defective instruments.
Avoid Costly Sizing Errors Every Instrument Engineer Must Know: Understanding Rangeability vs Turndown Ratio in Control Valve Sizing
Understanding Sensor Limits in Industrial Transmitters
All transmitters start with fixed sensor limits. These parameters determine the physical functioning capabilities of the sensing element and are the foundation for every calculation performed by the Instrument Range Calculator.
Lower Range Limit (LRL)
The Sensor Lower Range Limit, or LRL, is the smallest number that the sensor element can really measure.
Examples include
Pressure transmitter
0 psi
Differential pressure transmitter
Minus 250 mbar
Temperature transmitter
Minus 50°C
The configured calibration must never extend below this limit.
Upper Range Limit (URL)
The Sensor Upper Range Limit, or URL, is the highest value the sensor can accurately measure.
Examples include
250 psi
1000 mbar
600°C
20 metres
500 cubic metres per hour
Any calibration above this value exceeds the capability of the sensor and produces unreliable measurements.
Sensor Range Formula
Sensor Range = URL − LRL
For a transmitter rated from 0 psi to 250 psi
Sensor Range = 250 psi
This value forms the basis for calculating span utilization, minimum allowable span, and turndown ratio.
Master Advanced Valve Sequencing Used In Modern Process Plants: Understanding Control Valve Functions in Complementary, Exclusive and Progressive Split-Range Control Systems
Understanding Transmitter Calibration Range
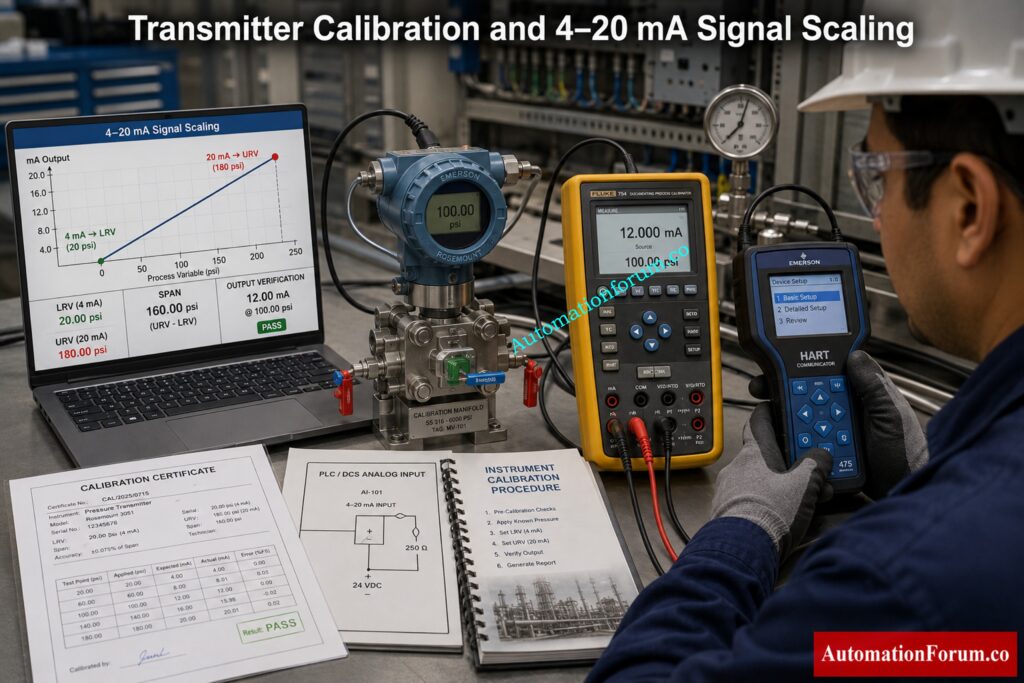
Calibration configures how the transmitter converts process values into an electrical output signal.
The calculator allows engineers to define the calibrated operating range by entering the Lower Range Value and Upper Range Value along with the minimum and maximum output signal. These parameters determine how the transmitter behaves during normal operation.
Lower Range Value (LRV)
The Lower Range Value represents the process value corresponding to the minimum output signal.
For a standard analog transmitter
4 mA = LRV
If the LRV is set to 20 psi, the transmitter outputs exactly 4 mA when the process pressure reaches 20 psi.
Eliminate Pressure Measurement Errors Using Proven Smart Transmitter Techniques: Smart Pressure Transmitter Sensor Trim Guide with Diagrams & Calibration Steps
Upper Range Value (URV)
The Upper Range Value represents the process value corresponding to the maximum output signal.
20 mA = URV
If the URV is configured as 180 psi, the transmitter produces 20 mA at that pressure.
Output Signal Scaling
The calculator supports configurable output limits, allowing engineers to work with standard industrial analog signals such as 4 to 20 mA or voltage based outputs where required. This flexibility makes the calculator suitable for pressure, flow, level, temperature, and other process measurements.
Learn The Critical Difference Before Selecting Any Pressure Instrument: Rangeability vs. Turndown Ratio and their Implications for Pressure Transmitter Selection
Instrument Range vs Calibration Range
Meet Compliance Requirements With This Essential Engineering Reference: ISO Standards For Instrumentation Calibration Complete Guide for Industrial Engineers
Key Differences
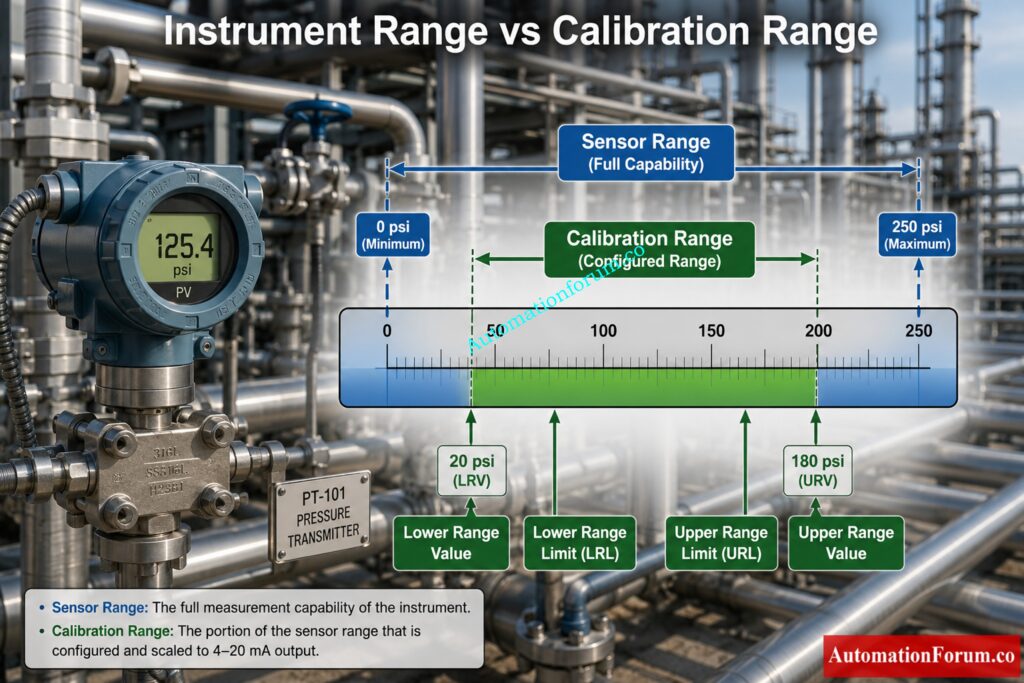
Understanding the difference between sensor range and calibrated range is essential for selecting and configuring transmitters correctly. These two terms are often used interchangeably, but they describe different characteristics of an instrument.
The sensor range defines the physical measuring capability of the sensing element. It is established by the manufacturer and remains unchanged throughout the life of the transmitter. The calibrated range, on the other hand, is selected by the engineer to match the actual operating conditions of the process.
Comparison Table
| Parameter | Sensor Range | Calibrated Range |
| Defined by | Manufacturer | Instrument Engineer |
| Can be changed | No | Yes |
| Purpose | Physical measuring capability | Process measurement |
| Based on | Sensor design | Process requirement |
| Example | 0 to 250 psi | 20 to 180 psi |
Unlock The Split Logic Engineers Use For Smooth Control: Understanding Complementary Split Range Control (CSRC)
Practical Engineering Example
For example, a pressure transmitter may have a sensor capable of measuring from 0 psi to 250 psi. If the actual process normally operates between 20 psi and 180 psi, configuring the transmitter within this operating window provides better measurement quality than using the entire sensor range.
What Does This Instrument Range Calculator Calculate?
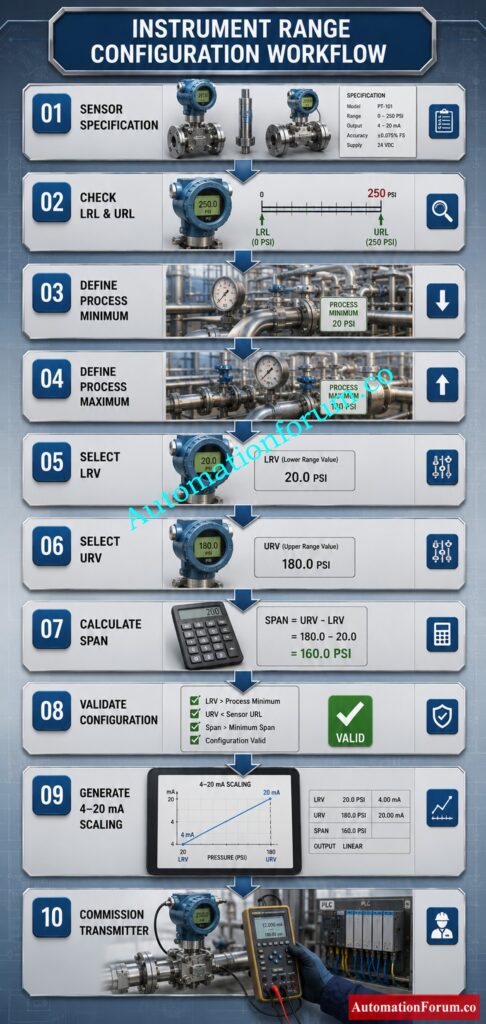
The Instrument Range Calculator brings together a number of engineering calculations into one tool which makes it simpler to configure transmitters correctly during the design, calibration, commissioning and maintenance stages.
Engineers can validate all key parameters before putting the transmitter into service without doing separate calculations using spreadsheets or hand-held calculators.
The calculator performs tasks such as
- Calculates calibrated span
- Calculates sensor range
- Calculates process range
- Determines rangeability
- Calculates transmitter turndown ratio
- Calculates ADC resolution
- Calculates hysteresis error
- Calculates accuracy error
- Verifies calibration limits
- Checks minimum allowable span
- Validates process coverage
- Generates signal scaling values
- Displays engineering visualization
- Performs calibration checks
- Displays PASS, WARNING, or FAIL status based on the entered values.
Prevent Measurement Failures By Choosing The Correct Instrument Limits: How do you select an appropriate measuring range for an instrument?
Instrument Range Calculator Input Parameters Explained
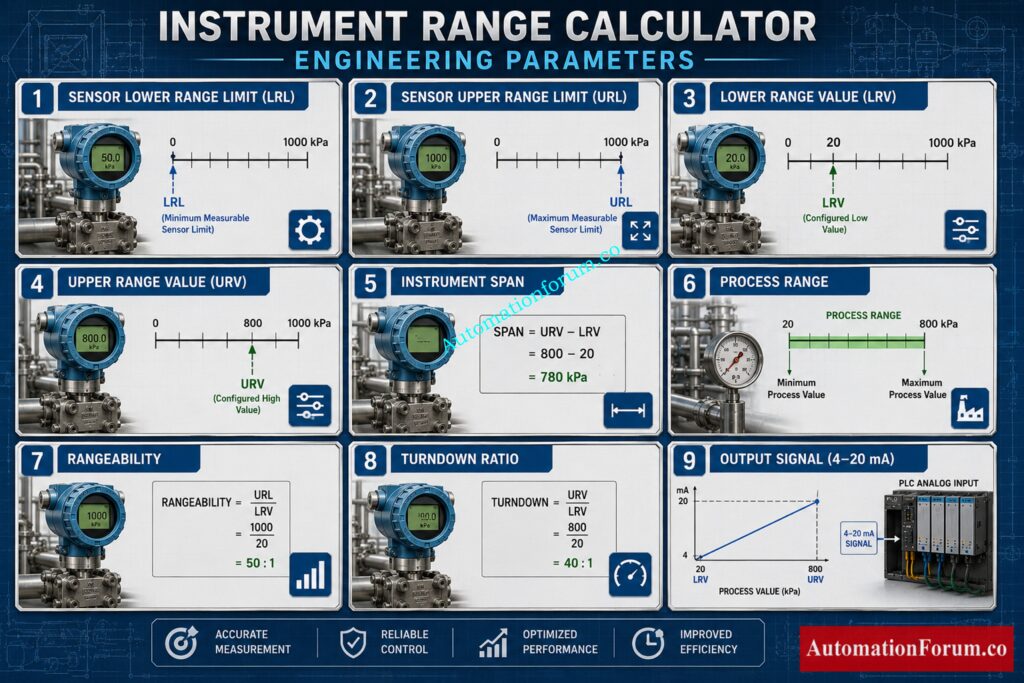
The calculator includes several input fields that represent the transmitter, sensor, and process requirements. Each field has a specific engineering purpose.
Sensor Lower Range Limit
This is the minimum value the sensor can physically measure.
Example
0 psi
The calculator checks whether the configured LRV falls within this limit.
Sensor Upper Range Limit
This is the maximum measurable value of the sensing element.
Example
250 psi
The configured URV must always remain below this value.
Process Minimum
This is the lowest process value expected during normal plant operation.
For example, if a storage tank level never falls below 2 metres, then the process minimum should be entered as 2 metres.
The calculator verifies whether this value lies inside the configured calibration span.
Process Maximum
This represents the highest operating process value.
Using realistic operating limits instead of equipment design limits helps improve measurement resolution and controller performance.
Lower Range Value
The Lower Range Value corresponds to the minimum transmitter output.
For a standard analog transmitter
4 mA equals LRV
This value should normally be equal to or slightly lower than the expected minimum process value to provide adequate operating margin.
Upper Range Value
The Upper Range Value corresponds to the maximum transmitter output.
20 mA equals URV
Selecting a realistic URV prevents unnecessary loss of measurement resolution.
Output Signal
The calculator allows engineers to specify the minimum and maximum analog output.
Typical values include
4 to 20 mA
0 to 20 mA
0 to 10 volts
This flexibility allows the calculator to support a wide variety of industrial transmitters and control systems.
Engineering Unit
Every measurement requires an engineering unit.
Common examples include
- psi
- bar
- kPa
- MPa
- °C
- °F
- metres
- millimetres
- litres per minute
- cubic metres per hour
- kilograms per hour
- pH
- Percent Relative Humidity
The calculator also supports custom engineering units, making it suitable for specialized industrial applications.
Instantly Calculate Accurate Valve Operating Points Without Manual Errors: Split Range Calculator – Control system
ADC Resolution
Modern smart transmitters convert analog sensor signals into digital values before generating the output signal.
The ADC resolution determines how many digital steps are available.
Higher bit resolution provides finer measurement accuracy.
Typical selections include
- 8 bit
- 10 bit
- 12 bit
- 14 bit
- 16 bit
- 20 bit
- 24 bit
The calculator uses the selected ADC resolution to determine the smallest measurable change in the calibrated span.
Instrument Hysteresis
Hysteresis is the difference between increasing and decreasing measurements at the same process value.
Although modern transmitters have very small hysteresis, it still contributes to total measurement uncertainty.
The calculator converts the entered hysteresis percentage into an actual engineering value based on the selected span.
Instrument Accuracy
Accuracy represents the maximum expected measurement error under reference operating conditions.
Rather than displaying only the percentage value, the calculator converts it into an absolute engineering error based on the configured span.
This allows engineers to understand the actual measurement uncertainty under field conditions.
Avoid Expensive Inspection Errors With Proven Industrial Practices: Calibration Vs Verification: Key Differences, Procedures, Examples and Best Practices In Process Industries
Adjustable Zero
Many smart transmitters allow zero adjustment within specified manufacturer limits.
The calculator checks whether the configured Lower Range Value falls within the allowable zero adjustment range.
This validation helps prevent calibration settings that exceed the transmitter’s adjustment capability.
Minimum Span
Every transmitter has a minimum allowable span specified by the manufacturer.
If the configured span becomes too small, the transmitter may not maintain its published accuracy.
The calculator compares the configured span with the required minimum span and immediately identifies configurations that should be avoided during commissioning.
Protect Measurement Accuracy Before Your Test Equipment Fails: Why Calibrating your Calibrators is Critically Important: Accuracy, Compliance and ISO 17025 and NIST Traceability
Instrument Range Calculator Results Explained
After entering all the required values, the calculator generates several engineering results that help verify whether the selected transmitter configuration is suitable for the application. Instead of displaying only mathematical calculations, each result provides useful information for design engineers, commissioning engineers, calibration technicians, and maintenance personnel.
Avoid One Of Instrumentation’s Most Common Engineering Mistakes: Top 15 Common Calibration Mistakes in Industrial Instruments
Calibrated Span
The calibrated span is the difference between the configured Upper Range Value and Lower Range Value.
Formula
Calibrated Span = URV − LRV
This value determines the operating range over which the transmitter converts the process variable into its output signal.
A span that closely matches the normal operating process generally provides better measurement resolution and improved control performance.
Sensor Range
The calculator also displays the total sensor range.
Formula
Sensor Range = URL − LRL
This value indicates the complete measuring capability of the sensor and serves as the reference for several validation checks performed by the calculator.
Process Range
Process range represents the expected operating window of the actual process.
Formula
Process Range = Process Maximum − Process Minimum
Comparing the process range with the calibrated span helps engineers determine whether sufficient operating margin has been provided.
Output Span
Output span represents the difference between the configured minimum and maximum output signals.
For a standard transmitter
Output Span = 20 mA − 4 mA
Output Span = 16 mA
Although most industrial transmitters use a 4 to 20 mA signal, the calculator also supports other analog output ranges.
Signal Per Unit
Signal per Unit indicates how much output signal changes for every engineering unit.
Formula
Signal per Unit = Output Span ÷ Calibrated Span
For example
Output Span = 16 mA
Calibrated Span = 160 psi
Signal per Unit
16 ÷ 160 = 0.1 mA per psi
This value is particularly useful during loop testing and manual calibration.
Rangeability
Rangeability describes the capability of a sensor to support different calibration ranges while maintaining acceptable performance.
Higher rangeability provides greater flexibility when configuring transmitters for different applications.
The calculator determines whether the selected calibration makes efficient use of the available sensor capability.
Turndown Ratio
Turndown ratio indicates how much the sensor range has been compressed into the configured calibration span.
Formula
Turndown Ratio = Sensor Range ÷ Calibrated Span
Example
Sensor Range
250 psi
Calibrated Span
125 psi
Turndown Ratio
250 ÷ 125 = 2 to 1
Lower turndown values generally provide better measurement performance.
Excessive turndown can reduce effective measurement accuracy and should be avoided whenever possible.
ADC Step Size
The calculator estimates the smallest measurable change based on the selected ADC resolution.
Higher resolution transmitters divide the calibrated span into a greater number of digital steps.
For example, a 16 bit transmitter provides significantly finer measurement resolution than an 8 bit transmitter.
This information helps engineers evaluate whether the selected transmitter is suitable for applications requiring precise measurement.
Accuracy Error
The entered accuracy percentage is converted into an actual engineering value.
For example
Accuracy
0.075 percent
Span
160 psi
Absolute Accuracy Error
160 × 0.075 ÷ 100
0.12 psi
Displaying the error in engineering units makes it much easier to understand the real measurement uncertainty.
Prevent Repeat Calibration Failures With These Proven Expert Tips: Calibration Guidelines
Hysteresis Error
Hysteresis error is calculated using the configured span and the entered hysteresis percentage.
Instead of viewing only a percentage value, engineers can immediately see the expected deviation in actual engineering units.
This becomes especially useful when calibrating high accuracy pressure and differential pressure transmitters.
Calibration Validation
The calculator performs several automatic validation checks before displaying the final results.
These include
- LRV is within the sensor limits
- URV is within the sensor limits
- Process minimum lies inside the calibrated span
- Process maximum lies inside the calibrated span
- Zero adjustment is within allowable limits
- Configured span satisfies the minimum span requirement
These checks help identify configuration errors before the transmitter is commissioned.
PASS WARNING and FAIL Status
One of the most useful features of the calculator is the overall status indicator.
PASS
Displayed when every validation check is satisfied and the transmitter configuration is technically acceptable.
WARNING
Displayed when the transmitter configuration is usable but one or more parameters should be reviewed, such as excessive turndown.
FAIL
Displayed when important engineering limits have been exceeded, such as configuring the LRV or URV outside the sensor limits or selecting a span below the manufacturer’s minimum requirement.
This immediate feedback helps engineers correct configuration errors before installation.
Follow Industry-Proven Practices To Achieve Reliable Measurement Accuracy: Different types of Calibrators and their Calibration Procedures
Instrument Range Calculation Example
Pressure Transmitter Example
A pressure transmitter has the following specifications.
Sensor Lower Range Limit
0 psi
Sensor Upper Range Limit
250 psi
Process Minimum
20 psi
Process Maximum
180 psi
Configured Lower Range Value
20 psi
Configured Upper Range Value
180 psi
Output Signal
4 to 20 mA
Engineering Results
The calculator produces the following results.
- Sensor Range = 250 psi
- Process Range = 160 psi
- Calibrated Span = 160 psi
- Output Span = 16 mA
- Signal per Unit = 0.1 mA per psi
- Turndown Ratio = 1.56 to 1
- Calibration Status = PASS
These results demonstrate the proper configuration of the transmitter and that the calibration choice fully covers the intended operating procedure with outstanding measurement performance.
Choose The Right Calibration Tool For Every Industrial Application: Different types of Calibrators and their Calibration Procedures
Instrument Range Visualization Explained
The calculator features a graphical range representation that offers a rapid understanding of the link between the sensor capabilities, the process operating range and the calibrated transmitter span. Engineers can see if the transmitter is setup appropriately instantly rather than having to look at a number of numerical figures.
The visualization contains four crucial elements:
Sensor Limits
The complete sensor range extends from the Lower Range Limit to the Upper Range Limit. This represents the maximum measuring capability of the transmitter.
Process Operating Range
The expected operating process is highlighted within the sensor limits. Ideally, the entire process range should remain inside the calibrated span while allowing a reasonable operating margin.
Configured Calibration Span
The configured Lower Range Value and Upper Range Value are shown separately from the sensor limits. This allows engineers to verify whether the transmitter has been calibrated correctly for the intended application.
Output Scaling Visualization
The displayed span also represents the section that is converted into the analog output signal. Every value between the configured LRV and URV corresponds proportionally to the selected output range.
During commissioning, this graphical representation helps engineers detect incorrect calibration settings much faster than reviewing numerical values alone.
Master Pressure Instrument Testing Using Proven Industrial Procedures: Calibration Procedures for Various Pressure Measuring Instruments
Signal Scaling Table Explained
The calculator automatically generates a signal scaling table after every calculation. This table is extremely useful during transmitter calibration, loop checking, PLC commissioning, and DCS verification.
The table contains
- Process value
- Percentage of calibrated span
- Expected output current
- Output percentage
- Status indication
For example, consider a transmitter calibrated from 20 psi to 180 psi.
| Process Value | Output Current |
| 20 psi | 4.00 mA |
| 60 psi | 8.00 mA |
| 100 psi | 12.00 mA |
| 140 psi | 16.00 mA |
| 180 psi | 20.00 mA |
Maintenance engineers often use this information when injecting simulated process values during calibration. PLC and DCS engineers also use these values to verify analog input scaling and confirm that displayed process values match the actual transmitter output.
Achieve Precise Absolute Pressure Measurements With Confidence Every Time: Step-by-Step Procedure to Calibrate an Absolute Pressure Transmitter
Instrument Range Selection Best Practices
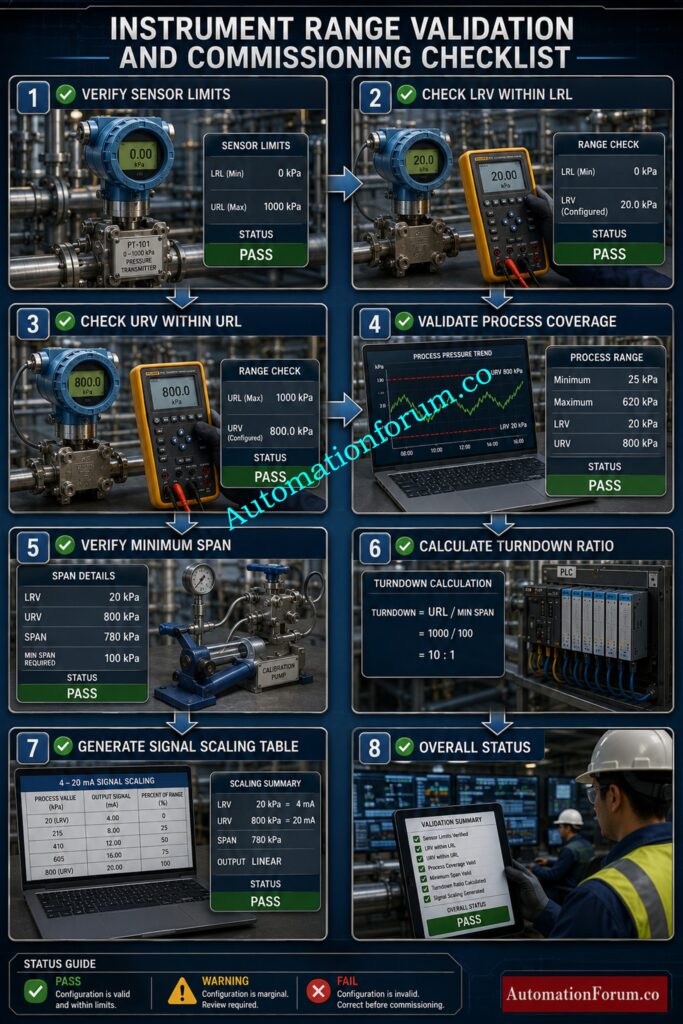
Choosing the correct transmitter range is much easier when a few practical engineering guidelines are followed.
- Select a sensor that comfortably covers the highest expected process value.
- Configure the calibration span around the normal operating range instead of the maximum equipment rating.
- Leave sufficient margin above the expected maximum process value for abnormal operating conditions.
- Verify that the configured span satisfies the manufacturer’s minimum span requirement.
- Confirm that both the process minimum and process maximum remain inside the calibrated span.
- Validate the expected output signal during commissioning before placing the loop into service.
- Review the calculated turndown ratio whenever a very narrow span is selected.
Following these practices improves measurement accuracy, simplifies future maintenance, and reduces commissioning time.
Discover Powerful Software That Simplifies Every Calibration Workflow: Best Calibration Management Software
Frequently Asked Questions on Instrument Range Calculator
What is the difference between LRL and LRV?
The Lower Range Limit is the minimum value the sensor can physically measure. The Lower Range Value is the configured process value that corresponds to the minimum transmitter output. The LRV must always remain within the sensor limits defined by the LRL and URL.
Why is span important?
Span is the percentage of sensor capability employed in measurement. A well-chosen span will give greater measurement resolution, better controller response and more accurate process monitoring.
How to calculate instrument range?
The instrument range is determined by the difference between the Upper Range Limit (URL) and the Lower Range Limit (LRL) of the sensor. Specifies the overall measurable capacity of the sensor as defined by the manufacturer.
What is the formula for calculating range?
Formula: Instrument Range = URL − LRL. For example, if a pressure transmitter has an LRL of 0 psi and a URL of 250 psi, its instrument range is 250 psi.
How to calculate URV and LRV?
The Lower Range Value (LRV) and Upper Range Value (URV) are chosen according to the real process operating limits. Ensure accurate measurement and appropriate operating margin by keeping the LRV slightly below the minimum process value and the URV slightly above the maximum process value.
What is a good turndown ratio?
Most industrial applications perform well with relatively low turndown ratios because they make better use of the available sensor range. Extremely high turndown values may reduce effective measurement performance and should always be reviewed against the transmitter manufacturer’s specifications.
Why does the calculator perform validation checks?
Validation checks guarantee the set LRV, URV, process limitations and span are within acceptable engineering bounds. Finding these problems prior to start-up helps prevent wrong transmitter settings and unnecessary troubleshooting.
Can this calculator be used for different transmitter types?
Yes. The calculator can be used for pressure, differential pressure, level, flow and temperature transmitters and other analog measuring devices that require adjustable measurement ranges and output scaling.
Stop Confusing These Critical Quality Processes In Industrial Plants: Differences Between Validation and Calibration
Conclusion: Selecting the Right Instrument Range for Reliable Process Measurement
The correct transmitter setup begins with choosing the correct measurement range. High performance smart transmitters can’t get reliable results if the calibration span is not adapted to the real process circumstances.
The Instrument Range Calculator makes this easier by providing a single engineering tool that combines sensor limit verification, span computation, rangeability analysis, turndown evaluation, resolution estimation, calibration validation, signal scaling and graphical presentation. Engineers can increase measurement accuracy, decrease setup mistakes, provide reliable process control and save future maintenance by commissioning each critical parameter.
Whether you are setting up a pressure, differential pressure, level, flow or temperature transmitter, this calculator offers a quick and accurate technique of checking that the calibration chosen is technically correct and appropriate for industrial operation.
Refer the below link for the Free Instruments Calibration Procedures: 60+ Step-by-Step Methods for Pressure, Temperature, Flow & Level
