- Introduction to Transmitter Calibration Calculator
- Transmitter Calibration Calculator
- What Is a Transmitter Calibration Calculator?
- Why Transmitter Scaling and Calibration Are Important
- Transmitter Calibration Calculator Inputs
- Transmitter Calibration Calculator Outputs
- Formulas Used in Transmitter Calibration Calculation
- Worked Examples of Transmitter Calibration Calculation
- Industrial Applications of Transmitter Calibration Calculator
- Design Considerations for Transmitter Calibration
- Engineering Best Practices for Accurate Calibration
- Common Transmitter Calibration Mistakes
- Troubleshooting Transmitter Calibration Errors
- Commissioning Guide for Transmitter Calibration
- Maintenance Guide for Transmitter Calibration
- Calibration Considerations Before Testing
- Frequently Asked Questions About Transmitter Calibration Calculator
- What is LRV in transmitter calibration?
- How do you calculate span from 4 to 20 mA?
- What does 20 mA mean in a transmitter?
- How do you find URV from a signal?
- Why is 4 mA not always zero process value?
- How is transmitter span used in calibration?
- What is the relationship between PV and mA?
- How do I troubleshoot transmitter scaling errors?
- Why Every Instrumentation Engineer Should Use a Transmitter Calibration Calculator
Introduction to Transmitter Calibration Calculator
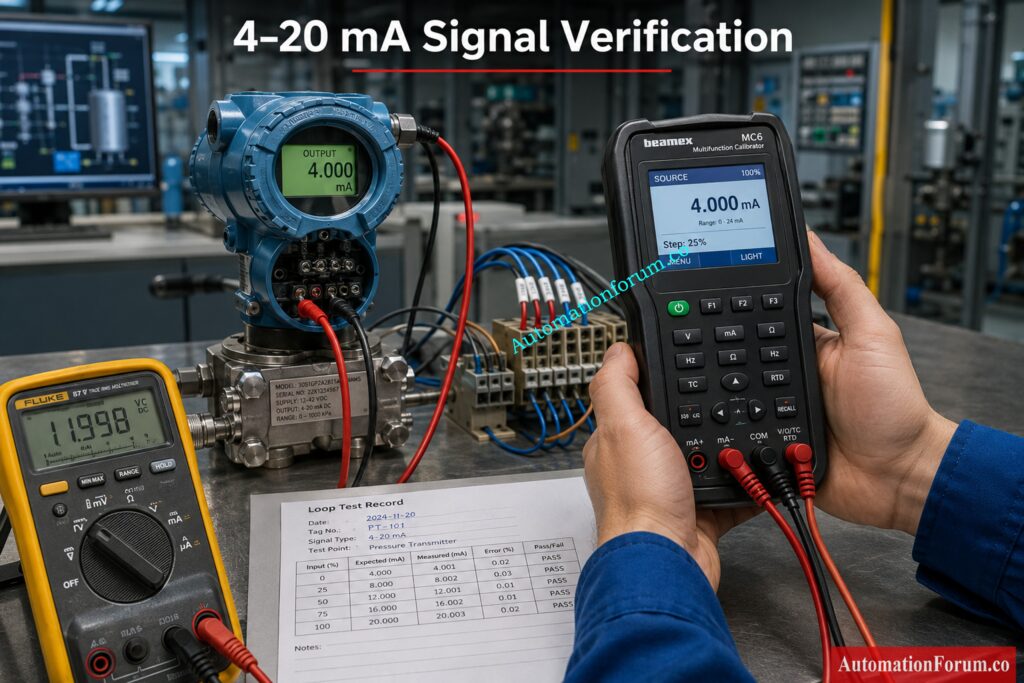
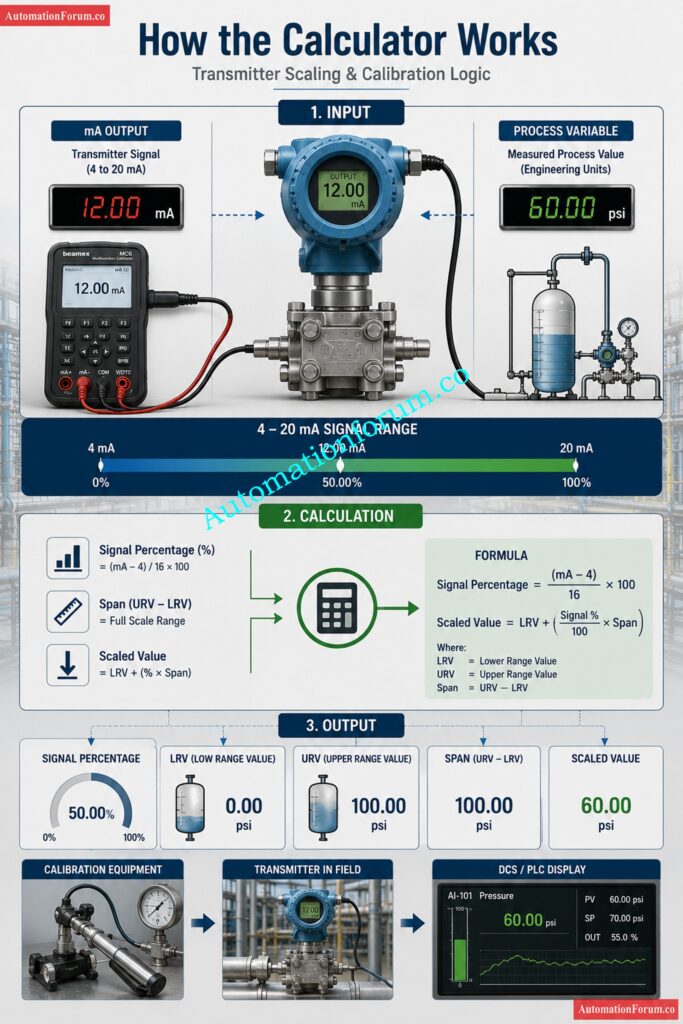
A transmitter in an industrial plant is only as useful as the scaling behind it. In a 4 to 20 mA loop, the current signal must correctly represent the process variable so the control system, operator display, alarms, and interlocks all behave as intended. That is why transmitter calibration remains a core skill for instrumentation engineers, control engineers, and commissioning teams. The calculator behind this topic helps engineers reverse interpret a current signal and a known process value to understand signal percentage, span, LRV, and URV in a practical field situation.
This is not just a classroom formula. It is the kind of logic used during loop checks, transmitter configuration review, field troubleshooting, and DCS or PLC scaling verification. The basic principle is simple. Four mA represents zero percent of the active range, twenty mA represents one hundred percent of the active range, and the sixteen mA between them represents the usable measurement span. The calculator uses that relationship to help engineers interpret transmitter output in real engineering units.
Transmitter Calibration Calculator
Transmitter Calibration — Span, LRV & URV Calculator
Enter values manually or click any sample row to auto-load it into the calculator
| # | Type | mA | PV | Signal % | LRV | URV | Span | Unit |
|---|
Master dry calibration fast with this proven calculator: Displacer Level Transmitter Calibration Calculator for Dry Calibration Step by Step Guide
What Is a Transmitter Calibration Calculator?
How the calculator interprets the signal
This calculator works as a reverse calculation tool for transmitter scaling. It takes a measured current value in the 4 to 20 mA range and a corresponding process variable value, then uses that information to determine the percentage of signal, the inferred span, and the estimated LRV and URV. This makes it especially useful when the engineer already knows the current output and the measured process condition but wants to understand the scaling behind it.
In real plant work, that situation happens often. A technician may measure 12 mA at a pressure transmitter and know the process is around 5 bar. A commissioning engineer may see a flow transmitter at 16 mA and want to confirm the range configuration. A maintenance engineer may be checking whether a level transmitter display matches the field signal. The calculator turns that practical field observation into usable calibration information.
Why reverse logic matters in transmitter calibration
Normally, transmitter scaling is explained from range to current. Here the calculator does the opposite. It starts with the signal and the process variable, then works backward to infer the measurement span. That is useful because field instruments do not always arrive in a neat configuration sheet. Sometimes the engineer sees the signal first and has to determine whether the transmitter is configured as expected.
One important limitation must always be remembered. At exactly 4 mA, the signal percentage becomes zero. Because the calculator depends on signal percentage in the span calculation, span, LRV, and URV cannot be derived from that one point alone using the displayed method. That is an important engineering detail and a good reminder that a single low end point cannot fully describe a range.
Crush challenging DP quiz questions with confidence today: Advanced DP Transmitter Calibration Quiz For Instrumentation Engineers And Technicians
Why Transmitter Scaling and Calibration Are Important
Impact on control stability, alarms, and operator trust
Correct scaling is not a minor configuration detail. It affects control stability, alarm logic, trend accuracy, and operator trust. If a transmitter is scaled incorrectly, a process may look normal while actually drifting outside safe limits, or it may appear to be in alarm when the process is healthy. In a plant environment, that can lead to poor decisions, unnecessary shutdowns, or unsafe operation.
Why LRV, URV, and span must be correct
Span, LRV, and URV also define how the control system interprets the process. If the URV is too low, the signal saturates too early. If the LRV is wrong, the whole range shifts and every displayed value becomes misleading. For a control loop, that means the PID controller receives the wrong process feedback. For an alarm system, it means the threshold may no longer represent the actual process condition. This is why calibration and scaling must always be checked together.
Ace level transmitter interview questions before the competition: Level Transmitter Calibration Quiz for Instrumentation Technicians and Engineers Interview
Transmitter Calibration Calculator Inputs
mA output
The first input is the current signal, which should be within the standard 4 to 20 mA loop range. Four mA is the live zero point and twenty mA is the live full scale point. The calculator is built around that standard analog signal relationship, so the engineer can use it for transmitter analysis, calibration review, and loop validation.
Process variable
The second input is the process variable. This is the actual measured value in engineering units such as bar, degree Celsius, liters per hour, or millimeters. In one loop, the PV may represent pressure. In another, it may represent temperature. In another, it may represent level or flow. The calculator does not change the signal math when the engineering unit changes, which is exactly how industrial instrumentation works in practice.
Practical examples of PV
For a pressure transmitter, PV may be 0 bar, 2.5 bar, 5 bar, or 10 bar. For a temperature transmitter, PV may be 25 degree Celsius, 75 degree Celsius, or 125 degree Celsius. For a flow transmitter, PV may be expressed in liters per hour or another flow unit. For a level transmitter, PV may be shown in millimeters. The sample table in the calculator demonstrates these different applications clearly.
Decode pressure transmitter workbench wiring with HART clarity: Wiring Diagram for Pressure Transmitter Calibration in Workbench using HART
Transmitter Calibration Calculator Outputs

Signal percentage
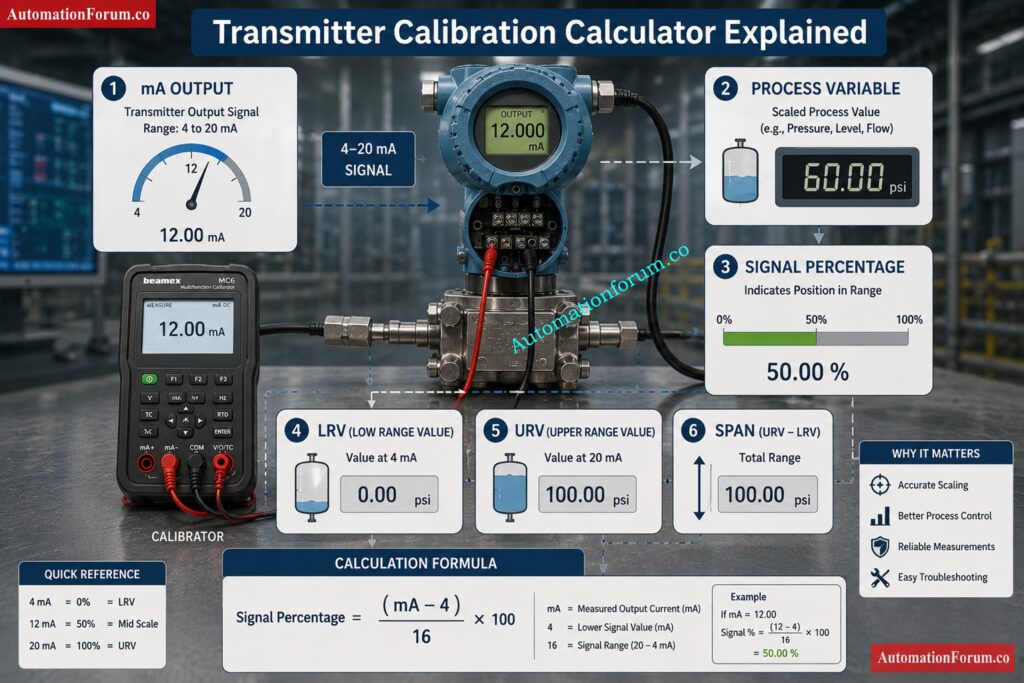
Signal percentage tells the engineer how far along the active current range the transmitter is operating. This is useful because it converts mA into a simple proportional view of the measurement. A signal at 50 percent means the transmitter is exactly halfway through its usable span. That is often the fastest way to understand whether the field signal is behaving correctly.
LRV (Lower Range Value)
LRV means lower range value. It is the bottom of the configured measurement range. In transmitter calibration, it represents the engineering value associated with the low end of the signal. When the transmitter is set up properly, LRV must align with the process design and the instrument installation condition.
URV (Upper Range Value)
URV means upper range value. It is the top of the configured measurement range. In simple terms, it is the value the transmitter should represent at full scale. If the URV is wrong, the control room display may still look active but the measurement meaning will be incorrect.
Span
Span is the difference between URV and LRV. It is the full width of the measurement window. For engineers, span is one of the most important calibration values because it defines the working range of the transmitter. The calculator shows span directly so the user can quickly verify whether the range makes sense for the application.
Calculate DP level and density ranges instantly online: Excel tool for DP type level and density transmitter calibration range calculation
Formulas Used in Transmitter Calibration Calculation
Signal Percentage Formula
The first formula is used to convert current to signal percentage.
Signal percentage = (mA minus 4) divided by 16 times 100
This works because the active signal range is 16 mA wide. The live zero at 4 mA gives 0 percent, the midpoint at 12 mA gives 50 percent, and the full scale at 20 mA gives 100 percent. That proportional behavior is what makes 4 to 20 mA so useful in industrial control systems.
Improve instrument accuracy calculations with one quick check: Instrument Accuracy Calculator
Span Formula
The second formula is used to estimate span.
Span = PV divided by signal percentage divided by 100
Once the signal percentage is known, the process value can be used to infer the full range width. This is the reverse calculation logic used by the calculator. It is useful for checking how a transmitter output relates to the engineering scale behind it.
LRV Formula
The third formula is used to estimate LRV.
LRV = PV minus signal percentage divided by 100 multiplied by span
This identifies the lower end of the range based on the known PV and signal position. It helps the engineer understand where the measurement window begins.
URV Formula
The fourth formula is used to estimate URV.
URV = LRV plus span
This gives the upper end of the measurement range. Together with LRV and span, it completes the range picture for the transmitter.
Get flawless pH calibration using trusted standard solutions: pH transmitter calibration with standard solutions
Worked Examples of Transmitter Calibration Calculation
Pressure Transmitter Example
| Item | Value |
| mA output | 12 mA |
| PV | 5 bar |
| Signal percentage | 50 percent |
| Span | 10 bar |
| LRV | 0 bar |
| URV | 10 bar |
At 12 mA, the signal is halfway between 4 mA and 20 mA. That means the transmitter is at 50 percent of range. If the process variable is 5 bar, then the full span must be 10 bar. The calculated LRV is 0 bar and the URV is 10 bar, which matches a very common pressure transmitter range. This is exactly the type of practical check that engineers use during commissioning and calibration review.
Level Transmitter Example
| Item | Value |
| mA output | 16 mA |
| PV | 500 mm |
| Signal percentage | 75 percent |
| Span | 666.67 mm |
| LRV | 0 mm |
| URV | 666.67 mm |
At 16 mA, the signal is at 75 percent of the active range. If that corresponds to 500 mm, the inferred span is 666.67 mm. That tells the engineer the transmitter is not simply using a rounded 1000 mm scale. It may reflect actual installation geometry, zero elevation, or process design details.
Follow a sharp conductivity calibration process without mistakes: Conductivity Transmitter Calibration Procedure
Industrial Applications of Transmitter Calibration Calculator
This transmitter calibration calculator is widely used across process industries to verify transmitter scaling, perform calibration checks, and validate measurement ranges.
- Applications of Pressure, Flow and Level Transmitters for Oil and Gas Plants
- Boiler Pressure, Steam Flow, Drum Level and Temperature Measurement Power Plants
- Reactor, vessel and utility measurements in chemical and petrochemical plants
- Monitoring tank levels and flows in water and wastewater treatment plants
- Pharmaceutical and food processing sectors for crucial process control applications
- Manufacturing plants: production systems and process monitoring
- Loop testing, commissioning and verification of start-up tasks
- DCS and PLC Analog Input Scaling Verification
Learn HART transmitter calibration like a seasoned expert: HART transmitter calibration procedure – For pressure transmitter
Design Considerations for Transmitter Calibration
Selecting the right range and scale is critical to get good measurements and to keep process control steady.
- Check if the process measurement has a linear relationship
- Take into account zero suppression and elevation requirements
- Select a range based on transmitter turndown capabilities
- Consistent use of engineering units throughout the system
- Account for implications of installation location and reference elevation
- Choose a range that includes average and maximum operating conditions
- Use appropriate limitations in the transmitter are confirmed
Unlock smarter weight-based displacer calibration for liquid service: Displacer Level Transmitter Calibration Using Weight for Single Liquid Applications
Engineering Best Practices for Accurate Calibration
Good engineering practice helps to increase the precision of measurement and the reliability of the system.
- Check transmitter range parameters against approved datasheets
- Cross check configuration and loop drawings, and control narratives
- Check output signals with a calibrator or loop simulator
- Verify that DCS or PLC scaling matches the transmitter configuration.
- Alarm, trip and interlock points setting.
- Low, mid, and high point verification checks
- Maintain appropriate calibration records and documentation
- Review scaling any time a transmitter is replaced or adjusted
Refer the below link for Step-by-Step Pressure Transmitter Calibration Guide (NIST & IEC 61508 Aligned)
Common Transmitter Calibration Mistakes
But a lot of the trouble with transmitters is caused not by instrument failures, but by setup and scaling issues.
- Confusing LRV and URV values when setting up
- 4 mA equals 0 technical units (usually assumed
- Ignore zero suppression or zero elevation effects
- Incorrect engineering unit conversions
- Incorrect span used during calibration or commissioning
- Improper setting of DCS or PLC scale parameters
- No calibration check at several test points
- No update of alarm limits when range changes
Solve interface level dry calibration with confidence: Displacer type interface level transmitter dry calibration weight calculator
Troubleshooting Transmitter Calibration Errors
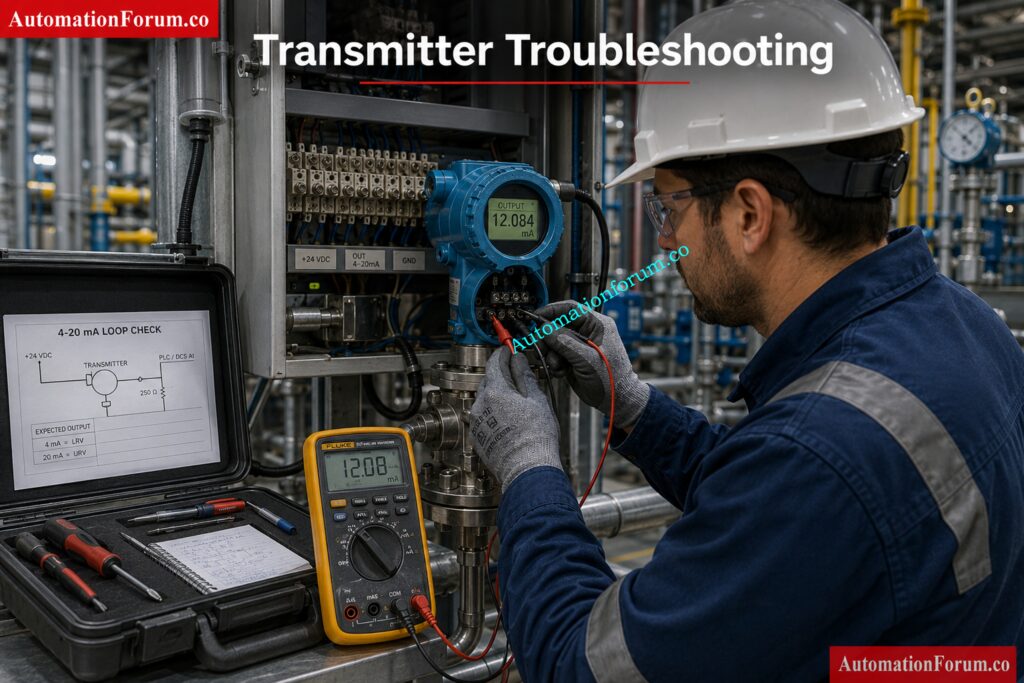
If measurement problems develop, examine the following prior to replacing the transmitter.
- Check transmitter range settings and loop current
- Check DCS or PLC analog input scaling
- Check wiring, connections and power supply conditions
- Check engineering units are consistent throughout the control system
- Review installation reference points and zero elevation
- Check electrical noise concerns with grounding/shielding
- Verify calibration status and transmitter health
- Investigate process conditions that may affect measurement stability
Measure field DP level calibration errors before they spread: Calibration of DP level transmitter at field
Commissioning Guide for Transmitter Calibration
During plant startup, the engineers should check the transmitter performance and scalability of the control system.
- Verify LRV and URV values in the configuration match design docs
- Check voltage, polarity and wire continuity of power supply.
- Simulate 4 mA , 12 mA and 20 mA signals
- Check accuracy of field indication and control room display
- PLC or DCS scaling calculation check
- Test alarm and trip operation at setpoints as set up
- Results of calibration and test loop
- Get final commissioning permission prior to handover
Maintenance Guide for Transmitter Calibration
Routine maintenance is necessary to preserve measurement accuracy and prevent unexpected failures.
- Periodic verification of calibration
- Check field wiring, junction boxes and terminals
- Loop current accuracy and transmitter diagnostic check
- Check for corrosion, moisture penetration or damaged components
- Ensure no changes are made to DCS and PLC scaling
- Look for trends in instrument performance for drift
- Recalibrate Transmitters in accordance with plant procedures
- Keep complete calibration and maintenance records
Verify instrument performance with zero guesswork now: Instrument Calibration Verification Calculator
Calibration Considerations Before Testing
Several aspects should be considered before transmitter calibration.
- Check zero and span adjustment requirements
- Check sensor trim and output trim settings
- Think about real process operation circumstances
- Review how often calibration is required
- Level applications: Wet and dry leg effects accounted for
- Refer to the installation conditions
- Consider environmental factors and ambient temperature
- Ensure the appropriate measurement accuracy can be obtained
- Follow plant calibration processes and quality requirements.
- Testing to confirm that restrictions of transmitter operation are not exceeded
Find exact calibration test points in seconds: Online Calibration Test Points Value Calculator
Frequently Asked Questions About Transmitter Calibration Calculator
What is LRV in transmitter calibration?
LRV is an abbreviation for Lower Range Value. This is the lowest process value that has been configured in the transmitter range.
It is at the lower end of the measurement scale in the calibration.
This value is the transmitter output start point for measuring the process.
How do you calculate span from 4 to 20 mA?
First, convert the transmitter current to a signal percent using the 4 to 20 mA relationship.
Then calculate the measurement span using the signal % and the process variable.
The calculated span represents the total operating range of the transmitter.
What does 20 mA mean in a transmitter?
A 20 mA signal represents 100 percent of the transmitter’s configured measurement range.
It indicates that the process variable has reached the upper end of the calibrated span.
In most applications, it corresponds directly to the URV setting.
How do you find URV from a signal?
The URV is calculated after determining the span and LRV values.
Once the span is known, it is added to the LRV to obtain the URV.
URV defines the highest process value the transmitter can measure within its configured range.
Why is 4 mA not always zero process value?
A 4 mA signal represents the lower range value, not necessarily zero engineering units.
Many applications use zero suppression or zero elevation, causing the low point to be above or below zero.
Therefore, the process value at 4 mA depends on the configured transmitter range.
How is transmitter span used in calibration?
Span is the difference between the upper range value and the lower range value.
It determines the entire measuring range that the transmitter has to cover.
Span changes during calibration assure the accuracy of the scaling across the full operating range.
What is the relationship between PV and mA?
The process variable is transformed to a proportional current signal by the transmitter.
As the PV increases the output current climbs linearly from 4 mA to 20 mA.
This link provides control systems the capability to efficiently observe and control industrial process
How do I troubleshoot transmitter scaling errors?
Start with checking the transmitter settings, loop current and engineering units.
Verify that the PLC or DCS scaling parameters are set to match the transmitter LRV and URV.
Also inspect wiring, calibration status, and alarm configurations to identify any mismatch.
Click here for 200+ Online Instrumentation Calculators Collections
Why Every Instrumentation Engineer Should Use a Transmitter Calibration Calculator
The value of this transmitter calibration calculator is that it helps engineers translate a live 4 to 20 mA signal into practical calibration meaning. By linking signal percentage, span, LRV, and URV, it supports better field decisions during design, commissioning, troubleshooting, and maintenance. For instrumentation professionals, that means faster diagnosis, fewer scaling mistakes, and better confidence in the process measurement. AutomationForum.co presents this as a useful engineering tool because it reflects how transmitter work is actually done in the field.
Refer the below link to DP Flow Transmitter Re-Ranging Calculator