
- What Is Pressure Transmitter Overrange Protection?
- Pressure Transmitter Overrange Protection Calculator Parameters
- How to Calculate Pressure Transmitter Pressure Surge
- How to Use the Pressure Transmitter Overrange Calculator
- How to Interpret Pressure Transmitter Overrange Calculator Results
- Pressure Transmitter Overrange Calculation Example
- Common Causes of Pressure Transmitter Overrange and Overpressure
- How to Prevent Pressure Transmitter Overpressure Damage
- Pressure Transmitter Overrange Calculator Limitations
- Frequently Asked Questions About Pressure Transmitter Overrange
Pressure Transmitter Overrange Protection Calculator
Pressure Surge System Schematic
1. Transmitter Specifications
2. Process and Surge Dynamics
Quick Load Scenarios
Pressure Transmitter Safety Analysis
Pressure Limit Assessment
Step by Step Engineering Calculation
| Parameter | Calculated Value |
|---|
Governing Equations
Engineering Interpretation
Pressure transmitters used in process industries might be subject to pressure spikes caused by pump start-ups, valves closed too fast, water hammer and sudden flow disruptions. Such pressure excursions may be outside the specified measurement range and in severe circumstances may destroy the sensor element or impair the process connection.
Pressure Transmitters Overrange Protection Calculator – AutomationForum.co allows instrumentation engineers to estimate the pressure surges of liquids and to compare the calculated peak pressure with the upper range limit of the transmitter, proof pressure and burst pressure. It is useful for preliminary engineering assessments during design, commissioning, troubleshooting and transmitter selection.
What Is Pressure Transmitter Overrange Protection?
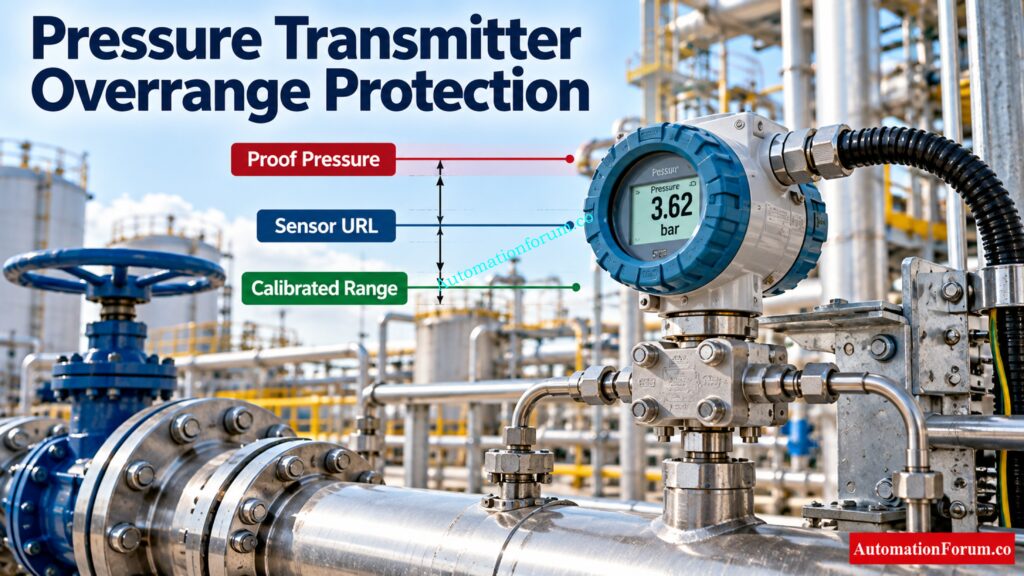
Pressure transmitter overrange happens when the pressure applied exceeds the calibrated range or upper limit of measurement. Overpressure is pressure above the prescribed operational or mechanical limits of the instrument.
Use a transmitter calibrated 0 to 60 bar with a sensor upper range limit of 100 bar. A transient pressure of 75 bar is above the calibrated range but below the URL of the sensor. Whether or whether the transmitter is able to survive this condition without damage depends on the specs.
Excessive pressure can cause measurement errors, permanent zero shift, sensor damage, leakage or mechanical failure. The actual consequences depend on the transmitter design and manufacturer ratings.
Solve Difficult Interface Level Measurement Problems With Remote Seals: Interface level measurement using DP transmitter (Remote sealed)
Pressure Transmitter Overrange Protection Calculator Parameters
Enter the following values using the transmitter datasheet, process design documents and reliable operating data.
| Parameter | Engineering significance |
| Upper Range Limit | Maximum specified sensor measuring limit |
| Calibrated span upper value | Pressure corresponding to the configured 20 mA output |
| Proof pressure | Specified pressure limit for avoiding permanent performance damage under stated test conditions |
| Burst pressure | Pressure associated with loss of pressure containment |
| Operating pressure | Normal process pressure before the surge |
| Fluid density | Liquid density in kg/m³ |
| Pressure wave speed | Speed of the pressure wave in the liquid and pipe system, in m/s |
| Change in flow velocity | Expected velocity change in m/s |
| Pipe length | Relevant distance to the source or reflection boundary, in metres |
| Valve closure time | Time taken for the valve to close, in seconds |
The calibrated span upper value and URL are different parameters. A transmitter can have a sensor URL of 100 bar while its configured 20 mA value is 60 bar.
Always use manufacturer specified proof and burst pressure ratings. Do not assume that every transmitter has the same pressure limits.
Refer the below link for the Instrument Range Calculator | Calculate Span, Rangeability, Turndown Ratio & Calibration Range
How to Calculate Pressure Transmitter Pressure Surge
The calculator uses the Joukowsky equation to estimate the pressure rise caused by a rapid change in liquid velocity.
How to Calculate the Critical Period in a Pipeline
Tcrit = 2L / c
Here, L is the relevant pipe length and c is the pressure wave speed.
Joukowsky Equation for Instantaneous Pressure Surge
ΔP = ρ × c × Δv
Convert the pressure rise into bar:
ΔP in bar = (ρ × c × Δv) / 100000
How to Calculate the Valve Closure Adjustment Factor
Factor = min(1, Tcrit / tc)
For instantaneous closure, when tc equals zero, the calculator uses a factor of 1.
Discover What Really Causes Pressure Measurement Accuracy Problems: Factors that Influence the Accuracy of your Pressure Transmitter
How to Calculate Surge Pressure and Peak Pressure
ΔP surge = Instantaneous surge estimate × Closure adjustment factor
Ppeak = Operating pressure + Surge pressure rise
The closure adjustment is a simplified screening approximation. Real pressure surges depend on the entire hydraulic system and cannot always be represented accurately by this factor.
Unlock Essential Instrument Calibration Tools for Faster Engineering Work: Calibration Calculators
How to Use the Pressure Transmitter Overrange Calculator
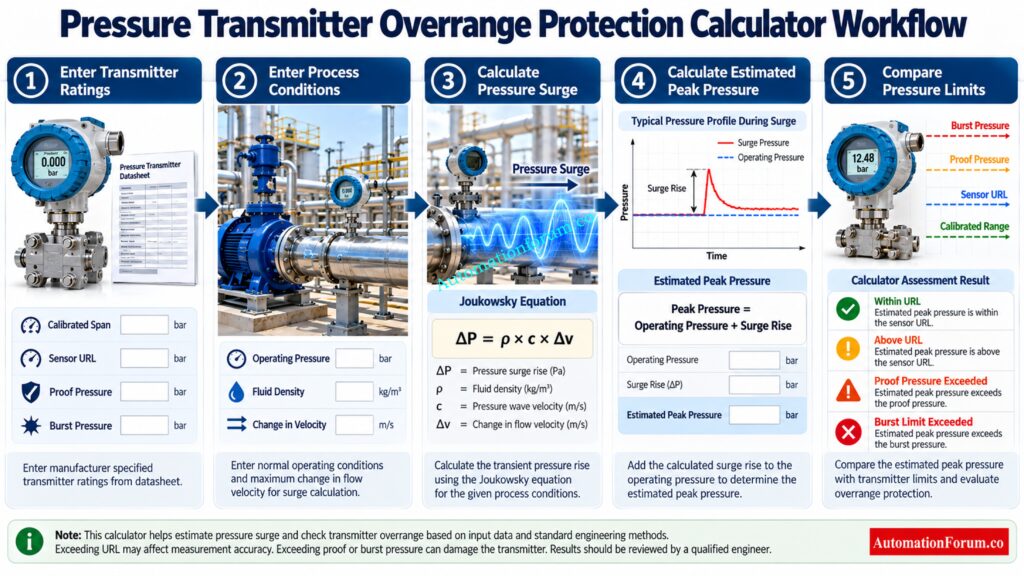
- Enter the transmitter URL and calibrated span upper value.
- Enter the manufacturer specified proof pressure and burst pressure.
- Enter the normal operating pressure.
- Specify fluid density and pressure wave speed.
- Enter the expected change in flow velocity.
- Enter the relevant pipe length and valve closure time.
- Select Calculate Surge Risk.
- Review the estimated peak pressure, surge rise, critical period and pressure margins.
- Download the report for engineering review and documentation.
The built in water line, fast closure and slow closure scenarios help demonstrate how changes in flow velocity and valve closure time affect the estimated pressure surge.
Fix Unexpected 22 mA Signals Before They Disrupt Operations: Why Is My Pressure Transmitter Showing 22 mA? Complete Troubleshooting Guide for Instrument Engineers
How to Interpret Pressure Transmitter Overrange Calculator Results

- Estimated peak pressure: The calculated operating pressure plus the estimated surge rise.
- Surge pressure rise: The additional pressure predicted from velocity change and closure correction.
- Critical period: Time based on pipe length and velocity of pressure wave.
- Proof pressure margin: Proof pressure margin = Proof pressure – Estimated peak pressure. If the result is negative, the predicted peak pressure is higher than the entered proof pressure.
- Burst pressure margin: Burst pressure minus estimated peak pressure. A negative value means the estimated peak exceeds the entered burst pressure.
Choose the Right Operating Range Before Selecting Your Transmitter: Rangeability vs. Turndown Ratio and their Implications for Pressure Transmitter Selection
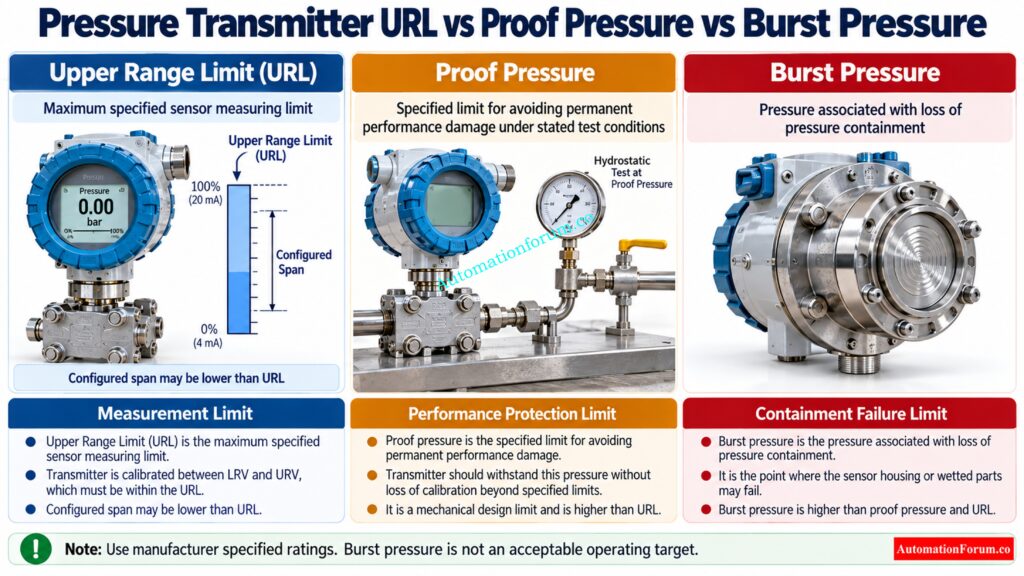
The calculator reports four assessment conditions:
| Assessment | Meaning |
| Within URL | Estimated peak is within the sensor URL |
| Above URL, within proof limit | Measurement range exceeded, but proof pressure remains higher |
| Proof pressure exceeded | Permanent performance shift or damage may occur |
| Burst limit exceeded | Estimated peak reaches or exceeds the entered burst limit |
Exceeding URL does not automatically mean physical damage has occurred. However, reliable measurement of the pressure peak cannot be assumed. Burst pressure is a containment failure limit, never an acceptable operating target.
Resolve Conflicting Pressure Readings Before Making Critical Decisions: Pressure Gauge vs Pressure Transmitter: When Readings Don’t Match, Who Should You Trust?
Pressure Transmitter Overrange Calculation Example
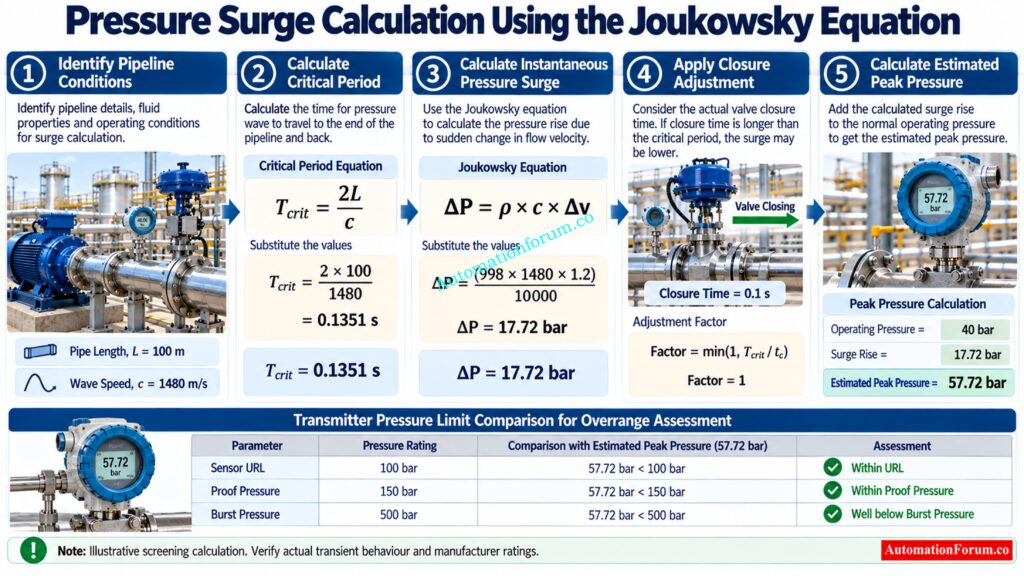
Consider a liquid pipeline with the following illustrative inputs.
| Parameter | Value |
| Transmitter URL | 100 bar |
| Calibrated span upper value | 60 bar |
| Proof pressure | 150 bar |
| Burst pressure | 500 bar |
| Operating pressure | 40 bar |
| Fluid density | 998 kg/m³ |
| Pressure wave speed | 1480 m/s |
| Change in velocity | 1.2 m/s |
| Pipe length | 100 m |
| Valve closure time | 0.1 seconds |
Step 1: Critical period
Tcrit = 2 × 100 / 1480 = 0.1351 seconds
Step 2: Instantaneous surge estimate
ΔP = (998 × 1480 × 1.2) / 100000 = 17.72 bar
Step 3: Closure adjustment factor
Factor = min(1, 0.1351 / 0.1) = 1
Step 4: Estimated surge rise
ΔP surge = 17.72 × 1 = 17.72 bar
Step 5: Estimated peak pressure
Ppeak = 40 + 17.72 = 57.72 bar
The estimated peak is below the 100 bar URL, 150 bar proof pressure and 500 bar burst pressure. The proof pressure margin is 92.28 bar, and the burst pressure margin is 442.28 bar.
This illustrative result indicates that the estimated peak remains within the entered limits. It does not establish overall installation safety or validate the actual plant transient.
Refer the below link for the Step-by-Step Procedure to Calibrate an Absolute Pressure Transmitter
Common Causes of Pressure Transmitter Overrange and Overpressure
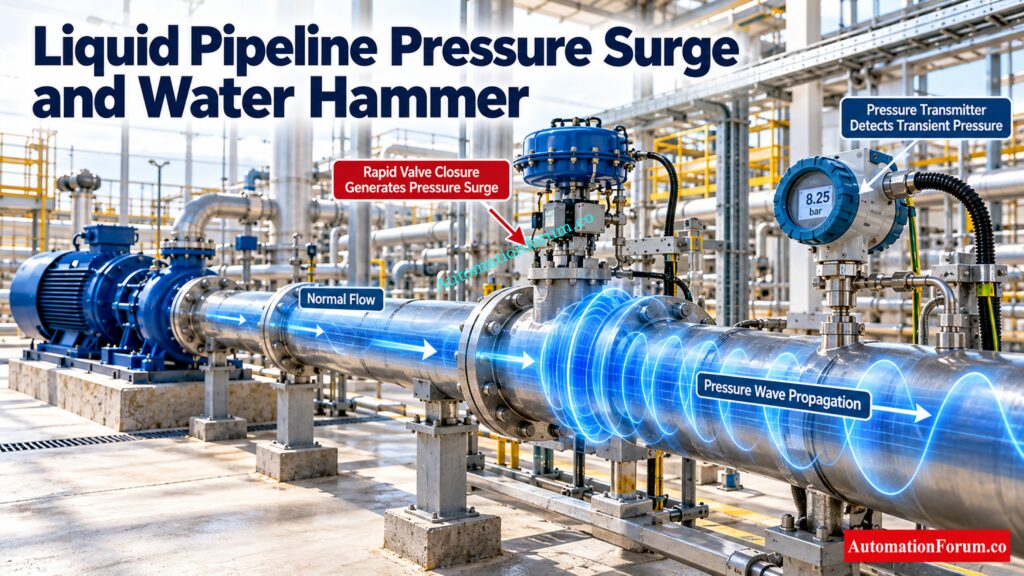
Rapid valve closure and water hammer can generate sudden pressure waves in liquid pipelines. Pump startup or shutdown, sudden flow interruption and pressure regulator malfunction can also cause pressure excursions.
Compressor pulsations, reciprocating equipment, blocked lines and trapped liquid thermal expansion may produce different transient behaviours. These instances may have to be analyzed in greater detail than the simplified liquid surge model of the calculator.
Master Boiler Drum Pressure Checks Before Commissioning Begins: Commissioning Procedure for Differential Pressure Transmitters in Pressurized Boiler Steam Drums
How to Prevent Pressure Transmitter Overpressure Damage
Choose transmitters with appropriate mechanical and measurement pressure ratings. Review valve closing characteristics, pump working sequences and trapped liquid expansion potential.
Where appropriate, assess surge suppression devices, pressure relief arrangements, snubbers, pulsation dampeners and diaphragm seals. These devices must be selected for the actual process conditions and pressure ratings.
For critical services, verify manufacturer overpressure recovery specifications and perform a suitable hydraulic transient study before accepting the design.
Eliminate Sensor Errors With Proper Trim Adjustment Techniques: Smart Pressure Transmitter Sensor Trim Guide with Diagrams & Calibration Steps
Pressure Transmitter Overrange Calculator Limitations
This calculator provides a preliminary engineering screening estimate, not a certified hydraulic transient simulation. It does not fully model pipe elasticity, fluid compressibility, valve characteristics, pipe supports, branches, pressure wave reflections or system boundary conditions.
Its simplified closure adjustment may not represent actual surge behaviour in every installation. Use a detailed transient analysis and manufacturer verification where pressure excursions could affect mechanical integrity, process containment or safety.
Prevent HART Calibration Wiring Mistakes Before Testing Starts: Wiring Diagram for Pressure Transmitter Calibration in Workbench using HART
Frequently Asked Questions About Pressure Transmitter Overrange
What is the difference between transmitter overrange and overpressure?
Overrange occurs when pressure exceeds the configured measurement range or sensor URL. Overpressure exceeds specified pressure limits and may cause measurement errors or physical damage.
What is the difference between URL, proof pressure and burst pressure?
URL defines the sensor measuring limit, while proof pressure is the specified limit for avoiding permanent performance damage. Burst pressure is associated with loss of pressure containment.
Follow Reliable DP Calibration Steps and Eliminate Measurement Errors: Differential Pressure Transmitter Calibration: Step by Step Procedure
Can a pressure transmitter be damaged even if pressure returns to normal?
Yes, Too much pressure can cause permanent zero shift, faulty measurements or mechanical damage. Normal back pressure does not ensure transmitter accuracy.
How does valve closure time affect pressure surge?
A rapid valve closure can cause a large pressure surge because the velocity of the liquid changes abruptly. In dependence on the piping system and the transitory conditions, the surge can be reduced by slower closure.
Prevent Boiler Drum Level Errors With Accurate Differential Pressure Measurement: Understanding Boiler Drum Level Transmitters: Accurate DP Measurement Explained
When is a detailed hydraulic transient analysis required?
For strong pressure transients, complicated piping systems and safety essential applications a full analysis is recommended. It helps evaluate wave reflections, pipe elasticity, valve characteristics and system boundary conditions.
What is the pressure range of a pressure transmitter?
The pressure range is the minimum and maximum pressure a transmitter is configured to measure accurately. The available range depends on the sensor URL, calibrated span and transmitter specifications.
Catch Critical Transmitter Defects Before Factory Acceptance Approval: Factory Acceptance Test(FAT) Procedure for Differential Pressure(DP) Transmitter
How to calculate pressure transmitter accuracy?
Transmitter accuracy is usually determined by the stipulated accuracy % and its appropriate reference such as calibrated span or reading. See manufacturer’s datasheet for accuracy specification and calculation basis.
What is the purpose of a snubber in a pressure gauge?
A pressure snubber diminishes the influence of abrupt pressure changes and pulsations on the pressure sensing device. Good choice increases reading steadiness, which may save mechanical wear.
Understand How Multivariable Transmitters Improve Mass Flow Measurement: Understanding the Working Principle of Multivariable DP Mass Flow Transmitters
What is the name for the safety device that protects against overpressure?
A pressure relief valve is commonly used to protect process equipment against excessive pressure by releasing fluid when its set pressure is reached. The appropriate protection device depends on the application, system design and applicable requirements.
What is the difference between rangeability and turndown ratio?
Rangeability is the ratio of the maximum to minimum controllable flow, commonly used for control valves. Turndown ratio describes the usable operating range of an instrument or control device relative to its maximum specified range.
See How Field Signals Reach PLCs Without Data Loss: How a PLC reads the data from field transmitters?
How to calculate pressure transmitter range?
Calculate the span by subtracting the lower range value from the upper range value: Span = URV − LRV. For example, a transmitter configured from 0 to 100 bar has a span of 100 bar.
Refer the below link for the Transmitter Calibration Calculator: How to Calculate Span, LRV, URV, and 4 to 20 mA
