Home Blog Page 229

Step-by-Step Pressure Transmitter Calibration Guide (NIST & IEC 61508 Aligned)

0

A pressure transmitter, also known as a pressure transducer or sensor, is a specialized instrument designed to gauge applied pressure. Its primary function involves the conversion of mechanical or hydraulic pressure into an electrical signal. This electrical output serves various purposes, such as displaying the pressure measurement on a screen or transmitting the signal to a controller, PLC, or data acquisition system for additional analysis and processing.

Pressure transmitters are essential in the process industry for monitoring and controlling the pressure of liquids, fluids, and gasses. Also known as pressure transducers, these devices go beyond just measuring pressure, contributing to safety, process optimization, and ensuring the quality of industrial processes.

This below Step by Step Pressure Transmitter calibration procedure provides a thorough explanation of how to calibrate a Pressure Transmitter using pressure calibrator.

Prepare the Tools Required for Pressure Transmitter calibration
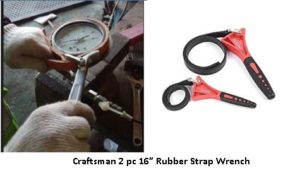
  • Necessary hand tools.
  • 24 V power supply source.
  • Standard Pressure Calibrator.
  • Standard Multimeter.
  • Test leads and probes.
  • Tubes and standard fittings 
  • Soft Cloth for cleaning.
  • For smart transmitters, a crucial communication tool is the Hart communicator

Always use a reference pressure calibrator with at least four times better accuracy than the transmitter.
For example, if the transmitter has an accuracy of ±0.1% of span, the reference standard must be ±0.025% or better.
This follows global metrology and traceability standards.

  1. For detailed safety guidelines, general recommendations, and calibration procedures in process industries, refer to the provided link:

  1. Request the panel operator to switch the Pressure Transmitter controller to manual mode for the control loop and MOS for the ESD loop.
  2. Identify the specific Pressure Transmitter to be turned off, recording key information like Tag number, manufacturer, model number, and pressure range.
  3. Before removing the Pressure Transmitter, be sure there is no pressure or fluid running through the instrument by stopping the operation.
  4. Close or disconnect the pipe connecting the Pressure Transmitter to the process to isolate it from fluid flow.
  5. Release any trapped pressure within the transmitter by opening bleed or vent valves.
  6. Disconnect the power supply from the Pressure Transmitter and turn off nearby junction boxes or marshalling panels.
  7. Plug the lines to prevent fluid seepage post-calibration.
  8. Safely store the Pressure Transmitter connections in a secure location.
  9. After removing tubing connections, label the Pressure Transmitter connections with relevant information (date, reason for removal) for proper storage.
  10. Adhere to the manufacturer’s instructions and safety precautions during the removal process, and consult with a skilled technician or engineer if needed.
  11. Follow lockout/tagout procedures to prevent unintended starts and ensure the Pressure Transmitter is isolated from the process.
Prepare the Setup for Pressure Transmitter calibration
  1. Ensure that the calibration equipment for the Pressure Transmitter is positioned in a location free from vibrations and electromagnetic interference. The designated area should be well-ventilated and well-lit.
  2. The requirements for the calibration area of the Pressure Transmitter are as follows: it needs to be level, solid, and clean.
  3. Verify the Mounting of the Pressure Transmitter securely  on the field..
  4. Connect one end of the tube to the pressure inlet port of the Pressure Transmitter, and attach the other end to the output of the pressure calibrator. Verify the connections for tightness and leak-free operation.
  5. Establish a series connection between the Pressure Transmitter, the 24-volt power supply from the junction box, and a digital multimeter capable of measuring milliampere current.
  6. Integrate the Hart communicator with the terminal of the Pressure Transmitter(for only smart type transmitter).
  7. Place the Pressure Transmitter calibration setup in an environment free from vibrations and electromagnetic interference, ensuring proper ventilation and lighting.
  8. As indicated in the above figure, establish a suitable and accurate calibration setup for the Pressure Transmitter by following these step-by-step instructions.
  9. Ensure that the environmental conditions during calibration, such as temperature and humidity, are within the specified operating range of both the pressure transmitter and the calibration equipment.

Before you start calibrating, put pressure on the transmitter for one to two minutes that is close to 80–90% of its upper range value. This helps get rid of hysteresis, stabilize the sensing diaphragm, and bring the transmitter to thermal equilibrium. Not doing this step often leads to difficulties with drift, non-linearity, and repeatability.

  1. Ensure that the input tubing connections and output wire connections on the Pressure Transmitter are securely in place.
  2. Set the power supply unit to 24 VDC to activate the Pressure Transmitter. Before powering the circuit, use a multimeter to confirm the voltage level in the power supply output.
  3. Turn on the pressure calibrator.
  4. Refer to the instrument datasheet for the Pressure Transmitter and ensure that the pressure calibrator’s menu is configured to the correct unit.
  5. Allow sufficient time for the pressure transmitter and calibration equipment to stabilize at the calibration environment before initiating the calibration process
  6. Record and document the initial conditions, including ambient temperature, pressure, and any other relevant parameters, as they may affect the calibration.
  7. Record the mA output before any adjustments
  8. Document all initial values in the report template
  9. Apply known pressure values (0%, 25%, 50%, 75%, 100%)
  1. Set the transmitter’s 0% Lower Range Value (LRV) to match the LRV of the calibration range.
  2. Adjust the upper range value (URV) of the calibration range to 100% for the Pressure Transmitter’s span.
  3. Refer to the instruction manual to locate the ZERO and SPAN/RANGE adjustments in the display menu for the Pressure Transmitter.
  4. Apply the LRV 0% to the pressure port of the Pressure Transmitter using the pressure calibrator.
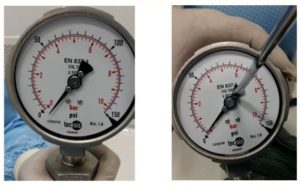
  5. While observing the 4mA reading on the multimeter, adjust the ZERO adjustment menu in the display or the zero adjustment potentiometer of the transmitter. This sets the Pressure Transmitter’s LRV output.
  6. Apply pressure to the pressure port of the Pressure Transmitter to raise the reading to the calibration range’s 100% URV.
  7. While focusing on the 20mA reading on the multimeter, adjust the SPAN adjustment menu in the display or the SPAN adjustment potentiometer of the Pressure Transmitter. This sets the Pressure Transmitter’s URV output.
  8. For SMART Pressure Transmitters, use a HART communicator. After connecting the communicator and the transmitter, choose the lower range value trim and higher range value trim options from the HART Communicator Menu.
  9. Repeat the calibration method as needed until the Pressure Transmitter is within the specified tolerance.

Note: The calibration process may vary based on the specific pressure calibrator and Pressure Transmitter used, so it is essential to follow the manufacturer’s instructions carefully.

% Error = [(Measured Output – Expected Output) / Span] × 100

Conduct linearity tests in both the upscale and downscale directions at 0%, 25%, 50%, 75%, and 100% to verify the accuracy of the Pressure Transmitter’s output values.

To determine the calibration check point value for linearity checks, utilize this online calibration test points value calculator.

  1. Examine the output values at each test point. If any value falls outside the acceptable range, calibration becomes necessary.
  2. In case the output values deviate from the allowed range, consider either servicing the Pressure Transmitter or replacing it.
  3. Confirm that, if all output values (+/- %) are within acceptable bounds, no additional calibration is required for the Pressure Transmitter.
  4. Use this Instrument accuracy calculator to calculate error and accuracy for each recorded output reading.
  5. Enter the obtained output data into the designated “as found/as left” columns of the blank calibration report for the Pressure Transmitter.
  6. Include routine linearity tests into your calibration method, assuring systematic testing at specified times to maintain the Pressure Transmitter’s accuracy and reliability.

Note: Consistent linearity testing and dedicated collection of calibration data are required for maintaining the Pressure Transmitter’s accuracy and dependability over time.

  1. Once the calibration is successfully finished, affix the calibration label securely to the Pressure Transmitter.
  2. After completing the calibration process, clean the instrument thoroughly, store it in a secure location, and document the calibration data for future reference.
  3. Disconnect the Pressure Transmitter, pressure calibrators, and any other associated setups used during calibration.
  4. Reinstall the Pressure Transmitter connections back into the processing area, ensuring it is securely fixed.
  5. Ensure the workplace is left in a clean and organized state.
  6. De-isolate the equipment as necessary.
  7. Return any bypassed or inhibited signals to their original levels.
  8. Verify that the Pressure Transmitter is functioning correctly before resuming its normal operation.

Ensure that the calibration report includes information about traceability, such as the calibration standards used and their calibration certificates.

Refer to the image below for an example calibration report for the Pressure Transmitter, which was performed in the field with a loop calibrator and a standard pressure calibrator as the reference.
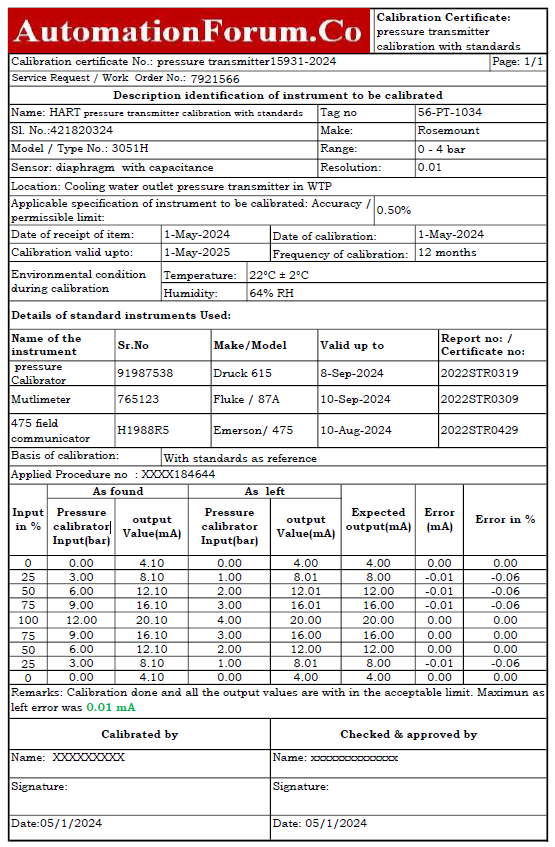
To ensure accurate and reliable signal transmission for best performance in industrial operations, follow our pressure transmitter calibration method, which has been thoroughly designed in accordance with NIST standards.

IEC 61508 sets safety standards for electrical systems in critical industries. Adhering to its calibration methods is vital for safe and accurate pressure measurement. It provides a systematic approach throughout the system’s lifecycle, crucial for safety in pressure transmitters.

CategoryModelFeaturesAccuracyUsability Description
High-EndFluke 754Multifunctional; sources/simulates/measures pressure, temp, electrical0.005% of readingLarge graphical display, HART support, documenting capability
Druck DPI 620 GeniiIntegrates pressure, temp, and electrical measurement/calibration0.005% of readingTouchscreen, HART, Fieldbus, Profibus communication
Mid-RangeFluke 717Single-function pressure calibrator0.025% of full scaleRugged, simple UI, HART compatible
Additel 760Portable and fully automatic pressure calibrator0.02% of readingTouchscreen, battery-powered, field-ready
Budget-FriendlyAmetek Jofra HPC500Handheld, field-suitable pressure calibrator0.025% of full scaleUser-friendly, durable, reliable
GE Druck DPI 610/615Portable, battery-operated calibrator0.025% of readingRugged design, easy field usability
EnvironmentRecommended Interval
Critical applications6 months
Stable environments1–2 years
Harsh conditions6 months
Post-repairImmediately

Always follow the manufacturer’s recommendations and regulatory requirements.

When calibrating gauge pressure transmitters, their vent must stay exposed to the outside air.
There is a vacuum reference for absolute pressure transmitters, and they must be calibrated using either that reference or the manufacturer’s correction factor.
Before applying pressure, differential pressure transmitters need to balance both the high and low ports.
It’s vital to say what kind of transmitter it is because the way you calibrate it depends on how you vent it, compensate for it, and set it up.

Not venting the low-pressure port of a DP transmitter causes zero errors.
Hoses that leak cause measurements to be unsteady.
If you pump too quickly, the temperature will be wrong.
Not isolating impulse lines keeps fluid trapped inside.
If you don’t take into account the implications of mounting position, your zero will be wrong.
Before putting pressure on the system, always bleed, equalize, and stabilize it.

Usually between 0.1% and 0.5% of span. Refer to the datasheet.

Sensor trim calibrates internal sensor values; output trim adjusts 4–20 mA loop.

For basic analog models, yes. For smart transmitters, a HART device is essential.

If the transmitter fails to meet tolerances after adjustment or shows drift.

Control valve pressure test

0


Introduction

For proper working of control valves there are some tests .they are commonly called as control valve pressure test.There are 3 types of Control valve pressure tests

  1. Body test

  • For body test blind the output of control valve using blind flange
  • Valve should be fully opened position either control valve is NO or NC. It should be open at the time of test.
  • The other important parameter to check is body rating of control valve.

Body rating is the amount of total pressure which the body and stem seal can withstand without leaking.

  • If the body rating is 300 psi
  • The pressure of water that should give through inlet of control valve is 300  * 1.5 = 450 psi
  • With the help of pump produce 450 psi in the control valve and with the help of master gauge we can make sure that pressure is 450 psi
  • Then close the mechanical valve.
  • Check whether any leakage of water through outlet of control valve.
  • If there is no leakage the body test is passed.


  1. Seat leakage test(flow test)

  • For flow test outlet of the control valve should be open
  • The valve should be fully closed
  • The procedure is same as body test
  • Apply 450 psi to the valve and check for any leakage.
  • If there is leakage i.e. due to trim damage, seat ring damage, actuator and valve stem are not properly connected and aligned.

  1. Function test

  • Check whether the valve is properly assembled.
  • The valve, i/p converter, current generator, and instrument air supply are set up.
  • Instrument air supply Is checked. It is set according to the i/p converter requirements
  • 4 ma current signal is applied to the i/p converter the valve stem shall be in 0% travel
  • When 20 ma is applied 100% travel should be done
  • If the valve stem travel indication didn’t show correctly then calibration is to done.

Different components of a control loop

0

What is control loop?

A Control loop is the fundamental building block of the industrial control system or industrial automation. It is a group of components working together as a system to achieve and maintain the desired value of a system variable by manipulating the value of another variable in the control loop.

An instrumentation control loop consists of a controller that can adjust the process variable equal to setpoint by measuring the current process variable using sensors.

Components of a Control loop:

There are different types of control loop components combinedly work for the common desire of the system or to attain the setpoint. They are:


  • Primary element/sensor
  •  Transducer
  •  Converter
  •  Transmitter
  •  Signal
  •  Indicator
  •  Recorder
  •  Controller
  •  Correcting element/final control element
  •  Actuator


Primary element/Sensors:

Sensors are the first element in the control loop which measures the change in the process and reporting the process variable so they are also called as the primary element. Sensors are devices which cause change when affected by a change in the process variable. There are different types of sensors for measuring variables like Pressure, Temperature, Flow, Level, pH, Vibration etc.,

There are different types of sensors available for various process variable:

  • Thermocouples, RTD for Temperature measurement
  • Strain gauge, Pressure sensing diaphragm, capacitive cells for pressure measurement
  • Orifice plate, Pitot tube, Magnetic flow tube etc., for flow measurement

There are so many other sensors used to measure different variables like vibration, pH, force, weight etc..,


Transducers:

A transducer converts any form of energy into another form. In electrical instrumentation field Transducers are devices which converts a physical variable into electrical signals. Another name transducers are Pick-ups.

In process control, a converter used to convert a 4–20 mA current signal into a 3–15 psi pneumatic signal is called a current-to-pressure converter. There are different types of transducer classified based on their working principle.


Transmitters:

Transmitters are devices that convert the signal into a standard signal that can be transmittable through the control loop and the parameters can be monitored remotely.

  • Pressure transmitters
  • Flow transmitters
  • Temperature transmitters
  • Level transmitters
  • Analytic transmitters

 Signals:

Signals are used to transmit process variable from transmitter to the controller and sent back the feedback signal from the controller to the final control elements. There are three types of signal in industrial automation:

  • Pneumatic signal:  Air pressure in the pneumatic pipeline change according to the change in the process variable. The standard pneumatic pressure in the signal pipe in industries are in a range of 3-15psi.


  • Analog signal:  Analog signals are mostly used control signals, the transmitter sends the signal through a set of electrical wire. The standard signal range is within 4-20mA, for LRV valve a 4mA signal is produced and for URV it is 20mA.Other common standard electrical signals include the 1–5 V (volts)
    signal and the pulse output.


  • Digital signal:  Digital signals are special protocols used for communication in industries. All protocol are owned by specific companies, they include Fieldbus foundation, Modbus from Modicon, Profibus, DeviceNet from Rockwell automation.

Indicators:

An indicator is human readable devices that display the process variable. There are analog indicators such as used in pressure, temperature gauges and there are digital indicators that display process variables as the digits. Even though the process varible is connected to the controller, the indicators are used industries for different purposes.

Recorder:

Recorders are used in industries to provide history on the process and to be submitted to regulatory agencies for verification. By recording the readings of critical measurement points and comparing those readings over time with the results of the process, the process can be improved.


Controllers:

Controllers are the centre of process control, which receives process variable then compare with setpoint stored in the controller and sends a feedback as the controller output to control the final control element. There are pneumatic and electronic or programmable such as DCS, PLC uses a complex mathematical algorithm to perform the control action.

PLC (Programmable Logic Controller): PLCs are usually computers connected to a set of input/output (I/O) devices. The computers are programmed to respond to inputs by sending outputs to maintain all processes at setpoint.

DCS (Distributed Control Signal): DCSs are controllers that, in addition to performing control functions, provide readings of the status of the process, maintain databases and advanced man-machine-interface.


Final control element:

Final control elements are the correcting elements that receives signal from the controller and make a change in process to adjust the process variable at the desired parameter. In any control loop, the speed with which a final control element reacts to correct a variable that is out of setpoint is very important. Many of the technological improvements in final control elements are related to improving their response time.

For example:

Pumbs and Control valves – Final control devices of Flow control system

Heaters and Boilers – Final control devices of temperature control system

Compressor and Valves: Final control devices of pressure control system


Actuators:

An actuator is the most important part of the final control element, a device that causes physical change in the final control element. For a valve actuator is the valve stem actuator and for a heater, it is the heating coil. An actuator can be controlled by pneumatically, Hydraulically, Electrically.

Calibration of capacitance type level transmitter

0

Capacitance type Level Transmitter principle 

There are different kinds of level measuring techniques .one of the simplest method is capacitance type method.

A capacitor is formed when a level sensing electrode is installed in a vessel. The metal rod of the electrode acts as one plate of the capacitor and the tank wall acts as the other plate. As level rises, the air or gas normally surrounding the electrode is displaced by material having a different dielectric constant. A change in the value of the capacitor takes place because the dielectric between the plates has changed. RF (radio frequency) capacitance instruments detect this change and convert it into a relay actuation or a proportional output signal. The capacitancerelationship is illustrated with the following equation:


 Capacitance type Level Transmitter


 Capacitance type Level Transmitter   

Calibration of capacitance type level transmitter

1.Remove the level transmitter from the system(tank).

2.check whether transmitter shows zero reading by connecting with multimeter otherwise release the pressure.

    if the transmitter is smart

3.connect 475 hart communicator and multimeter to the level transmitter

4.put multimeter to ma.

5.Fill the corresponding liquid in correct density and note down the readings . Fill liquid at 25%, 50%, 75% and 100% in both ascending and descending orders and note down the readings.

6.check for errors if there is zero and span adjust should be done.

7.for zero calibration :drain the liquid and check the multimeter if it is not 0 then go to sensor trim option in the HART then go to zero trim and the HART communicator will automatically trim the sensor in to zero

8.For span calibration: fill 100% and wait for some time then go to sensor trim and select span trim in HART communicator the 475 will automatically trim the sensor into 20ma.

9. After doing zero and span trimming again check the reading at 0%,25%,50%,75% and 100%.

In case of non smart capacitance type transmitter

10.Connect a multimeter and rotate the zero pot and stop when multimeter shows 4ma.

11.Fill the chamber to maximum liquid level and rotate the span screw to 20ma.

12.Repeat these steps and check all readings.

non smart capacitance type transmitternon smart capacitance type transmitter

Advantages:

Very little force is required to operate them and hence they are very useful in small systems.

They are extremely sensitive.

They have a good frequency response and can measure both the static as well as dynamic changes.

A resolution of 2.5 x 10^-3 mm may be obtained with these transducers.

Disadvantages:

The metallic part of the capacitor must be insulated from each other.

Their performance is severely affected by dirt and other contaminants because they change the dielectric constant.

They are sensitive to temperature variations and there are possibilities of erratic or distorted signals due to long lead length

How to Calibrate Thermocouple Transmitter

0

Introduction

A thermocouple is a sensor used to convert temperature into an electric signal. It consists of 2 dissimilar metals joined together to form junctions. In this session we are going to discuss about Thermocouple transmitter calibration

Working principle  

Seebeck effect: the emf produced in the thermocouple is proportional to the temperature difference between 2 junctions (hot &cold)

How to Calibrate Thermocouple Transmitter

Different types of thermocouples

J type, k type, T type, E type, R type, S type

Thermocouples

Equipments required for calibration

24 vdc supply, multimeter, transmitter, mill volt source(725 process calibrator)

Equipments required for calibration

Procedure for calibrating thermocouple transmitter.

Procedure for calibrating thermocouple transmitter

  • Connect the circuit as shown in fig
  • Put multimeter into ma.
  • Let us look at this calibration procedure through an example
Example:

LRV=0 degree Celsius   and URV=200 degree Celsius

So 5 point calibration values be like this

4ma-0 degree Celsius

8ma-50 degree Celsius

12ma-100 degree Celsius

16ma- 150 degree Celsius

20ma- 200 degree Celsius

So right now we know the corresponding values of temp to ma

  • In process calibrator select thermocouple option.
  • And give different values of temperature in process calibrator and check the ma in multimeter and by adjusting zero and span potentiometer in the transmitter correct the ma values.
  • Repeat this procedure.

To know about Thermocouple basics and types of thermocouple.

Displacer type level transmitter calibration / Leveltroll Calibration

0

Introduction

Leveltroll is a combination of torque chamber, torque arm, torque tube, displacer and with this mechanism we can measure the level.A Leveltroll in and instrument used for measuring the liquid level between two known points. The Leveltroll works on the buoyancy principal. Leveltroll has a float, which submerses proportionately with liquid level raise in the float chamber. The amount of submersion of the displacer depends on the liquid density, which produces a torque. The amount of torque produced in measured in terms of % of level.

Calibration of Displacer Level Transmitter

In most of the cases the leveltroll is calibrates in the field due to its complex structure as you can see in the pictures.

Calibration of Displacer Level Transmitter

Parts of Leveltroll:

Float chamber, Float, Torque lever, Knife edge, Feedback Bellows, Air Relay, Restriction, Flapper, Nozzle, Feedback link, Density range, Action change lever, HP and LP flange.

Equipments need for leveltroll calibration:

Multimeter, leveltroll, transparent tube

Equipments need for leveltroll calibration

Procedure

  • Close the both primary isolation valves
  • Drain the liquid in the displacer chamber through the drain valves
  • Now there is no liquid in the chamber so it means 0%, so adjust the zero pot in the transmitter and check the value in multimeter and correct to 4ma.
  • Now open 1st primary isolation valve and fill the liquid to the center of the top flange(if the liquid is water, otherwise calculate the length of full level of the liquid by taking product of specific gravity of liquid and height of the displacer)
  • Adjust the span pot in the transmitter and adjust 20ma in multimeter.
  • Repeat the process.

Level measurement interview questions 

How to calibrate RTD transmitter

0

RTD transmitter Calibrating

In industries temperature is a major physical quantity that has to be monitored and controlled.In this session we are discussing about calibration of RTD transmitter.

Both RTDs and thermocouples are used for process temperature measurements.

Equipments needed

  • Transmitter
  • 24VDC supply
  • Decade box(resistance)
  • Multimeter

Theory

  • RTD has no polarity
  • There are different kinds of RTD (2 wire,3 wire,4 wire)
  • Output of RTD will be change in resistance due to change in temperature.
  • Commonly used RTD materials are nickel, platinum, and copper.

Formula needed for calibration:

Formula needed for Calibration

Procedure for calibrating RTD transmitter

Procedure for Calibrating RTD Transmitter

  • Remove the temperature element (RTD) from transmitter.
  • Connect the circuit as shown in figure above.
  • Put multimeter in ma.
  • By the equation we can find what will be the output resistance of RTD in specific temperature
Example:

            For a pt100 RTD

            ? = .00385

           R0=100

           Let’s take the temp= 30 degree Celsius

R=R0 (1+? ?T)

So R30=111.35?

  • So by the equation we can find resistance values for 5 point calibration (4ma,8ma,12ma,16ma,20ma)
  • By setting these resistance values using decade box we can find the corresponding ma in multimer.
  • By changing the zero and span potentiometer in transmitter we can do the 5 point calibration.
  • Repeat the process.

Comparison between RTD and Thermocouple

How to calibrate Pressure gauge ?

0

Introduction

Pressure gauge calibration is one of the simplest calibration procedures.Pressure gauges are pressure indicating instruments. Normally pressure gauges consist of bourdon tubes as pressure sensing elements.

How to calibrate Pressure gauge

There are different types of pressure gauges based on different manufactures so the calibration methods will                    also change let’s see some calibration methods.

  1. Adjusting the knob at the lower side of the pressure gauge.

    lower side of the pressure gauge

Some pressure gauges have knob for calibration outside the gauges like shown in fig above.

Just remove the lock and calibrate the gauge.

  1. Adjusting the screw located inside the pressure gauge mechanism.

In some gauges manufactures provide the calibration screw in the dial pad (as you can see in the below fig.                        Near to the pointer) adjust that screw to calibrate.

lower side of the pressure gauge

  1. Adjusting the screw located at the gauge needle pointer itself.

gauge needle pointer itself

Some gauge manufactures provide calibrating screw in the pointer. Adjust the screw to calibrate.

  1. Opening the Pressure Gauge Protective Glass (or plastic cover) then removing the needle.

How to calibrate Pressure gauge

Open the protective glass of pressure gauge to calibrate and adjust zero and span. Opening the glass by Craftsman 2 pc 16” Rubber Strap Wrench Set using needle puller pull the needle and  adjust o psi and span by applying pressure by hand held test pump or by  any other means.How to calibrate Pressure gauge

Basic procedure of pressure gauge calibration.Basic procedure of pressure gauge calibration

  • Connect the equipment’s as shown in  above figure to calibrate the pressure gauge.
  • Apply pressure 0%(zero adjust)
  • Adjust the zero screw or put the pointer on 0%
  • Apply pressure 100%(span adjustment)
  • To correct the indication increase or decrease the sector arm
  • Apply pressure 50%(linear adjust)
  • Adjust the length of link or pull the pointer using puller and place at correct spot
  • Check points 0%,25%,50%,70% and 100%
  • Repeat these steps to get correct values

8 Things You Need to Know When Selecting a Pressure Gauge

Basics of Infrared Gas Analyser

0
Principles of Infrared Analysis:

Infrared (IR) absorption (or reflection for solids) is a technique that can be used successfully for continuous chemical analysis of a process. The IR region of the electromagnetic spectrum is generally considered to cover wavelengths from 0.8 to 1000µ m. These limits, expressed in frequency terms (cm-1, wave numbers or the number of waves per cm) are 12,500 cm-1to 10 cm-1.

The region of the IR most used by process analyzers is broken into two parts: the near IR (12,500 to 4000 cm-1) and the mid IR (4000 to 650 cm-1). Except for a small overlap region, sources and detectors that are needed in the near IR will not work in the mid IR and vice versa. Most laboratory IR spectrophotometers work form 4000 cm-1 to between 650 and 200 cm-1,

Infrared radiation interacts with all molecules [except the homonuclear diatomics oxygen (O2), nitrogen (N2), hydrogen (H2), chlorine (Cl2), etc.] by exciting molecular vibrations and rotations. The oscillating electric field of the IR wave interacts with the electric dipole of the molecule, and when the IR frequency matches the natural frequency of the molecule, some of the IR power is absorbed. The pattern of wavelengths, or frequencies, absorbed identifies the molecules in the sample. The strength of absorption at particular frequencies is a measure of their concentration. Analytical laboratory IR is largely concerned with identification, or qualitative analysis, while process IR is concerned with quantitative analysis.

Fundamentals of Infrared Analysis :

Particular groups of atoms tend to absorb at the same time frequency with very little influence from the rest if the molecule. These group frequencies are a great help in identifying molecules from the IR spectra. On the other hand, similar molecules, such as a series of homologous hydrocarbons, have very similar IR spectra. Infrared analysis is, therefore, most straightforward when the component molecules of the sample have significantly different atomic groupings. A mixture of aliphatic hydrocarbons would be better analyzed by another technique, such as gas chromatography. The part of the spectrum offering the best discrimination between molecules is between 7 and 15 µm, the so-called finger-print region.

The starting point for quantitative analysis is the Beer-Lambert law, which relates the amount of light absorbed to the sample’s concentration and path length.

A= abc=log10 I0 / I

Infrared Gas Analyser Equation

Where:
A= absorbance
I= IR power-reaching detector with sample in beam path
I0= IR power-reaching detector with no sample in beam path
a= absorption coefficient of pure components of interest at analytical wavelength; the units depend on those chosen for b and c
b= sample path length
c= concentration of sample component

The law states that concentration is directly proportional to absorbance at a given wavelength and path length and a specified temperature and pressure.
Calibration plots of A versus C can be made up using known samples and used to analyze unknown ones. The Beer-Lambert law is also helpful in choosing the optimum sample path length for accurate analysis.

The law states that concentration is directly proportional to absorbance at a given wavelength and path length and a specified temperature and pressure.

Single-Beam Dual Wavelength Configuration:

Single Beam Dual Wavelength Configuration
Single-beam analyzers are provided with two optical filters one for the sample, the other as a reference. The reference filter is selected in a region  where the components of interest are not absorbing, while the measuring filter is chosen to be absorbing in the spectral region of interest. As the chopper alternatively spins one filter or the other into the optical path, the difference or ratio in the energies received at the detector will be a function of the concentration of the component of interest.
Single beam dual wavelength (SBDW) infrared analyzers are able to make measurements using one source, one measurement cell and one detector. Typically, a lens is used to focus the light for a straight pass through the cell. Thus, the SBDW analyzer does not depend on internal reflections to increase energy throughput or increase effective path length. In a practical sense, effects of component aging and window contamination are minimized, since aging and contamination effects both the measurement and reference wavelengths equally. In fact using the SBDW principle an infrared analyzer can perform to specifications with up to a 50% coating on the windows. After this point, energy transmission falls to a point where noise in the data results in decreasing analytical precision.
Another advantage of this analyzer is the split architecture of the analyzer, with the cell being separate from the source and detector modules. This facilitates ease of maintenance and separates the process containing component from the electronics, which is always a good analyzer system design practice. Next, the cells use mechanical seals (o-ring grooves, Bevel washers), which impart excellent pressure ratings (up to 1000 psig). Variable path lengths are available, as are heated cells.
The primary drawback of this design is the low spectral resolution available. Optical filter bandwidths are typically 1-2% of the actual wavelength at half height. This can result in interferences, as will be seen for the CO application. Interferences can occur both for the measure wavelength (typically a positive interference) and for the reference wavelength (typically a negative interference). One way to compensate for this problem is to make a thorough stream survey, either with grab samples and process knowledge or in-situ, perhaps with a temporary installation of a process FTIR.
Dual-Beam Configuration:

Dual Beam Configuration
In the dual-beam configuration the IR radiation is allowed by the chopper to pass alternately through the sample and the reference tube . The reference tube provides a true zero reference, as it is filled with nonabsorbing gases. A narrow bandpass optical filter is placed in front of the detector to limit the IR energy it receives to the wavelength which is characteristic of the component of interest. Therefore if the sample contains the component of interest, this will attenuate the magnitude of the detected signal in the absorption band of the bandpass filter. The use of the reference cell in the dual-beam configuration reduces the drift causes by power supply or temperature fluctuations. The use of collimating optics also eliminates the need for internal reflection from the interior surfaces of the tubes, thus simplifying their construction and elimination the associated drift.
The classical dual beam infrared analyzer can use one or two sources (both are available today), a measurement or sample cell, a sealed reference cell and a gas filled Luft detector. This analyzer is spectroscopically a high resolution analyzer, with excellent sensitivity and background rejection. The background rejection is conferred both by the gas fill in the detector itself, which is usually the component of interest (in this case CO) and by the sealed reference cell, which is used to balance the optical energy through the two beams of the analyzer. The double layer Luft detector design imparts additional desirable characteristics, such as extended range and stability. Rejection ratios can be on the order of 50,000:1 or greater, depending on the application. Also, sensitivity has been shown as low as 0-1 ppm full scale for semiconductor applications. The combination of sensitivity and rejection ratio available in the Luft type analyzer is almost unmatched by other techniques.
The most common stated drawbacks of the Luft design are effects of mechanical vibrations and temperature on the detector itself . These drawbacks can be overcome with good installation practices. Unfortunately, other drawbacks exist, primarily due to instrument design choices made by analyzer suppliers, which have prevented even wider use of the Luft design in actual process analysis. These center on the 19 inch rack mount design, with a low pressure cell being mounted inside the analyzer with the electronics. The low pressure cell is a problem as it limits options for sample return into the process. The low pressure ratings of most commercially available also cause concern when flammable (ethylene) or toxic (phosgene, HCl, chlorine, etc.) sample require analysis. These frequently use windows which are held in place with an adhesive, rather than use of mechanical seals such as o-rings and Bevel washers. Finally, many Luft analyzers have cells which are designed to be internally reflecting (i.e., gold sputtered on Ni electroplated on steel). This is to maximize energy throughput for an unfocused set of optics, and to increase effective path length. The drawback to this type of cell is the fouling and corrosion/pitting associated with many process samples. These effects can drastically cut throughput and have the additional effect of changing effective cell path length, resulting in a span change and a decrease in precision. 


Thermal Conductivity Gas Measurement

0


Thermal Conductivity Gas Detectors 

All gases possess varying degrees of ability to conduct heat.  In order to have a means of comparing the gases’ abilities, a coefficient has been assigned to each gas according to its capacity to retain heat.  These coefficients and a controlled environment provide a way to determine the amount of a particular type of gas present in a gas sample.  The unit of measure is percentage concentration of gas.

Thermal Conductivity Gas Analyzer

A gas analyzer consists of two parts: a sensor assembly and a control unit.  The sensor assembly contains two gas chambers, one for the measured gas and the other for the reference gas.  The entire sensing assembly is temperature-controlled to ensure a constant temperature, and there is a thermistor in each of the chambers for sensing the temperature of the respective gases.  By knowing the properties of the sensor assembly, the conductivity coefficients of each gas, and the temperature reading of each gas chamber, the concentration of the measured gas can be calculated and displayed on the control unit.

In most applications, the sample gas must be properly conditioned before entering the sensing unit’s gas chamber.  This conditioning usually consists of reducing and/or regulating the pressure of the sample, filtering the sample of various contaminants, and maintaining the temperature within a standard range.
A sample panel, used for most applications, contains all the necessary filters, pumps, pressure and flow regulators, and valves for proper conditioning and ease of calibration and normal operation.   The panel also provides the necessary piping for transporting the sample from the process to the analyzer, as well as for disposing of the analyzed sample by venting to atmosphere or returning it to the process.

Applications of Thermal Conductivity Gas Analyzer

The most common application where the thermal conductivity gas analyzer is used is in the utilities/power industry where a hydrogen-cooled generator is present.
Other industries, such as pulp and paper, chemical, and food, also may provide their own power by means of their own hydrogen-cooled generator.  
Monitoring these gases with a thermal conductivity gas analyzer ensures enhanced safety (certain concentrations of hydrogen are explosive), lower maintenance, more efficient cooling (thus improving generator output), and constant monitoring.