HomeMoreHow toP&ID (Piping and instrument diagram) & PFD (Process flow diagram).

P&ID (Piping and instrument diagram) & PFD (Process flow diagram).

Published on

spot_img

P&ID: Schematic illustration of instruments and their interconnection is called P&ID.

PFD:Process flow diagram.PFD gives an overview of the plant process.PFD is a simplified version of P&ID.
Symbols,circles and lines are used to represent instrument and their interconnection.For identifying instruments and pipe lines tag numbers are used.For reading P&ID(Piping & instrument diagarm) one must be familiar with standard instrument symbols and standard identification letter.


Instrument Location:The presence or absence of a line determines the location of the physical device.Some instruments are a part of a distributed control system where a specific controller or indicator can be selected from many others but shown in one location.


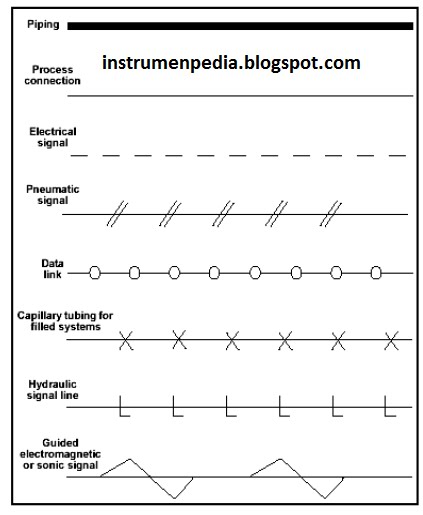
Piping and connection symbols:These symbols are used to identify how the instruments in the process connect to each other.And what type of singnal is being used.

Valve symbols.

Learn to read instrumentation drawings.

Tag: P&ID,Piping and instrument diagram,PFD,Process flow diagram,Valve symbol,Instrument symbols


Latest articles

Essential Control Valve Performance Parameters

Table of ContentsDead Band & BacklashActuator-Positioner DesignResponse TimeValve TrimDead TimeGainHysteresisInherent CharacteristicShaft Wind-UpValve Capacity (Cv...

Cause-and-Effect Diagrams in Process Industries: Test Your Knowledge

The Cause-and-Effect Diagram in Instrumentation and Control Engineering quiz welcomes you to its examination....

Easy Pull-Up Resistor Calculator for PLC Inputs in Discrete Sensor Applications

Table of ContentsWhat is a PLC?What is a Pull-Up Resistor in PLC Applications?PLC Input...

Step-by-Step Guide for Troubleshooting Radar Level Transmitters

Table of ContentsHow do you troubleshoot a radar level transmitter?Problem no.1: Power Supply IssuesProblem...

More like this

Essential Control Valve Performance Parameters

Table of ContentsDead Band & BacklashActuator-Positioner DesignResponse TimeValve TrimDead TimeGainHysteresisInherent CharacteristicShaft Wind-UpValve Capacity (Cv...

Cause-and-Effect Diagrams in Process Industries: Test Your Knowledge

The Cause-and-Effect Diagram in Instrumentation and Control Engineering quiz welcomes you to its examination....

Easy Pull-Up Resistor Calculator for PLC Inputs in Discrete Sensor Applications

Table of ContentsWhat is a PLC?What is a Pull-Up Resistor in PLC Applications?PLC Input...