*Ask panel man to put the controller in manual mode for control loop
*Isolate the Control valve from the process.
WARNING – The Isolation of control valve from the process shall be done by field operator. Careful step shall be done to ensure no upset to the operation.
*Hook up HART Communicator and verify some parameters by refer to data sheet such as Tag Number, OP and etc.
IP address (Internet protocol) is unique address to identify a device in a network. IP address is made up of 32 bits and it is divided in to two parts with the help of subnet mask.
Network ID and Host ID.
8 bit
8 bit
8 bit
8bit
Eg:123.123.123.123.
IP Classes. Class A, Class B, Class C
What is the use of IP address in instrumentation?
Nowadays some of the instrument manufactures are using Ethernet as a communication protocol. Eg: BentlyNevada vibration monitoring system. For co
How to set IP address?mmunicating with such field instruments or field device you need to set ip address of your computer with same class.
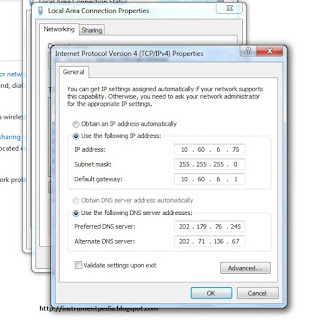
Windows 7.
Control panel>Network and Internet>Network and sharing center.
Double click on the local area connection.
Go to properties.
Double click on “Internet protocol version 4”
Set the IP address and subnet mask.
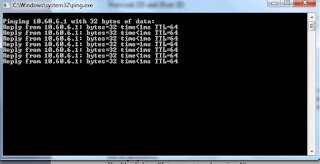
How to check whether the connection is established with field device or not?
Go to RUN>CMD
Type – ping “IP address of the device”
Eg: ping 123.123.123.123
If the device is replying, communication is established. Otherwise you have to go for further trouble shooting.
Two types of cables are used for establishing Ethernet communication.
While reading the instrument specification or electrical equipment specification you might have seen IP classes.IP is interpreted as Ingress protection.Ip calsses stands for specifying the environmental protection of electrical equipments. With ingression protection class we can understand, an instrument can withstand in which environmental condition. While selecting the instrument it is important to consider the ip class. Price of the instrument also varies according to their ip class.
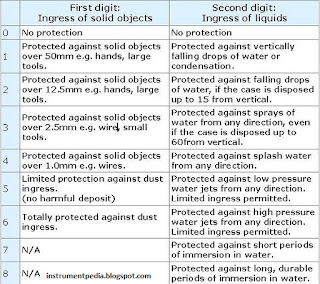
IP class is represented with number. First digit of IP indicates how much the instrument is protected from dust. Second digit of the IP rating indicates how much the instrument is protected from water.
First digit of IP rating
0 = No protection
1 = Protected against touch by hands (>50mm)
2 = Protected against touch by fingers (>12mm)
3 = Protected against tools and wires (>2.5mm)
4 = Protected against tools and small wires (>1mm)
5 = Limited dust ingress protection
6 = Total dust ingress protection
Second digit of IP rating
0 = No protection
1 = Protected against condensation
2 = Protected against water spray < 15 degrees from vertical
3 = Protected against water spray < 60 degrees from vertical
4 = Protected against water spray from any direction
5 = Protected against low pressure water jets from any direction
6 = Protected against high pressure water jets from any direction
7 = Protected against immersion between 15cm and 1m depth
8 = Protected against long term immersion to a specified pressure
As an instrumentation engineer we have to do a lot of unit conversion. I got a very effective tool converting units. It is a not a software. It is an excel sheet. No need to install it but Microsoft office software must be installed in your computer for opening the tool.
Define all the process Variable and state their unit of measurement. ?
Flow: Any fluids or liquids flowing from one place to another place is called flow and it is defined as volume per unit of time at specified temperature and pressure .Conditions, is generally measured by positive-displacement or rate meters.
Pressure: It is defined as Force per unit Area. P = F/A
Units : bar, Pascal, kg / cm2, lb / in2.
Level: The height of the water column, liquid and powder etc., at the desired measurement of height between minimum level points to maximum level point is called level. The measurement principle is, head pressure method.
Units: Meters, mm, cm, percentage.
Temperature: It is the degree of hotness or coldness of a body is called temperature.
Units : Degree Centigrade, Degree Fahrenheit, Degree Kelvin, Degree Rankin.
Quality: It deals with analysis.( pH, % CO2, % 02, Conductivity, Viscosity )
P&ID diagrams are essential tools in various industries, including chemical, petrochemical, pharmaceutical, power generation, and others.
They provide a visual representation of the process flow, equipment, piping, instrumentation, and control systems involved in a particular industrial process.
Understanding how to read P&IDs is crucial for engineers, operators, and technicians involved in designing, operating, and maintaining industrial processes.
Purpose of P&ID Diagrams
P&ID diagrams have been used in industries for many decades, evolving from simple hand-drawn sketches to sophisticated computer-generated diagrams.
They originated from PFDs (Process Flow Diagrams) but provide more detailed information about the equipment and instrumentation involved in the process.
The primary purpose of P&IDs is to communicate complex process information in a clear, standardized format, facilitating design, construction, operation, and maintenance activities.
Components of a P&ID Diagram
A typical P&ID diagram consists of various components, including equipment, piping, valves, instruments, control loops, annotations, and symbols.
Each component serves a specific purpose and is represented using standardized symbols and conventions.
Understanding these components is essential for effectively interpreting P&IDs.
Equipment
Equipment such as vessels, tanks, pumps, compressors, heat exchangers, reactors, distillation columns, etc., are represented on P&IDs.
Each type of equipment is depicted using a specific symbol, often with annotations indicating its size, capacity, and other relevant information.
Piping
Piping lines connect different equipment items and transport fluids or materials throughout the process.
Piping lines are represented by lines of various types (solid, dashed) and thicknesses, indicating the type of fluid, direction of flow, and other properties.
Valves, fittings, reducers, and other accessories are also depicted on the piping lines.
Valves and Fittings
Valves play a crucial role in controlling the flow of fluids within the process.
Different types of valves, such as gate valves, globe valves, ball valves, check valves, control valves, etc., are represented using specific symbols.
Similarly, fittings like elbows, tees, reducers, unions, etc., are depicted on the piping lines to indicate changes in direction, size, or configuration.
Instruments and Controls
Instruments and control devices monitor and control various parameters within the process. These include sensors, transmitters, indicators, controllers, recorders, switches, etc.
Each instrument is represented by a specific symbol, often accompanied by annotations indicating its function, range, and connection details.
Control Loops
Control loops regulate process variables such as temperature, pressure, level, flow rate, etc.
These loops typically consist of sensors, controllers, actuators, and final control elements (valves).
P&IDs depict control loops using specific symbols and annotations to illustrate the interaction between different components.
Annotations and Labels
Annotations and labels provide additional information about equipment, instruments, piping, process conditions, and other relevant details.
They help clarify the meaning of symbols and provide context for understanding the process depicted on the P&ID.
Reading and Interpreting P&ID Diagrams
Reading and interpreting P&ID diagrams is a critical skill in various industries, including chemical processing, oil and gas production, power generation, and more.
These diagrams provide a detailed representation of the equipment, piping, instrumentation, and controls involved in a process.
How to Read a P&ID?
Here’s a detailed exploration of each step in the systematic approach to reading and interpreting P&ID diagrams:
Step 1: Understand the Legend
Understanding the legend thoroughly equips users with the necessary knowledge to interpret the symbols, annotations, and abbreviations used in the P&ID accurately.
Access the Legend: It’s typically adjacent to the P&ID or provided separately. It lists symbols and their meanings.
Symbols and Meanings: Symbols represent components like equipment, instruments, piping, and fittings. Each symbol comes with a brief description.
Annotations and Abbreviations: Annotations provide extra information about symbols and process conditions. Abbreviations streamline descriptions.
Conventions and Notations: The legend outlines graphical conventions like flow direction indicators and special notations for safety components.
Color Codes (if applicable): Some P&IDs use color coding for differentiation, explained in the legend.
Reference Materials: The legend may refer to additional documents for further context, such as equipment datasheets or piping specifications.
Revision History: It may include version control information, ensuring users refer to the latest version.
Step 2: Identify Equipment and Piping
Identifying equipment and piping on a P&ID (Piping and Instrumentation Diagram) is fundamental for understanding the process flow and system configuration. Here’s a concise guide to effectively identifying equipment and piping:
Equipment Identification:
Look for symbols representing equipment items such as vessels, tanks, pumps, compressors, heat exchangers, reactors, and distillation columns.
These symbols are standardized representations of the actual equipment and are typically accompanied by labels or annotations indicating their specific functions.
Familiarize yourself with the symbols and their meanings by referring to the legend provided with the P&ID.
Piping Identification:
Piping lines connect equipment items and transport fluids or materials throughout the process.
Identify piping lines by their graphical representation, typically as solid lines for main process lines and dashed lines for utility lines.
Pay attention to the direction of flow indicated by arrows on the piping lines. Arrows show the direction of fluid flow, with the point indicating the downstream direction.
Trace the path of piping lines to understand how fluids move from one piece of equipment to another and how they undergo processing or transformation along the way.
Consider Flow Direction:
Arrows on piping lines indicate the direction of fluid flow within the system. Follow these arrows to understand the flow path from the source to the destination.
Understanding flow direction is essential for grasping how materials move through the process and identifying the sequence of operations.
Annotation and Labels
Annotations and labels provide additional information about equipment, piping, and process conditions.
Pay attention to alphanumeric codes, abbreviations, or notes accompanying equipment symbols and piping lines. These annotations may describe specific aspects of the process or provide details about equipment specifications, operating conditions, or safety considerations.
Review the Legend:
If you encounter unfamiliar symbols or annotations, refer back to the legend provided with the P&ID.
The legend contains a list of symbols along with their meanings, annotations, abbreviations, and other conventions used in the diagram. Take the time to review and understand the legend thoroughly before proceeding with the analysis.
Step 3: Follow the Flow
To effectively analyze a P&ID (Piping and Instrumentation Diagram), tracing the flow of materials or fluids through the process is essential. Here’s how to accomplish this:
Direction of Arrows
Start by identifying the direction of arrows on the piping lines. These arrows indicate the flow direction of fluids within the system.
Follow the arrows from the source of the material to its destination, tracing its path through the process.
Understanding Material Movement
As you trace the flow, understand how materials move from one equipment item to another. Note the sequence of operations and processing steps involved.
Pay attention to any changes in temperature, pressure, or composition as materials pass through different equipment or undergo various processes.
Processing and Transformation
Consider how materials are processed or transformed along the flow path. For example, fluids may undergo mixing, heating, cooling, separation, reaction, or other treatments.
Understand the purpose of each piece of equipment in the process and how it contributes to achieving process objectives.
Branches, Splits, Merges, and Loops:
Note any branches, splits, merges, or loops in the piping system. These configurations can have significant implications for process flow and control.
Branches and splits may represent points where materials are diverted to different equipment or processes.
Merges occur when multiple streams combine into one, while loops indicate recirculation or recycling of materials within the process.
Significance of System Configuration:
Understand the significance of the piping system configuration in the overall process flow.
Branches, splits, merges, and loops can affect material balance, residence time, mixing, reaction kinetics, and overall process efficiency.
Analyze how the layout of the piping system contributes to achieving process objectives and meeting performance requirements.
Step 4: Identify Instruments and Controls
Identifying instruments and control devices on a P&ID (Piping and Instrumentation Diagram) is crucial for understanding how process parameters are monitored and regulated within the system. Here’s how to accomplish this:
Locate Instruments and Control Devices:
Scan the P&ID for symbols representing instruments and control devices such as sensors, transmitters, controllers, valves, and actuators.
These devices are strategically placed throughout the process to monitor and control various parameters such as temperature, pressure, level, and flow rate.
Understand Symbol Representations:
Each instrument and control device is represented by a specific symbol, standardized across industries. These symbols are accompanied by annotations describing their functions and connection details.
Common symbols include circles for sensors, rectangles for controllers, triangles for valves, and arrows for actuators. The shape and orientation of the symbol often indicate the device’s function.
Functions of Instruments:
Understand the function of each instrument and control device depicted on the P&ID. Sensors measure process parameters such as temperature, pressure, level, and flow rate.
Transmitters convert sensor signals into electrical signals for transmission. Controllers receive signals from sensors and transmitters and adjust control valves or actuators to maintain desired process conditions.
Connection Details:
Annotations accompanying instrument symbols provide connection details, including the type of signal transmitted (e.g., pneumatic, electric), communication protocols, and the process parameter being monitored or controlled.
Pay attention to the direction of signal flow indicated by arrows or lines connecting instruments and control devices to process lines or equipment.
Role in Process Control:
Instruments and control devices play a critical role in maintaining optimal process conditions and ensuring the safe and efficient operation of the system.
Sensors provide real-time feedback on process parameters, allowing operators to monitor system performance and detect any deviations from set points.
Control devices regulate process parameters by adjusting valves, actuators, or other mechanisms based on signals received from sensors and controllers.
Integration with Process Equipment:
Instruments and control devices are integrated with process equipment such as pumps, valves, and reactors to form a closed-loop control system.
Understanding how instruments interact with process equipment helps identify potential control strategies and optimize process performance.
Step 5: Understand Valve and Fitting Symbols
Valves and fittings are integral components of a P&ID (Piping and Instrumentation Diagram), playing crucial roles in controlling fluid flow and directing it within the process. Here’s how to understand their symbols:
Valve Symbols
Different types of valves, including gate valves, globe valves, ball valves, check valves, and control valves, are represented using specific symbols.
Each valve type has a unique symbol, typically standardized across industries. These symbols depict the valve’s operating mechanism and flow characteristics.
For example, a gate valve is represented by a rectangle with a perpendicular line across it, indicating the gate mechanism that controls flow by moving up and down.
Understanding Valve Functions:
Familiarize yourself with the functions of various valve types. Gate valves control flow by raising or lowering a gate mechanism to open or close the flow path.
Globe valves regulate flow by adjusting a plug or disc against a stationary seat, while ball valves use a rotating ball with a bore to control flow.
Check valves allow flow in one direction only, preventing backflow, while control valves modulate flow based on signals from controllers to maintain desired process conditions.
Fitting Symbols:
Fittings such as elbows, tees, reducers, and unions are depicted on piping lines to indicate changes in direction, size, or configuration.
Each fitting type has a specific symbol representing its shape and function. For example, an elbow is represented by a curved or angled line, indicating a change in flow direction.
Understanding Fitting Functions:
Elbows redirect flow by changing the direction of piping lines, typically at 45 or 90-degree angles.
Tees allow flow to be split into multiple directions or combined from different sources, while reducers transition between piping of different sizes.
Unions provide a connection point for joining or disassembling piping sections, facilitating maintenance and repair activities.
Interpreting Symbols in Context:
When interpreting valve and fitting symbols on a P&ID, consider their placement and connection to piping lines and equipment.
Valves are positioned along piping lines to control flow at specific points in the process, while fittings indicate changes in piping direction, size, or configuration.
Referencing the Legend:
If you encounter unfamiliar valve or fitting symbols, refer back to the legend provided with the P&ID for clarification.
The legend contains a list of symbols along with their meanings, helping you understand the function and significance of each symbol used in the diagram.
Step 6: Read Annotations and Labels:
Annotations and labels serve as valuable supplementary information on a P&ID (Piping and Instrumentation Diagram), providing insights into equipment, instruments, piping, and process conditions. Here’s how to effectively read and understand annotations and labels:
Alphanumeric Codes and Abbreviations
Pay attention to alphanumeric codes and abbreviations used throughout the P&ID. These codes and abbreviations represent equipment specifications, process parameters, operating conditions, and other relevant details.
Common abbreviations include units of measurement (e.g., PSI for pounds per square inch, °C for degrees Celsius), process conditions (e.g., LCV for level control valve), and equipment designations (e.g., TIC for temperature indicator controller).
Equipment Specifications
Annotations may include specifications for equipment such as size, capacity, pressure rating, temperature range, material construction, and design standards.
Understanding equipment specifications helps ensure proper selection, installation, and operation of equipment within the process system.
Process Parameters and Operating Conditions
Annotations provide information about process parameters such as temperature, pressure, level, and flow rate, as well as operating conditions such as fluid properties and flow regimes.
These details are critical for maintaining process integrity, optimizing performance, and ensuring safety throughout the operation.
Safety Considerations
Annotations may highlight safety-related information such as relief valve settings, emergency shutdown systems, hazardous areas, and isolation procedures.
Understanding safety considerations is paramount for implementing appropriate safety measures and mitigating potential hazards within the process system.
Additional Details
Annotations may also include additional details relevant to the process, such as equipment tagging, maintenance schedules, process flow descriptions, and troubleshooting guidelines.
These details provide valuable context and guidance for operators, maintenance personnel, and other stakeholders involved in the operation and maintenance of the process system.
Referencing the Legend
If you encounter unfamiliar annotations or abbreviations, refer back to the legend provided with the P&ID for clarification.
The legend contains a list of symbols, annotations, abbreviations, and other conventions used in the diagram, helping you interpret the P&ID accurately.
Step 7: Consider Scale and Orientation:
When analyzing a P&ID (Piping and Instrumentation Diagram), it’s essential to consider the scale and orientation of the diagram. Here’s how to effectively take these factors into account:
Scale of the Diagram:
Note the scale provided on the P&ID, if available. P&IDs are typically drawn to scale, but the scale may vary based on the complexity of the process and the size of the diagram.
Understand the relative sizes and positions of equipment items, piping lines, and instruments depicted on the diagram. This helps in visualizing the layout and spatial relationships within the process system.
Relative Sizes and Positions:
Pay attention to the relative sizes of equipment items and piping lines depicted on the P&ID. Larger equipment may be drawn proportionally larger than smaller components.
Consider the positions of equipment, piping, and instruments relative to one another. Understanding their spatial relationships aids in comprehending the flow of materials and the sequence of operations within the process system.
Flow Direction and Layout:
Analyze the flow direction and layout of the process system as depicted on the P&ID. Arrows on piping lines indicate the direction of fluid flow, while the arrangement of equipment and piping lines reflects the flow path through the system.
Consider how materials move from one equipment item to another and how they are processed or transformed along the way. Understanding the flow path helps in visualizing the overall operation of the process system.
Orientation of Components:
Take note of the orientation of components within the process system. Equipment items, piping lines, and instruments may be oriented in different directions based on their functional requirements and spatial constraints.
Consider how the orientation of components affects accessibility, maintenance procedures, and overall system performance.
Interpretation within Context:
Interpret the scale and orientation of the P&ID within the context of the overall process system. Consider how the diagram aligns with other documentation, such as process flow diagrams, equipment datasheets, and plant layouts.
Understanding the scale and orientation of the P&ID in relation to the entire process system provides a comprehensive view of how the system operates and facilitates effective communication among stakeholders.
Step 8: Refer to Supporting Documents:
When analyzing a P&ID (Piping and Instrumentation Diagram), it’s beneficial to refer to supporting documents to gain a deeper understanding of the depicted process. Here’s how to effectively utilize supporting documents:
Process Descriptions
Review process descriptions to gain insight into the overall operation and objectives of the process.
These documents provide context on the purpose, sequence of operations, and key parameters of the process depicted on the P&ID.
Equipment Datasheets
Consult equipment datasheets to obtain detailed information about specific equipment items shown on the P&ID.
Datasheets typically include specifications, design features, performance characteristics, and installation requirements for each piece of equipment.
Piping Specifications
Refer to piping specifications to understand the materials, sizes, pressure ratings, and design standards of piping components within the process system.
This information helps ensure compliance with regulatory requirements and industry standards.
Standard Operating Procedures (SOPs)
Review SOPs to understand the standard protocols, procedures, and safety guidelines associated with operating, maintaining, and troubleshooting the process equipment depicted on the P&ID. SOPs provide detailed instructions for performing various tasks safely and efficiently.
Safety Guidelines and Regulations
Familiarize yourself with safety guidelines, regulations, and industry standards relevant to the process depicted on the P&ID.
Understanding safety protocols is essential for identifying potential hazards, implementing risk mitigation measures, and ensuring compliance with regulatory requirements.
Process Flow Diagrams (PFDs)
Compare the P&ID with process flow diagrams (PFDs) to gain a broader understanding of the overall process flow, including major process units, material balances, and general equipment arrangements.
PFDs provide a high-level overview of the process, complementing the detailed information provided by the P&ID.
Vendor Documentation
If applicable, refer to documentation provided by equipment vendors or suppliers for additional information on equipment specifications, installation requirements, maintenance procedures, and troubleshooting guidelines.
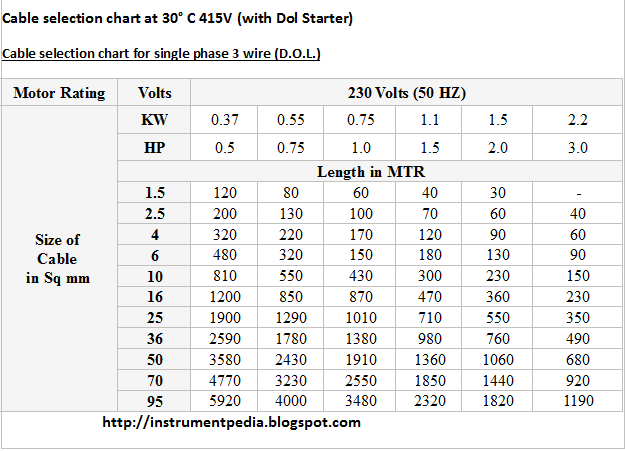
In previous posts i have explained about electrical drawings, electrical panel component etc.. For smooth working of motor which is connected to the mcc panel, cable size selection has an important role. We have to consider lot of things for selecting a proper cable, like motor rating (Kilowatt,Horse power),Voltage(230v, 415 v etc.),Phase(Single, 3 phase),Temperature, Distance between motor and mcc.
Before that i will expalin how to find out the cable current rating.
1.Incoming suppy cable rating.
Motor Full load current * 1.2
2.Inside cables – Motor circuit cable rating.
Motor full load current * 0.7
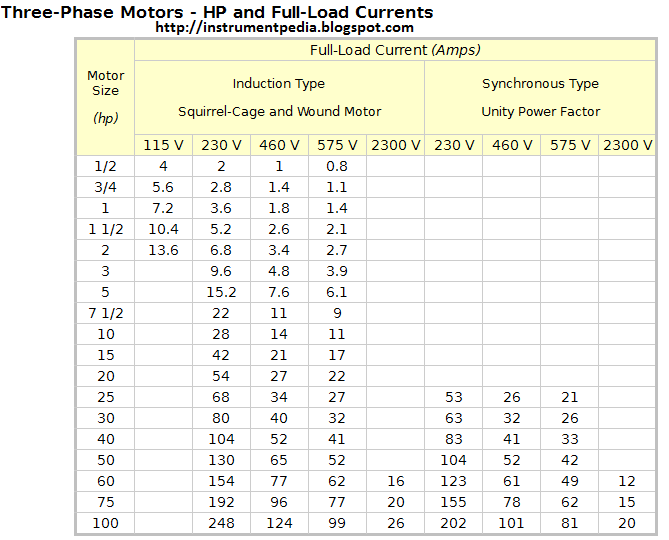
Now you will be having a doubt how to find out the full load current of a motor?
Formula for finding full load current of a motor.
3 phase:
Full load current=(746*hp)/(1.732*V*pf*eff) or KW/(1.732*v*pf*eff)
hp=horse power
v =Voltage
pf=Power factor
ef=efficiency
1 hp=745.7 W=0.746 kw
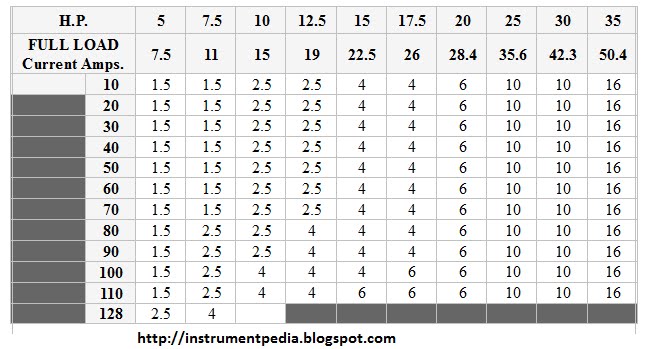
Single phase motor Full load current table [Horse power,Kilo watt]
Three phase motot Full load current table [Horse power,Kilo watt]
MCC stands for motor control center. It consists of feeders for motors and blowers. Feeders are designed according to the motor rating. In most of the MCCs, auto/manual provision will be there. With manual provision motors can be operated manually. In auto provision external signal is required to start the motor. The signal is given by the control panel. Indicators for the motor operation also will be present in control panel.
Control panel consists of a controller. The controller may be PLC, DCS, relay or some other type. It gives digital signal input signal to the MCC panel to start the motor. Control panel works based on the PLC /DCS program or the relay logic. Instruments are normally connected to control panel. Indications for the interlocks also will be there in control panel. Nowadays single panel is used of using separate control and MCC panel.
Overview: Control panel giving start command to motor through MCC
In one of the previous post in instrumentpedia I have described how to read an electrical drawing. Now lets look what is electrical relay diagram. Here I am giving the standard symbols used for the electrical relay diagram. In earlier days instead of PLC or DCS like controllers relays are used as controllers. Nowadays also for controlling small systems relays are using as controllers. Comparing to other controllers it is very cheap. Electrical control circuits are drawn with the standard symbols which are given below.
Components used for making a electrical control circuit and its standard symbols.
Different types of meters are used in the MCC panel for indicating the status of the panel.Mainly three types of meters are used. Ammeter, Volt meter, Watt meter, Energy meter. Analog and Digital type meters are using nowadays.
Ammeter
An instrument used for measuring the current flow in the circuit is called ammeter. It should be connected series to the circuit .
Analog ammeter
Digital ammeter
Voltmeter
The instrument used for measuring the voltage across in the circuit is called voltmeter. It should be connected paralled to the circuit.
Analog volt meter
Digital volt meter
Wattmeter
Energy meter
This is also called as a watt-hour meter. Energy meter is used for measurinh the energy consumed in a circuit.