- What is P&ID?
- What is the purpose of P&ID?
- What are the major functions of the P&ID?
- What are all the information available in the P&ID?
- What are the information which is not included in the P&ID?
- What is the difference between P&ID and PFD?
- How to create a P&ID diagram
- What are all the major symbols used in the P&ID?
- How to read the P&ID diagram?
- Example P&ID loop explanation
- Instrument symbols
- Instrument location
- Identification of the instrument in P&ID
- Examples of P&ID
- Free P&ID developing tools?
- What are the advantages of P&ID?
- What are the disadvantages of the P& ID?
What is P&ID?
Piping and instrumentation diagram plays a major role in the process industry. This diagram would be composed of the components which are used to check and control a specified process. This diagram can be considered as a blueprint of a system in a section of the industrial plant. A P&ID could be a detailed flow diagram of the processing unit, ancillary unit, an offsite product storage system, product loading system, or it could be a drawing of the process and instrumentation system that connects different operating facilities together. The process plant can be designed and maintained with help of a piping and instrumentation diagram. This drawing would show the details of the piping and instrumentation of the processing unit.

What is the purpose of P&ID?
Process system operation would take place very safely with the help of a P&ID. This diagram would display the equipment interconnections in a process and it would also display the instrumentation that controls the process. We can use this diagram for the development of the process. This diagram would be useful while doing the maintenance and also for the modification of the process. The process operation can be carried out safely with the help of this diagram. We should keep the P&ID up to date if we have done any modification to the process then it must be included in this diagram.
What are the major functions of the P&ID?
The major function of the P&ID is to show the equipment and their interconnection in a process. So that it can be utilized to do the maintenance and also the modification of the process. This diagram would be very useful for the design stage, in which it would provide the basis for the development of the control system. It can also be utilized to do the hazard and operational study (HAZOP Study).
What are all the information available in the P&ID?
- All equipment with their name and also their specified tag numbers.
- Instrumentation and their designation along with indicators, recorders, and controllers
- All valves and their specified tag numbers
- Open-loop and closed-loop control representation
- Size of the piping and also the material which is used for its construction
- Vents, drains, special fittings, and sampling lines
- Flow direction
- Permanent start-up and flush lines
- Control inputs and outputs
- Computer control system input
What are the information which is not included in the P&ID?
- Manual switches
- Control relays
- Instrument root valves
- Equipment rating and capacity
- Pressure, temperature, and flow data
- Pipe fittings such as elbows, tees
- Physical details and dimensions
- Piping connection and type like flanged, threaded, etc
What is the difference between P&ID and PFD?
| Piping and Instrumentation Diagram (P&ID) | Process Flow Diagram (PFD) |
| It can be used during construction | Can’t use for construction |
| It would show all process and service piping | It won’t show all process and service piping |
| The presence of controls would be indicated | It won’t indicate the presence of controls |
| It would show all the motor | It won’t show all the motors |
| Shows the thermal insulations | It won’t show thermal insulations |
| It won’t show flow quantities | Shows flow quantities |
| Doesn’t show stream compositions | Shows stream composition |
| It shows all equipment and process lines | It would only show the major equipment and major process lines |
| It would show the instruments that monitor and control the process | It would show major operating conditions like temperature, flow, etc |
How to create a P&ID diagram
- It should show all the required instruments and control loops
- Interlock numbers should be marked as per the interlock description
- It must have all the equipment with the necessary piping which is required for the process
- It must have all the connecting process piping which is required to carry out the process
- It should show all the piping which is needed for the auxiliaries
- It must show all the required valves and also the major non-standard fittings
- Mark size, fluid code, material code, & identification numbers of all the pipelines should be included
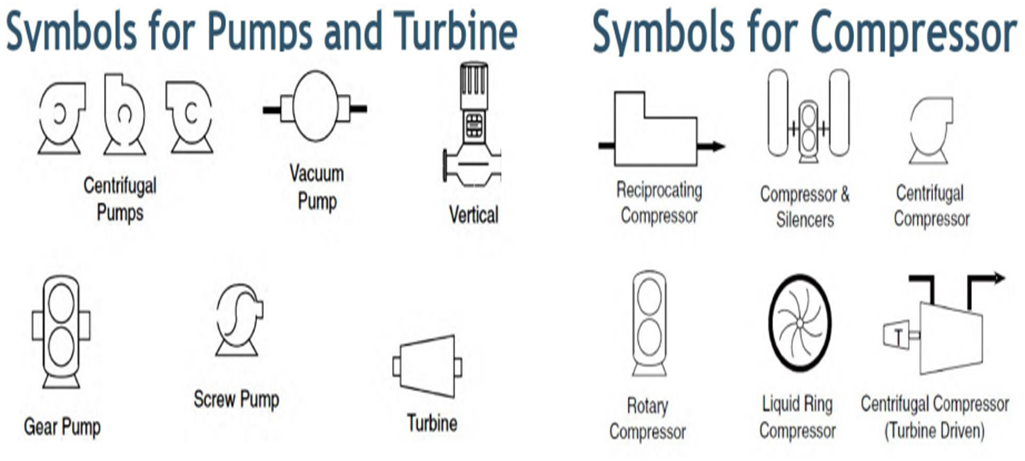
What are all the major symbols used in the P&ID?
Equipment symbol
Process operation units for mass transfer, heat transfer, etc.
Piping symbols
Symbols of pipes, valves, and connections
Instrumentation symbol
Monitoring, sensing and controlling


How to read the P&ID diagram?
In order to read, a P&ID diagram the technician or the engineer should understand the plant’s process symbol list. In the piping and the instrumentation diagram, we can see a lot of symbols and circles to represent each instrument and also how they are interconnected in a process. There will be a title block at the right bottom side of the P&ID diagram and this would contain certain details such as project title, facility name, drawing name, and number. So by checking this title block we could determine where this process is located in the plant. Then we could check the diagram and we can see the equipment, piping connections, instruments, and also the lines that connect the instruments. We can also see the instrument control loops, line numbers, and valve codes. So in order to read this diagram, we should memorize the symbols which are used for the instrument, equipment, valves, and also we should know the symbols which are used for lines. In this diagram, the relative size of the symbol represents the relative size of the actual equipment. The relative position of the symbol also represents the relative position of the actual equipment on the plant.
If the lines which are drawn cross over each other and show a break or gap at the cross over then it shows that these pipes are not connected in the plant. The flow direction is shown in this diagram as a solid arrowhead on the line.
Example P&ID loop explanation

This P&ID image represents the three-phase separator vessel operation, the three-phase separator vessels are most commonly used in the oil and gas industry to segregate the oil, gas, and water that comes from the oil wells. In the image, LT represents the field transmitter and LC is the level controller and the dotted line from the LT to LC represents their connection, basically, the dotted line is the electrical signal from the transmitter to the controller. So the level transmitter would determine the level of the water or oil. We can see the LT and LC on both sides of the vessel, and it is used to separate the water and oil from the vessel. So on the left side of the vessel, we can see a water outlet, and the amount of water that passes through this outlet is determined by the control valve LV. The control valve would receive the electrical signal from the controller so according to this instruction the valve will be opened and the water will pass through the outlet.
In the vessel, we can see the vortex breaker which is used to segregate the oil and water. The level transmitter (LT) in the right side of the vessel would determine the oil level in the vessel and transmits an electrical signal to the controller (LC) so the controller would transmit an electrical signal to the valve (LV) and thus the oil can be separated from the vessel. In the top portion of the vessel, we can see a pressure transmitter connection, this transmitter would determine the pressure level and send an electrical signal to the controller(PV) and this would transmit a signal to the valve(PV) thus the valve would be opened and the vapor will pass through the outlet.
Instrument symbols

- If the instrument symbol is a circle then it represents the individual measurement instrument such as sensors and detectors for pressure-temperature etc.
- The symbol that shows a square with a circle inside display the measurement readings and also performs some control functions
- A hexagon shows the computer function
- A square with a diamond represents the PLC
Instrument location
Solid line – Control room panel
No line – Field
Double solid – Remote panel
Dash line – Behind panel in the control room
Double dash line – Behind the remote panel

Identification of the instrument in P&ID
Instrument symbol would contain letters and numbers, the letter represents the type of the instrument and the number represents the control loop. Mostly two or three letters would be used. The first letter shows the measured or initiating variable. The second letter is a modifier and the last one represents the function.

| SL No | INSTRUMENT | SYMBOL |
| 1 | Temperature indicator |  |
| 2 | Temperature transmitter |  |
| 3 | Temperature recorder |  |
| 4 | Temperature controller |  |
| 5 | Level indicator |  |
| 6 | Level transmitter |  |
| 7 | Level recorder |  |
| 8 | Level controller |  |
| 9 | Flow indicator |  |
| 10 | Flow transmitter |  |
| 11 | Flow recorder |  |
| 12 | Flow controller |  |
| 13 | Pressure indicator |  |
| 14 | Pressure transmitter |  |
| 15 | Pressure recorder |  |
| 16 | Pressure controller |  |
| 17 | Transducer |  |
| 18 | Pressure indicating controller |  |
| 19 | Pressure recording controller |  |
| 20 | Level alarm |  |
| 21 | Flow element |  |
| 22 | Temperature element |  |
| 23 | Level gauge |  |
| 24 | Analyzer transmitter |  |

We can read the above instrument symbol as the PI represents the pressure instrument and the 217 represents the loop. The circle and the box represent the location of the instrument. In the first image there is no line so the instrument is located in the field and in the second and third there is a line and it shows that the instrument is located in the control room. The third image represents the instrument that is functioned in DCS.
While reading the P&ID diagram we should check the revision issue description and it can be seen above the title block. This revision issue would tell us what are all the changes made.
Examples of P&ID


Free P&ID developing tools?
- Edraw max–This tool can be utilized to do multiple drawings, this tool has P&ID software which can be used to create the P&ID diagram.
Supported system – windows, Mac, Linux, and web
2. Lucidchart– This is a tool that can be used to create graphs and charts and it can also be used to create the P&ID.
Supported system- No desktop app but it is compatible with most of the browser
3. Smartdraw – This tool can be used to make many technical diagrams and it can also be used to create the P&ID.
Supported system – Windows and web
4. Visual paradigm – This is a system modeling design software and we can also use this software to create the P&ID.
Supported system – Windows, Mac, and Linux
5. PROCAD P&ID – This is specialized piping design CAD software, we can easily create P&ID diagrams easily without spending a lot of time in documentation.
Supported system – windows
What are the advantages of P&ID?
- Process control
- Process operation can be carried out easily
- Less maintenance
- The operational life of the equipment and instrument can be improved
- We could determine the faulty section very easily
- The safety of the operator can be determined
What are the disadvantages of the P& ID?
- This diagram is not geometrically accurate
- It is not definitive
- Not to scale
- It is not drawn consistently