Process sector engineers and maintenance experts will find excellent diagnostic and planning tool in the Mean Time Between Failures (MTBF) Calculator. It helps in determining the system’s average time between inherent failures during running state. Predicting equipment reliability, planning preventative maintenance, and reducing unexpected downtime in essential instrumentation systems including transmitters, control valves, analyzers, and PLCs MTBF relies mostly on MTBF.
Among the main reliability metrics applied in asset management techniques like predictive maintenance (PdM), reliability-centered maintenance (RCM), and SIL validation for safety-critical instrumentation is MTBF.
Why MTBF Calculation is Crucial in Process Plants ?
Knowing the MTBF of a device or system helps planner and engineers to:
- determine equipment breakdown and arrange repairs before they cause disturbance of operations.
- Evaluate two or more manufacturers’ or equipment models’ reliability.
- Use predicted time to failure to guide spare part inventories.
- Justify replacement or upgrade investments.
- Verify the accuracy criteria needed for Safety Instrumented Functions (SIFs).
Calculating MTBF helps increase plant uptime and operational safety in process facilities where instruments run 24/7 in challenging circumstances (e.g., high temperature, pressure, vibration, or corrosive conditions).
What is meant by MTBF?
MTBF (Mean Time Between Failures) is the average time between two consecutive repairable failures of a system or component. It reflects the reliability and availability of equipment. A higher MTBF value indicates that the system runs longer without failure, making it more dependable and efficient in operation.
What is the MTBF formula?
Formula used in MTBF Calculation
The MTBF is calculated using a below simple formula:
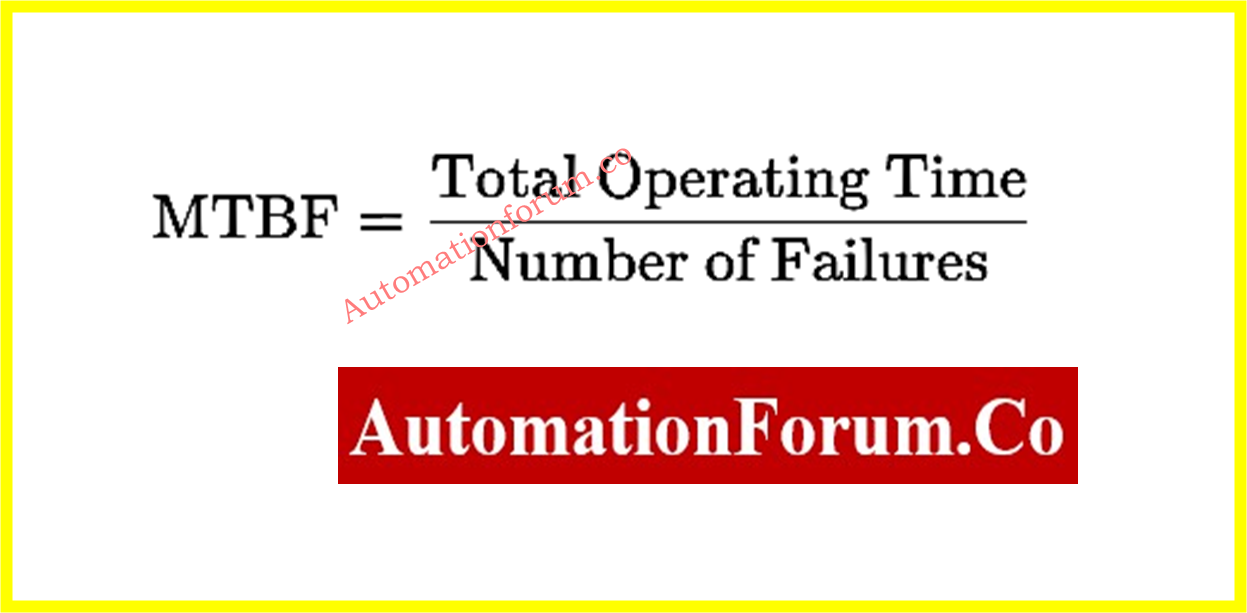
Where:
- MTBF = Mean Time Between Failures (in hours)
- Total Operating Time = The cumulative operational time of the system (in hours)
- Number of Failures = Count of observed breakdowns or malfunctions during that time
Designed mostly for repairable systems, this formula assumes a constant failure rate. MTBF offers no indication of time to first failure. It shows the typical interval between two successive failures in regular running.
How to use this MTBF Calculator ?
Follow these steps to use the calculator effectively:
Step 1: Collect the necessary data
- From control system logs or shift records, note the equipment’s overall running hours.
- Over the same period, calculate the functional failures of that particular instrument or component.
Step 2: Input values
- Now enter the overall operational duration expressed in hours.
- Now we will count the mistakes.
Step 3: Get the result
- The calculator will figure the MTBF in hours.
Step 4: Interpret the result
- Greater MTBF indicates more reliability.
- A lower MTBF could point to bad selection, outdated technology, extreme environments, or maintenance gaps; it also suggests more frequent failures.
How do you calculate MTBF?
Example Calculations in Refinery FCCU & Boiler Steam Drum Instrumentation
Example 1: Control Valve Actuator Failure in Refinery FCCU
In the Fluid Catalytic Cracking Unit (FCCU), regenerated catalyst air is controlled by a pneumatic control valve. This valve has failed four times over two years, needing actuator diaphragm repair since it has run for 16,000 hours.
Step 1: Apply the formula
MTBF = Total Operating Time / Number of Failures
MTBF = 16,000 / 4 = 4,000 hours
Interpretation:
The control valve has a mean failure interval of 4,000 hours. Maintenance can now be planned around this interval for inspection or preventive part replacement. If this value is lower than the manufacturer-specified MTBF, field conditions may be degrading the valve prematurely.
Example 2: Pressure Transmitter in a Steam Drum
Installed on a boiler steam drum, a pressure transmitter recorded 9,500 hours of use. It failed once from high-velocity wet steam impingement causing diaphragm contamination.
Step 1: Apply the formula
MTBF = 9,500/1 = 9,500 hours
Interpretation:
The rather high MTBF points to consistent operation. However, reducing such as impulse line snubbers or remote diaphragm seals could help future reliability since failure was caused by process conditions rather than inherent component failure.
Refer the below link for Top 10 Essential Maintenance Metrics Every Reliability Engineer Must Track
Where Is MTBF used in Process Instrumentation?
- Reliability-Centered Maintenance (RCM): Reliability-Centered Maintenance (RCM) guides instrument preventive maintenance priority.
- SIS/SIL Validation: Used as input in Safety Integrity Level (SIL) calculations (e.g., using PFDavg).
- Asset Performance Management (APM): Long-term instrument replacement methods are decided upon by asset performance management (APM).
- Spare Parts Planning: MTBF trends support inventory control by means of spare part planning.
- Commissioning Baselines: Acts as a KPI for instrument reliability following installation.
- Maintenance Contracts: For vendors, MTBF is frequently a service level agreement (SLA) measure.
Who uses this MTBF Calculator?
This calculator is useful in many different process industry jobs:
- Maintenance Engineers for setting up predictive maintenance intervals.
- Instrumentation and Control Engineers to evaluate and compare product reliability.
- Reliability Engineers for conducting root cause analysis (RCA) and failure mode evaluation.
- Plant Managers for budgeting, asset replacement planning, and downtime analysis.
- SIS Engineers for confirming failure rates required in SIL assessment reports.
- OEM Vendors to benchmark field performance of their equipment.
Benefits of using the MTBF Calculator
- Enhances plant dependability: facilitates maintenance planning grounded on real failure trends.
- Lowers unforeseen downtime: With trend-based planning, helps prevent sudden breakdowns.
- Influences better choice of equipment: compares field failure statistics among models and providers.
- Supports safety assessments: Safety Integrity Level (SIL) reliability evaluations are fed by MTBF data.
- Reduces over-maintenance costs: If MTBF is rather high, avoid pointless maintenance.
Common Mistakes to Avoid During MTBF Calculation
- Wrong estimate of operational hours: Always factor real run-time, omitting downtime for maintenance or shutdown.
- Not separating between failure causes: Count only operational failures not planned shutdowns, trips from upstream reasons, or operator errors.
- MTBF is for repairable systems; MTTF or MTTR is for others. Mean Time To Failure (MTTF) relates to non-repairable objects including batteries or fuses.
- Calculating MTBF over extended operational histories helps to make it more significant using short duration datasets.
- Ignoring the severity of the failures: MTBF does not indicate the degree of damage caused by them For total awareness, mix it with failure mode statistics.
Example Applications Where MTBF Is Essential
| Equipment | Why MTBF Matters |
| Control Valve | Predict wear of stem, seat, positioner, and I/P convertor |
| Pressure Transmitter | Plan sensor recalibration or replacement |
| Solenoid Valve | Evaluate impact of frequent cycling |
| PLC Input Card | Monitor logic module life in high I/O density systems |
| Guided Wave Radar | Predict electronics degradation in hot/wet tanks |
What is the difference between MTBF and MTTR?
MTBF vs MTTF – Understanding the Difference
| Metric | MTBF | MTTF |
| Meaning | Mean Time Between Failures | Mean Time To Failure |
| Used For | Repairable items | Non-repairable items |
| Common Applications | Control valves, PLC modules, solenoids | Fuses, sensors, batteries |
| Maintenance Involved | Yes | No |
| Replacement Strategy | Repair and restore | Replace on failure |
A useful and statistically based instrumentation reliability planning tool is the MTBF Calculator. It helps process industry experts base replacement and maintenance decisions on past performance data. Calculating MTBF gives you an advantage in dependability-oriented maintenance whether your project is involving a pharmaceutical flowmeter, power plant transmitter, or refinery control valve.
Tracking MTBF for important field instruments on a regular basis helps you to ensure that performance, safety, and efficiency stay strong all through the running life of the plant.
Is higher or lower MTBF better?
A higher MTBF indicates greater equipment reliability, meaning fewer failures over time. This results in reduced downtime and lower repair costs. Conversely, a lower MTBF suggests frequent failures, leading to increased maintenance and higher operational expenses.
Here you can find over 200+ online instrumentation calculators
 for process instrumentation using this detailed calculator. Improve maintenance planning, reliability, and system uptime with real-world examples and industry guidance.)