What is cause-and-effect drawing?
The cause-and-effect diagram offers information about different causes and their trip effects on the field equipment.
This document is mostly used in emergency shutdown (ESD) and fire and gas systems (FGS) to identify various causes and their associated trips in a matrix style for better and simpler interpretation.
Causes can include a change in the state of a digital input, a High High/Low Low alarm from an analogue input, and interlock logic, among other things. Effects can include tripping a motor or pump, closing a valve, opening a pressure relief valve, activating an emergency alarm, Beacon/Hooter, and so on.
Detailed Explanation of Cause & Effect Drawings
Some projects categorize Cause and Effect is included in process documentation, and other ventures consider Cause and effect are included in the instrument’s deliverables.
A cause is something that makes something else happen, and an effect is what happens because of the cause.
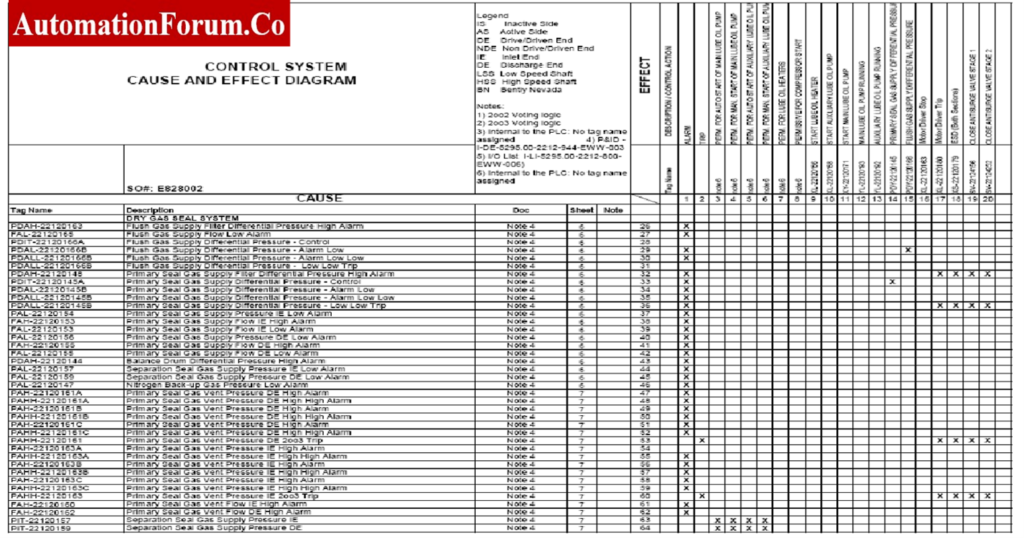
Cause-and-effect relationships can range from simple to complex. The concept of cause and effect is depicted as a matrix. The effects are mentioned in the top area, while the causes are given in the left section. Both are characterized by a tag number and their descriptions.
The clear intersection between the two indicates a cause-and-effect relationship. Marks could be in the form of the letters “X” for effect activation, “T” for effect activation with a time delay, and “P” for cause permitting effect activation.
There are two kinds of cause-and-effect charts:
- Fire and Gas C&E Diagram
- ESD C&E Diagram
What are documents Required for Preparation of Cause-and-Effect Drawing?
Reference document required for preparation of the cause and effect drawing:
- SAFE Chart: This Chart shows which safety devices are needed for each piece of process equipment. SAFE Chart will make sure that all safety requirements have been met and will show what actions the safety devices take.
- Philosophy: It provides the narrative, while the engineer translates it into cause-and-effect interaction so that the plant operates in accordance with the intended philosophy.
- ESD Logic Diagram: This Diagram illustrates the plant shutdown hierarchy and describes the inputs that initiate the shutdown as well as the outputs that follow from the shutdown.
What is the purpose of the cause and effect drawing?
The main purpose of the cause-and-effect document is to give clear direction to control system engineer to implement the correct control logic into ESD & FGS Systems using the defined programming language. This logic will always monitor the plant while it is operating condition and will activate if a predetermined condition is met.
Cause and Effect Example:


 to Kg/cm² Pressure Unit Conversion Calculator")

